Abstract
The human arterial vascular tree can be described by multicompartment models using electrical components. First introduced in the 1960s by Noordergraaf and Westerhof, these hardware-based approaches required several simplifications. We were able to remove the restrictions using modern software simulation tools and improve overall model quality considerably. Whereas the original Westerhof model consisted of 121 Windkessel elements, the refined model has 711 elements and gives realistic pulse waveforms of the aorta and brachial and radial arteries with realistic blood pressures. Moreover, novel insights concerning the formation of the physiological aortic-to-radial transfer function were gained. Its being potentially due to the coupling of many small resonant elements gives new impetus to the discussion of arterial pressure wave reflection. The individualized transfer function derived from our improved model incorporates distinct patient characteristics and can potentially be used for estimation of central blood pressure values.
NEW & NOTEWORTHY We were able to find an individualized transfer function giving realistic pulse waveforms and blood pressures using a multicompartment model of the arterial system. Based on the hardware-built Westerhof approach, several simplifications initially introduced in the 1960s could be reversed using software simulation. Overall model quality was improved considerably, and multiple coupled resonances were identified as potential explanation for the formation of the aortic-to-radial transfer function, giving new impetus to the discussion of arterial pressure wave reflection.
Keywords: artificial arterial system, multiple coupled resonances, software-based
INTRODUCTION
The human arterial vascular tree can be described by multicompartment models using electrical components. Given the analogy of the blood flow in the circulatory system and electrical current, the properties of resistor R, inductor L, and capacitor C (RLC) circuits are used to represent physical arterial characteristics. Previously, this was mostly based on mathematical or physical models until Noordergraaf and coworkers (11) introduced the prototype of a passive electronic analog model in the 1960s. A total of 113 hardware RLC circuits were interconnected to express the architecture of the arterial tree, each segment representing approximately 2–8 cm of a vessel. Whereas serially connected resistors and inductors mimic the conduit resistance of an artery and the viscous and inertial properties of blood (longitudinal impedance), capacitors correspond to the wall compliance (transverse impedance). The model was refined by Westerhof and coworkers (18) tackling contradictory assumptions made initially. The modifications included incorporating the effect of elastic taper as well as the use of a symmetrical network. The number of RLC circuits was increased to 121. Although the Westerhof approach convincingly models the behavior of many aspects of the human vascular tree, its being built on hardware components involved from the start several concessions such as the numerical limitation of lumping segments. The use of state-of-the-art software simulation could potentially improve overall model quality. Recreating the Westerhof model with modern tools should be able to meet the following expectations: 1) using a flexible function generator simulating the human heart at different systolic and diastolic pressures, flows, cycle times, and times of incisura; 2) reproducing pulse waveforms of at least the aorta and radial and brachial arteries; and 3) giving realistic blood pressures at these locations, including pulse pressure amplification, a constant diastolic pressure, and a secondary systolic peak (often referred to as the “reflected wave”).
Based on a realistic model of the human arterial vascular tree, calculation of central blood pressure from peripherally acquired pulse pressure curves was able to be performed. Central pressure values may be a more physiological measure of cardiac afterload and function; its determination during heart catheterization is used as gold standard. However, it is not feasible in clinical routine due to its invasiveness. With novel noninvasive methods becoming available, there is growing evidence that peripheral estimates of central blood pressure may be superior to conventional peripheral measurements in terms of predicting end-organ damage as well as monitoring therapeutic interventions (12, 13, 16, 19). Different transfer functions have been proposed to estimate central blood pressure values from peripheral waveforms. A concept using a generalized transfer function applied to radial recording using applanation tonometry is implemented in the SphygmoCor (AtCor Medical, Sydney, Australia). The technique is frequently employed and is used commonly as a noninvasive reference (3). Nevertheless, adaption of the underlying aortic-to-radial transfer function including individual patient characteristics rather than a population average should be able to improve estimations of central blood pressure further. As a consequence of the previous three points, we additionally try to 4) individualize the model by modifying the R, L, and C and heart parameters so that a measured pulse wave may be reproduced and 5) find an individualized transfer function incorporating distinct patient characteristics.
The aim of the investigation therefore was to rebuild and potentially refine the Westerhof model using modern simulation tools, reproduce a measured pulse waveform, and find a corresponding transfer function allowing the calculation of central blood pressure values from peripheral readings.
METHOD DEVELOPMENT AND RESULTS
Reproduction of the Westerhof model.
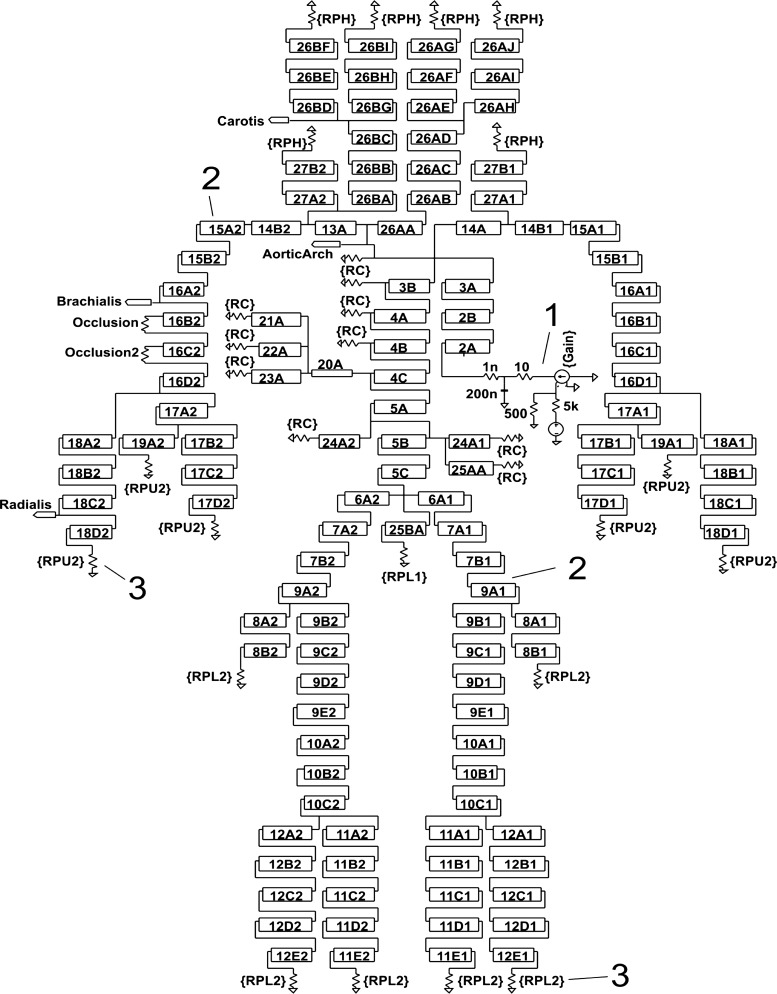
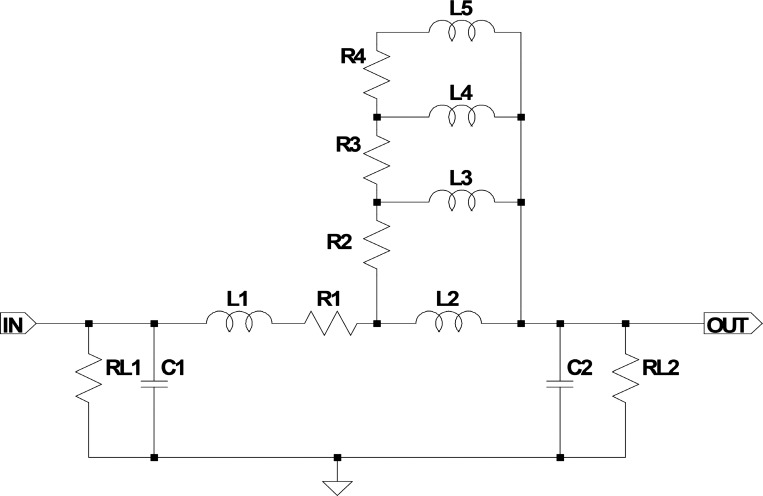
For the software-based reproduction of the Westerhof model (Fig. 1), we decided to use LTspice XVII (Linear Technology, Milpitas, CA) based on the standard simulation software SPICE (University of California, Berkeley, CA). The rectangular boxes in the schematics are subcircuits, and each of them represents a segment of an artery, a so-called Windkessel element (Fig. 2). The underlying simulation code is available under the GNU General Public License v3.0 and can be downloaded from GitHub (https://github.com/GerSchumacher) after sending a GitHub username to the authors.
Fig. 1.
Reproduced Westerhof model schematics. 1: Ventricular pump simulation circuit. 2: 2A . . . 27B2: arterial segments, numbering according to Westerhof. 3: Software-adjustable peripheral resistances (RC, RPH, RPU1, RPU2, RPL1, and RPL2).
Fig. 2.
Electrical representation of a segment of an artery in the original Westerhof model. R1 . . . . n: resistances represent the series (conduit) resistances acting against the flow of blood in the arteries and are mainly influenced by the square arterial diameter and viscosity. L1 . . . n: inductors represent the inertial properties of blood and are dependent on blood density and arterial diameter. C1 . . . n: capacitors represent the compliant properties of the arteries, mainly influenced by the elastic modulus of the arterial walls, arterial radius, and wall thickness. RL1 and RL2: load resistances (leakage resistances). R2 to R4 and L2 to L5 refer to the Westerhof correction network. A detailed description of the electrical-physiological analogy can be found in Ref. 18 on page 124.
In the original model, the 121 segments could be adjusted by step switches to modify resistor R1 (the “radius”) and capacitance (C1 and C2). We replaced the function of the switches by adding system-wide multipliers for R, C, and L (L1). With these adjustment factors, we were easily able to simulate system-wide changes of the physical properties of the arteries. To simulate “stiffer” arteries, for example, we would simply apply an adjustment factor of 0.5 to all C values of all segments and observe the results in the waveforms of distinct locations.
In the Westerhof model, the ventricular pump representation was realized by a waveform synthesizer. The refined solution consisted of a voltage-dependent current source element that is controlled by a piecewise linear voltage source. Of course, the physiological aortic flow waveform is not composed of linear segments and does not show sharp edges. Therefore, a low-pass filter was appended to the current source that eliminates the high frequencies of the edges and smooths the flow curve. With these components, we were able to generate arbitrary flow patterns that are close to reality using only a small number of control parameters.
Observations made in the reproduced Westerhof model.
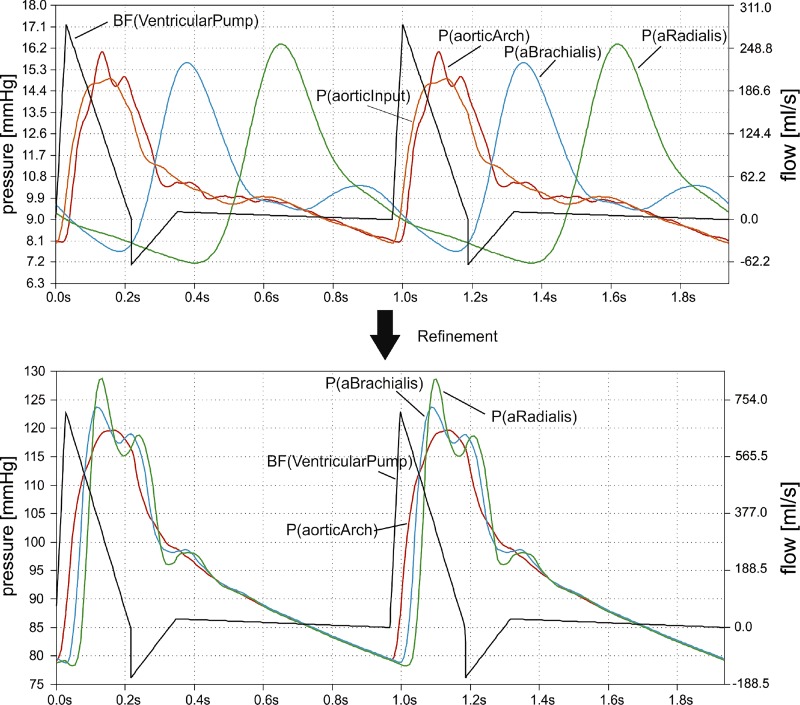
In Fig. 3, top, the voltages (pressures) along the aortic-to-radial line are shown. Our positive findings from the model were as follows. 1) It was possible to generate more or less realistic curves in the upper aorta. 2) There was some kind of pulse pressure amplification along the aorta. 3) The ventricular pump and its parameterization worked as expected. 4) There was a reflected wave in the aortic arch.
Fig. 3.
Blood flow and pressures in the original and refined Westerhof model. Top: ventricular pump output flow (black) and pressures between aortic input (orange) and radial (green) artery in the original Westerhof model (software reproduction). Bottom: pulse wave travel from aortic arch (red) to a. radialis (green) in the refined Westerhof model. P(aorticInput) is omitted in the refinement diagram as it is nearly identical to P(aorticArch) and interferes graphically. In both diagrams, currents and voltages are translated to blood flow [BF (in milliliters per second) on right y-axis, uncalibrated] and pressures [P (in millimeters of mercury) on left y-axis] for better understanding.
Unfortunately, there were also aspects that were not satisfying at all. 1) The more distal the measurement location, the more unrealistic the curves appeared. Their contours were too soft and without distinct peaks. 2) The diastolic pressure decreased in the periphery. 3) The pulse wave velocity was much too low.
In the lower limbs, the simulated pulse waves seemed to be more realistic than those of the upper limbs. These findings correspond to Avolio’s (2) reports of pressure and flow waveforms correlating well with reality in the lower part of the body but not in the upper part.
Pulse pressure amplification in the Westerhof model.
The key question for understanding and improving the model was generating pulse pressure amplification and finding its controlling parameters. This was challenging because the model of the human arterial tree contained only passive electronic components for R, C, and L. RL is negligible in this context because it is quite high compared with R. If only R, L, and C components are available, a resonance circuit generating a voltage overshoot near to its resonance frequency is the only way of amplifying a voltage pulse in electronics. We therefore assumed that the misbehavior of the peripheral pulse waveforms was due to mistakenly dimensioned Windkessel RLC circuits all having far too low resonance frequencies.
At this point, it is important to understand that in the 1960s an electronic analog of the arterial tree needed to be simplified by aggregating (lumping) segments of the arteries. Originally, the arterial properties (resistance, compliance, and blood mass inertia) were determined for 1-cm artery segments, which would have resulted in >700 Windkessel elements for the model. When simplifying this by lumping several Windkessel elements to 1 single element, Noordergraaf, Westerhof, and colleagues (11, 18) reduced the number of Windkessel elements to ~100 elements, a number that could be built in hardware. Noordergraaf et al. (11) described the relation between the lumped R, L, and C values for any lumping size Δx compared with the R′, L′, and C′, which were calculated for the size of 1 cm:
This, however, ignores the resonant properties of the arterial segments and their importance for the transmissibility of the pulse wave. Although Noordergraaf et al. (11) knew that the height of the resonance peaks was distorted, they did not attach high importance to this fact, presumably because of the lack of our modern simulation tools. Westerhof accepted Noordergraaf’s lumping formulas in his improved model.
Refining the Westerhof model.
With software-based modeling, we were able to reverse the lumping and increase the arterial segments from 121 to 711. Depending on the specific lumping size of each original element, we replaced all 121 single elements by subcircuits holding ≤8 1-cm segments.
We found that the correction network serving for longitudinal and transverse impedance in an artery segment (L2, L3, L4, L5, R2, R3, R4, and R5 of the original Westerhof segment; Fig. 2) had only small impact on the simulation result. Omission improved the simulation time dramatically. Similar to the original Westerhof model using step switches, we included some adjustment factors for the most relevant components in the artery segments to be able to simulate different arterial conditions. Additionally, we improved the terminating peripheral resistances by changing them from a pure resistance to a small R-R-C network. Nevertheless, it should be emphasized that all component values in the artery segments are still based on the original Westerhof component values recalculated to 1-cm segments.
With the same ventricular flow pattern and very similar adjustment factors, Fig. 3, bottom, shows the pulse waves of the refined Westerhof model. Peripheral pulse waves as well as pulse wave velocity seem to be more realistic than in the original model. In distal direction, pulse pressure increases due to significant amplification, whereas diastolic pressure decreases only little. Moreover, modifications in the peripheral resistances allow running the model at a realistic voltage and pressure level (around 119 mmHg in the aorta and 128 mmHg in the radial artery in the example of Fig. 3).
Individualizing the refined model.
Reducing the number of required parameters made individualization of the model manageable. With respect to the produced waveforms, the refined model can be controlled by only eight parameters: the R, L, and C adjustment factors for overall arterial conduit resistance multiplier (dMult), overall blood inertia multiplier (lMult), and overall artery wall compliance multiplier (cMult). The remaining five parameters control the ventricular pump, time of maximum, steepness of falling edge, time of valve closure, amplitude of negative overshoot, and length of negative overshoot, whereas the cycle time itself is fixed to a test person’s measured cycle length. If the generated model waveform is satisfactory, the absolute pressures in the model can be controlled by modifying adjustment factors for the peripheral resistances and for the amplitude of the ventricular pump pulse. We found that using these model parameters, we could simulate many well-known different radial waveforms.
Abnormal or diseased vascular states may be manifested by increased conduit resistances R (e.g., stenosis, thrombosis, vascular tone dysfunction), increased inertial properties of blood L (e.g., high hematocrit), or low arterial compliance C (e.g., stiff or inflamed arteries due to arteriosclerosis or atherosclerosis). Therefore, it is evident that a person’s individual multipliers dMult, lMult, and cMult will correspond very well to his or her specific arterial health state.
Representative case studies using the refined model.
Radial pulse waves were recorded in supine position using VascAssist 2 (iSYMED, Butzbach, Germany) based on oscillometric measurements using sample rates of 1 kHz. The raw signals were measured in sequences of ≥15 pulse cycles and denoised by spectral filtering using efficient complex forward and backward fast Fourier transforms, which supported arbitrary-length input data. Baseline wandering, artifact-affected cycles, extra-long cycles, and pulse cycles showing extrasystoles were removed. After a final ensemble-averaging, the signal processing resulted in 1 clean average pulse cycle per sequence. Brachial tracings were registered bilaterally for calibration following ≥10 min of rest in a calm room. Triplicate radial measurements were then taken from both wrists following pauses of 30 s. Ethical board approval (Medical Ethics Committee II, Medical Faculty Mannheim, Heidelberg University, Mannheim, Germany) and written, informed consent were obtained for all measurements involving human data.
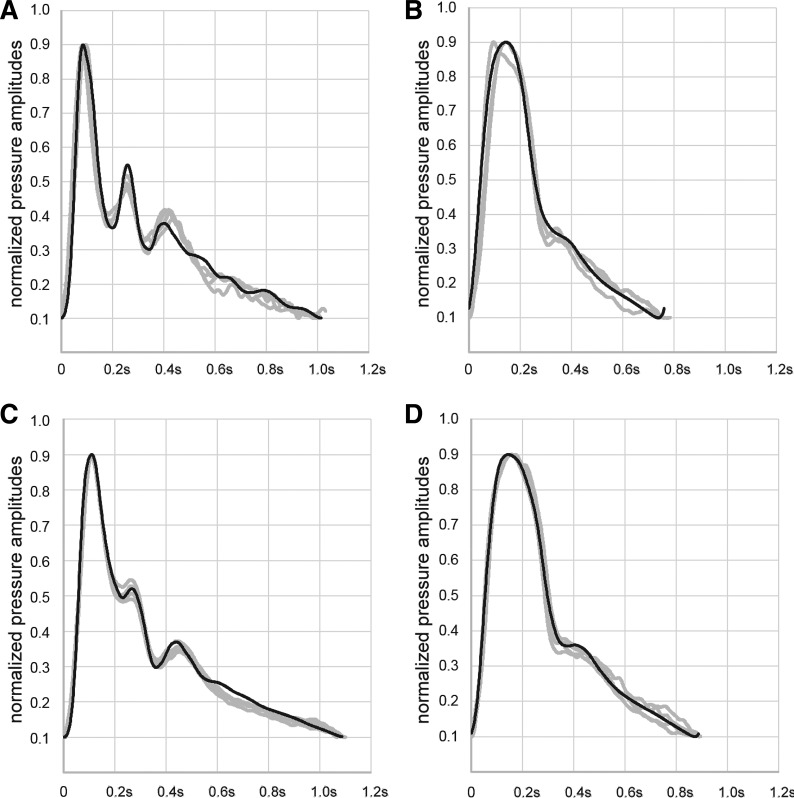
A proprietary software tool is able to run SPICE simulations and tries to find the 8 model parameters needed to gain a high correlation between measured and simulated curves. The simulation settings in SPICE terms were maxstep = 0.05 ms, abstol = 0.01, chgtol = 0.1, and vntol = 0.01. With reasonable precision and parameter ranges, the number of possible parameter combinations is ~7.6 × 10¹³. Therefore, an effective search algorithm had to be found. Finally, we decided to use an evolutionary optimization algorithm (6) using the correlation between measured and simulated pulse curves as its fitness function. When running on a high-performance personal computer (Intel Xeon Processor E5-2690, 2.60 GHz, 12 cores, 24 logical processors, 128-GB random-access memory, operating system: Microsoft Windows Server 2012), the algorithm is able to find a sufficiently precise model parameter set in about 5–10 min. Because the adjustment factors may relate to different states of vascular health, Fig. 4 shows examples of how the radial pulse wave may be altered in these states.
Fig. 4.
Case studies. Examples of measured (gray) and simulated (black) radial curves in different states of vascular health. A: 20-yr-old woman with very strong oscillations and low resistance (cMult = 0.90, dMult = 7.1, and lMult = 1.3). B: 88-yr-old woman (cMult = 0.41, dMult = 65.5, and lMult = 2.8). C: 57-yr-old man with intensive sporting activities and low resistance (cMult = 0.60, dMult = 16.6, and lMult = 1.9). D: 47-yr-old woman with little sporting activities and higher resistance (cMult = 0.50, dMult = 54.7, and lMult = 2.6). Waveforms were normalized to facilitate comparison setting diastolic minima to absolute values of 0.1 and systolic maxima to 0.9. Values were chosen due to internal steps of signal processing.
Individualized transfer function incorporating distinct patient characteristics.
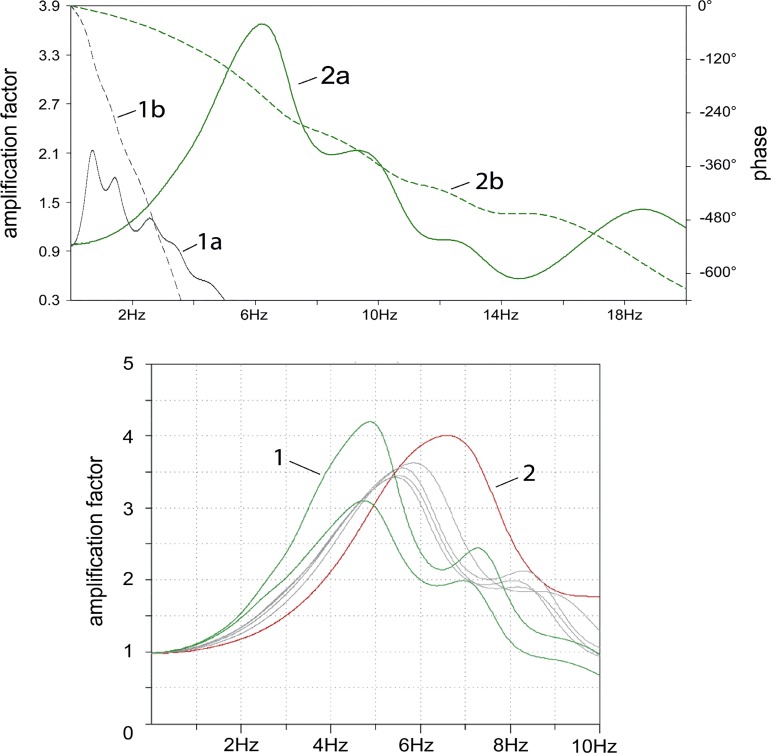
Transfer functions between two locations may contain important information about the validity and closeness to reality of the underlying model. We therefore used LTspice IV measurements of the complex transfer function between aorta and radial artery to compare our findings with previously published transfer functions (10). We found very good agreement concerning the shape and maximum amplification in the range 4–6 Hz in our modified model. In contrast, the original Westerhof model showed a significantly differing 0.5-Hz maximum amplification in its transfer function (Fig. 5, top). Moreover, when adjusting the parameters cMult, lMult, and dMult of the refined model, it becomes clear that different states of vascular health lead to different frequency responses (Fig. 5, bottom).
Fig. 5.
Transfer functions. Top: comparison of the Westerhof original (1a: transfer function on left y-axis; 1b: phase response on right y-axis) and refined transfer functions (2a: transfer function; 2b: phase response) showing significant differences in the main resonances around 0.5 Hz and in the range 4–6 Hz, respectively. Bottom: transfer functions of individuals with different vascular health. Curve 1 represents healthy arteries (cMult = 0.7–0.8, lMult ≈ 2, and dMult ≈ 15), and curve 2 comes from stiff and narrow arteries (cMult = 0.2, lMult = 4, and dMult = 50). Gray curves are based on near-to-average adjustment factors.
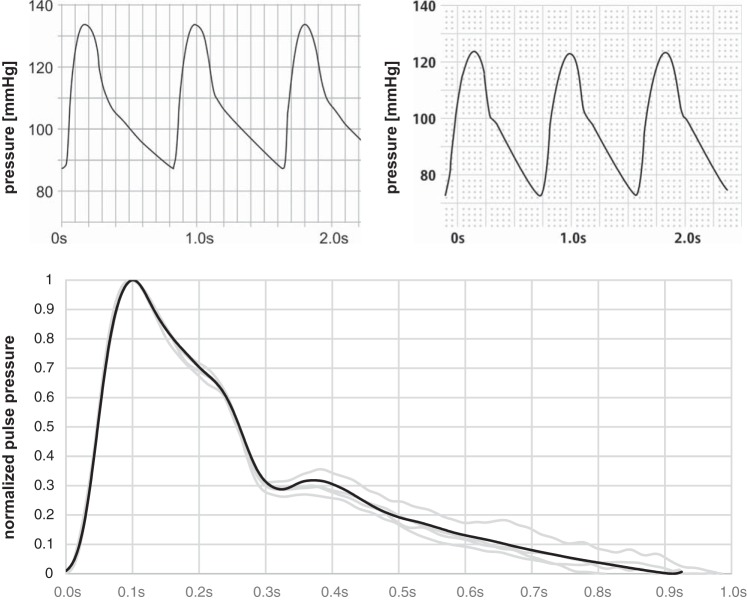
Although the commonly used generalized transfer functions have a similar maximum amplification and similar aspects of the waveform can be found, they nevertheless represent averaged functions from a specific cohort. Based on these findings, we used an individualized transfer function for estimation of aortic pressure curves from the radial measurements. As a proof of concept, we compared a noninvasive estimate of the central curve with invasive measurements taken at the aortic root during left heart catheterization (Fig. 6). We used a 5-F pigtail pressure measurement catheter (Boston Scientific, Marlborough, MA) averaging blood pressure values from 12 heart cycles. Data were collected in supine position following a clinically indicated routine coronary arteriography after written, informed content and ethical board approval (see above) were obtained.
Fig. 6.
Proof of concept. Top: comparison of estimated (left) and invasively measured (right) central pulse curves. There was error of 6% between estimated and measured (aortic root) central systolic blood pressure and an 18% error for central diastolic blood pressure, respectively. Bottom: software simulation showing an excellent model quality (Pearson correlation between mean of measured data set and simulated data set is 99.8%) of the measured radial (gray) and the estimated radial (black) curves. The following parameters were used: cMult = 0.45, lMult = 1.9, and dMult = 29.8. Waveforms were normalized to facilitate comparison setting diastolic minima to the absolute value 0 and systolic maxima to 1.
The aortic-to-radial transfer function being formed by multiple coupled resonances.
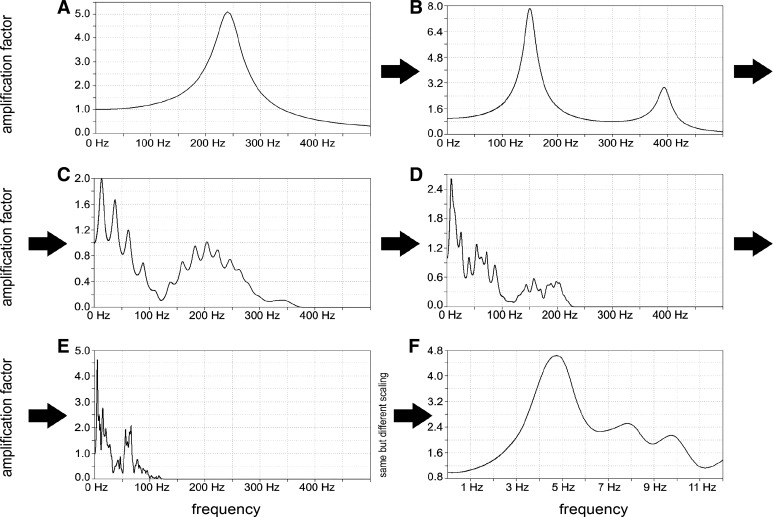
To understand how the aortic-to-radial transfer function develops, an individualized model of a healthy young person was used and several tests were performed in LTspice where different sections of the model were isolated. Comparing the transfer functions of these sections led to the conviction that multiple coupled resonances are the main reason for the formation of the aortic-to-radial transfer function as illustrated in Fig. 7. We found that the resonant behavior of the aortic-to-radial section with a main resonance frequency around 5 Hz in a healthy person cannot be explained by the resonant behavior of a single Windkessel element for which the resonance frequency is much higher. The overall resonant behavior of the arterial tree systems is caused by coupling many Windkessel elements, leading to many different resonance frequencies. Thus they form an overall main resonance frequency at a much lower frequency than that of a single element. This behavior of resonant circuits connected in series can be found in several areas of physics and engineering (1).
Fig. 7.
Formation of the aortic-to-radial transfer function. A: transfer function of a single radial Windkessel element of the individualized model. Resonance frequency (RF) 240 Hz is very high compared with the resonance frequency of the physiological transfer function at about 4–6 Hz. B: 2 radial Windkessel elements create 2 RFs at 150 Hz and a smaller 1 at 390 Hz. C: isolated section of complete radial artery having 23 Windkessel elements with different properties: a transfer function containing >16 (presumably 23) RFs is found with lowest and most dominant RF at 14 Hz. D: isolated section of the lower arm (branched, starting at brachial artery in distal direction) containing 73 Windkessel elements. The transfer function is inhomogeneous with a quite dominant low RF at 8.4 Hz. E: transfer function between ascending aorta and radial artery consisting of 711 Windkessel elements. The lowest and most dominant RF is at 4.7 Hz, and the complete model looks like a typical physiological aortic-to-radial transfer function. F: same as E showing only frequencies from 0 to 12 Hz (well-known from physiological transfer function).
These observations let us call into question the common explanation of the origin of the secondary systolic wave. Usually, it is assumed that the secondary wave is caused by distal wave reflections forming a backward wave. This is propagated back to the aorta, creating a second systolic pressure peak, and even adds onto the primary pressure peak (10). However, this explanation is not entirely undisputed. Tyberg et al. (15) reported that pressure measurements at four sites in the canine aorta showed the backward wave appearing first in the ascending aorta and only later in the distal aorta. They concluded that “this unexpected result forces us to question the fundamental presuppositions of the usual analysis.”
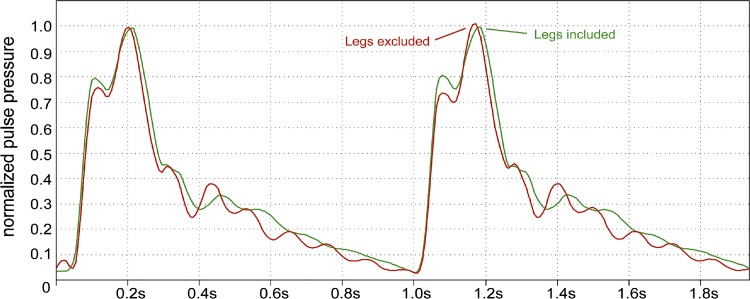
An experiment in the refined model demonstrates that even a total occlusion of the legs behind the aortic bifurcation does not result in essential changes of height and position of the secondary systolic pulse wave compared with the unoccluded model (Fig. 8). When occluding the arm and brain arteries, the influence on the thoracic waveform is quite low and the secondary wave does not disappear even when occluding all arteries of legs, arms, and brain. This is also an indication that the secondary systolic peak is not a result of distal wave reflection but has its origin in the resonant behavior of the arterial tree.
Fig. 8.
Experimental occlusion of the legs. Experimental total occlusion of the legs behind the aortic bifurcation does not result in essential changes of height and position of the secondary systolic pulse in the refined model. Pulse pressure was normalized at thoracic aorta setting diastolic minima to the absolute value 0 and systolic maxima to 1.
DISCUSSION
We were able to reproduce the Westerhof model based on software while gaining important insights for understanding and improving its behavior. Focusing on pulse pressure amplification along the peripheral lines, simplifications initially made by lumping segments of the arterial tree in the electronic analog were overcome. We were able to improve overall model quality, yielding realistic pulse waveforms of the aorta and brachial and radial arteries with realistic blood pressures. Nevertheless, all component values in the artery segments are still based on the Westerhof original. The parameters that have been adjusted to have a good correlation between measured and simulated pulse waves seem to represent the physiological status of an individual’s arteries. A method has been developed that enables finding these adjustment parameters automatically in a reasonable time. Although we used a distinct commercially available device, radial recordings are independent of the method used as long as it provides a sufficient resolution, filtering, and reproducibility.
Based on our findings, we were able to identify an individualized transfer function incorporating distinct patient characteristics for estimation of central blood pressure values. Moreover, the refined model is able to explain the formation of the physiological aortic-to-radial transfer function in general. Its obviously resonant nature seems to be a result of coupling many small resonant elements into a complex arterial tree. This new insight can give a new impetus to the discussion of arterial pressure wave reflection, which is still questioned by certain researchers (15). Provided the refined Westerhof model reflects the physiological reality, we hypothesize that wave reflections are not the reason for the secondary systolic peak but rather the result of multiple coupled resonances in the arterial tree. This is further substantiated by the fact that the refined model is not really new but only corrects some simplifications in the original Westerhof model resulting in far too low resonance frequencies. As our experiments in the refined model demonstrate, the aortic-to-radial transfer function develops along the way from ascending aorta to the radial artery as do the secondary systolic waves, which do not emerge at distinct distal locations but develop on the whole way from the ascending aorta to the location where they are measured. To our knowledge, this is the first time that the formation of the well-known aortic-to-radial transfer function could be explained and demonstrated in an individualized arterial tree model.
Potential application of our refined model is not restricted to educational or research purposes only, while experimental confirmation is still lacking. For example, noninvasive measurements of central blood pressure may be beneficial in the clinical context. Concerning the management of patients with hypertension, there are important differences between classes of antihypertensive drugs regarding their effect on central values. For instance, the effect of β-blockers on lowering blood pressure is overestimated (8, 9). This may be explained by changes in arterial properties caused by bradycardia, increasing central systolic and pulse pressures (4), although further mechanistic research still needs to be performed. An individualized arterial tree model could be useful for the software-based investigation of these drug effects in the future.
Invasive determination of central hemodynamic parameters showed an association between inflection time and augmentation index of the ascending aorta and the risk of coronary heart disease in symptomatic patients at risk (7). These findings were able to be confirmed noninvasively using applanation tonometry (17). Whereas these conventional parameters are more or less indirect indicators of the arterial properties, we postulate that the adjustment factors used in the refined model correspond directly to overall arterial conduit resistance (dMult), blood inertia (lMult), and artery wall compliance (cMult) of an individual patient. They may represent different states of health and therefore be useful for the estimation of biological vascular age. The ability to control the vascular tone is impaired by aging and by endothelial dysfunction (5, 14), resulting in hypertension and atherosclerosis. Assuming that a disbalance of the vascular tone will also be present in a resting state, we hypothesize that an increased conduit resistance detected with the refined model could be an early indicator of endothelium disbalance and atherosclerosis. This working hypothesis should be validated in a clinical study, for instance, using measurement of flow-mediated dilatation as the accepted gold standard. Moreover, further investigations are recommended to assess the potential of the refined model for risk prediction and possibly to guide invasive evaluation of patients at risk for premature coronary heart disease.
Although our adaptations of the Westerhof model are very promising, there are limitations that should be taken into consideration. First, we put great effort into optimizing the model for the section between aorta and radial artery. Nearly all realistic pulse wave contours can be simulated in this section. Nevertheless, the simulated curves and reproduction in lower body and cerebral arteries should be validated and possibly optimized clinically. Second, stiffness and blood inertia are assumed to increase or decrease evenly in all parts of the arterial tree. This is a simplification that can result in inaccuracies when only certain areas are affected by certain conditions. Third, it is known that physical arterial properties, in contrast to the electronic components in the model, are not absolutely linear in relation to pressure. This could be the reason why in a small number of measurements we observed higher deviations between modeled and measured curves for test persons having both systolic pressures >160 mmHg and low conduit resistance (dMult). This should also be clinically investigated to specify potential exclusion criteria. Moreover, it is known that arterial properties may vary within individuals by factors like time of the day, time since last meal, time since exercising or other physical efforts, mental state, medications, and others. Some individuals’ parameters seem to fluctuate more than those of others, which has to be kept in mind when interpreting measurement results. Finally, the simulated curves after the incisura sometimes continue to oscillate, whereas the real curve decreases exponentially to the diastolic pressure. This happens very often in radial curves that show already high oscillations during systole. We believe that the difference between model and reality is the reason for that phenomenon because the closing of the heart valves disturbs the resonance oscillations in the upper aorta, a behavior that is not reflected in our model at all.
Conclusion.
We were able to improve overall model quality of the Westerhof approach, yielding realistic pulse waveforms of the aorta and brachial and radial arteries with realistic blood pressures. Moreover, the refined model is able to explain the formation of the physiological aortic-to-radial transfer function, in general being potentially due to the coupling of many small resonant elements. This new insight can give a new impetus to the discussion of arterial pressure wave reflection and may be used for both research and educational purposes. The individualized transfer function derived from our improved model incorporates distinct patient characteristics and can potentially be used for estimation of central blood pressure values. These could be beneficial in the management of patients with hypertension, revealing important differences between classes of antihypertensive drugs in clinical routine.
GRANTS
The project was partially promoted by the Central Innovation Programme for SMEs funded by the Federal Ministry for Economic Affairs and Energy (BMWi), reference no. KU2994301KJ2.
DISCLOSURES
G. Schumacher is one of the founders and chief executive officer of iSYMED Gesellschaft mit beschränkter Haftung (Butzbach, Germany), which distributes a device (VascAssist) mentioned in this article. J. J. Kaden and F. Trinkmann report no conflicts of interest regarding this article.
AUTHOR CONTRIBUTIONS
G.S., J.J.K., and F.T. conceived and designed research; G.S. and F.T. performed experiments; G.S., J.J.K., and F.T. analyzed data; G.S., J.J.K., and F.T. interpreted results of experiments; G.S. and F.T. prepared figures; G.S., J.J.K., and F.T. drafted manuscript; G.S., J.J.K., and F.T. edited and revised manuscript; G.S., J.J.K., and F.T. approved final version of manuscript.
ACKNOWLEDGMENTS
We thank Beaufort J. Capper for the linguistic revision of the manuscript.
REFERENCES
- 1.Abramowicz A. Unified description of coupled resonators and coupled transmission lines. Acta Phys Pol A 119: 548–552, 2011. doi: 10.12693/APhysPolA.119.548. [DOI] [Google Scholar]
- 2.Avolio AP. Multi-branched model of the human arterial system. Med Biol Eng Comput 18: 709–718, 1980. doi: 10.1007/BF02441895. [DOI] [PubMed] [Google Scholar]
- 3.Cheng HM, Lang D, Tufanaru C, Pearson A. Measurement accuracy of non-invasively obtained central blood pressure by applanation tonometry: a systematic review and meta-analysis. Int J Cardiol 167: 1867–1876, 2013. doi: 10.1016/j.ijcard.2012.04.155. [DOI] [PubMed] [Google Scholar]
- 4.Dhakam Z, Yasmin, McEniery CM, Burton T, Brown MJ, Wilkinson IB. A comparison of atenolol and nebivolol in isolated systolic hypertension. J Hypertens 26: 351–356, 2008. doi: 10.1097/HJH.0b013e3282f283c9. [DOI] [PubMed] [Google Scholar]
- 5.Dinenno FA, Jones PP, Seals DR, Tanaka H. Limb blood flow and vascular conductance are reduced with age in healthy humans: relation to elevations in sympathetic nerve activity and declines in oxygen demand. Circulation 100: 164–170, 1999. doi: 10.1161/01.CIR.100.2.164. [DOI] [PubMed] [Google Scholar]
- 6.Ferreira C. Gene expression programming: a new adaptive algorithm for solving problems. Complex Syst 13: 87–129, 2001. [Google Scholar]
- 7.Hayashi T, Nakayama Y, Tsumura K, Yoshimaru K, Ueda H. Reflection in the arterial system and the risk of coronary heart disease. Am J Hypertens 15: 405–409, 2002. doi: 10.1016/S0895-7061(02)02260-4. [DOI] [PubMed] [Google Scholar]
- 8.Laurent S, Briet M, Boutouyrie P. Large and small artery cross-talk and recent morbidity-mortality trials in hypertension. Hypertension 54: 388–392, 2009. doi: 10.1161/HYPERTENSIONAHA.109.133116. [DOI] [PubMed] [Google Scholar]
- 9.Laurent S, Tropeano AI, Boutouyrie P. Pulse pressure reduction and cardiovascular protection. J Hypertens Suppl 24, Suppl 3: S13–S18, 2006. doi: 10.1097/01.hjh.0000229464.09610.ff. [DOI] [PubMed] [Google Scholar]
- 10.Nichols W, O’Rourke M, Vlachopoulos C. McDonald's Blood Flow in Arteries, Sixth Edition: Theoretical, Experimental and Clinical Principles. Boca Raton, FL: CRC Press, 2011, p. 197 and 610. [Google Scholar]
- 11.Noordergraaf A, Verdouw D, Boom HB. The use of an analog computer in a circulation model. Prog Cardiovasc Dis 5: 419–439, 1963. doi: 10.1016/S0033-0620(63)80009-2. [DOI] [PubMed] [Google Scholar]
- 12.Pini R, Cavallini MC, Palmieri V, Marchionni N, Di Bari M, Devereux RB, Masotti G, Roman MJ. Central but not brachial blood pressure predicts cardiovascular events in an unselected geriatric population: the ICARe Dicomano Study. J Am Coll Cardiol 51: 2432–2439, 2008. doi: 10.1016/j.jacc.2008.03.031. [DOI] [PubMed] [Google Scholar]
- 13.Roman MJ, Devereux RB, Kizer JR, Lee ET, Galloway JM, Ali T, Umans JG, Howard BV. Central pressure more strongly relates to vascular disease and outcome than does brachial pressure: the Strong Heart Study. Hypertension 50: 197–203, 2007. doi: 10.1161/HYPERTENSIONAHA.107.089078. [DOI] [PubMed] [Google Scholar]
- 14.Singh N, Prasad S, Singer DR, MacAllister RJ. Ageing is associated with impairment of nitric oxide and prostanoid dilator pathways in the human forearm. Clin Sci (Lond) 102: 595–600, 2002. doi: 10.1042/cs1020595. [DOI] [PubMed] [Google Scholar]
- 15.Tyberg JV, Bouwmeester JC, Shrive NG, Wang JJ. CrossTalk opposing view: forward and backward pressure waves in the arterial system do not represent reality. J Physiol 591: 1171–1173, 2013. doi: 10.1113/jphysiol.2012.249557. [DOI] [PMC free article] [PubMed] [Google Scholar]
- 16.Wang KL, Cheng HM, Chuang SY, Spurgeon HA, Ting CT, Lakatta EG, Yin FC, Chou P, Chen CH. Central or peripheral systolic or pulse pressure: which best relates to target organs and future mortality? J Hypertens 27: 461–467, 2009. doi: 10.1097/HJH.0b013e3283220ea4. [DOI] [PMC free article] [PubMed] [Google Scholar]
- 17.Weber T, Auer J, O’Rourke MF, Kvas E, Lassnig E, Berent R, Eber B. Arterial stiffness, wave reflections, and the risk of coronary artery disease. Circulation 109: 184–189, 2004. doi: 10.1161/01.CIR.0000105767.94169.E3. [DOI] [PubMed] [Google Scholar]
- 18.Westerhof N, Bosman F, De Vries CJ, Noordergraaf A. Analog studies of the human systemic arterial tree. J Biomech 2: 121–143, 1969. doi: 10.1016/0021-9290(69)90024-4. [DOI] [PubMed] [Google Scholar]
- 19.Williams B, Lacy PS, Thom SM, Cruickshank K, Stanton A, Collier D, Hughes AD, Thurston H, O’Rourke M; CAFE Investigators; Anglo-Scandinavian Cardiac Outcomes Trial Investigators; CAFE Steering Committee and Writing Committee . Differential impact of blood pressure-lowering drugs on central aortic pressure and clinical outcomes: principal results of the Conduit Artery Function Evaluation (CAFE) study. Circulation 113: 1213–1225, 2006. doi: 10.1161/CIRCULATIONAHA.105.595496. [DOI] [PubMed] [Google Scholar]


