



Abstract
Gravity and matched airway/vascular tree geometries are both hypothesized to be key contributors to ventilation-perfusion (V̇/Q̇) matching in the lung, but their relative contributions are challenging to quantify experimentally. We used a structure-based model to conduct an analysis of the relative contributions of tissue deformation (the “Slinky” effect), other gravitational mechanisms (weight of blood and gravitational gradient in tissue elastic recoil), and matched airway and arterial tree geometry to V̇/Q̇ matching and therefore to total lung oxygen exchange. Our results showed that the heterogeneity in V̇ and Q̇ were lowest and the correlation between V̇ and Q̇ was highest when the only mechanism for V̇/Q̇ matching was either tissue deformation or matched geometry. Heterogeneity in V̇ and Q̇ was highest and their correlation was poorest when all mechanisms were active (that is, at baseline). Eliminating the contribution of matched geometry did not change the correlation between V̇ and Q̇ at baseline. Despite the much larger heterogeneities in V̇ and Q̇ at baseline, the contribution of in-common (to V̇ and Q̇) gravitational mechanisms provided sufficient compensatory V̇/Q̇ matching to minimize the impact on oxygen transfer. In summary, this model predicts that during supine normal breathing under gravitational loading, passive V̇/Q̇ matching is predominantly determined by shared gravitationally induced tissue deformation, compliance distribution, and the effect of the hydrostatic pressure gradient on vessel and capillary size and blood pressures. Contribution from the matching airway and arterial tree geometries in this model is minor under normal gravity in the supine adult human lung.
NEW & NOTEWORTHY We use a computational model to systematically analyze contributors to ventilation-perfusion matching in the lung. The model predicts that the multiple effects of gravity are the predominant mechanism in providing passive ventilation-perfusion matching in the supine adult human lung under normal gravitational loads, while geometric matching of airway and arterial trees plays a minor role.
Keywords: computational model, lung, ventilation-perfusion matching
INTRODUCTION
The primary determinant of efficient gas exchange by the lung is the distribution of regional ventilation-perfusion (V̇/Q̇) ratios among its gas exchange units, yet there is significant heterogeneity in the distribution of alveolar ventilation (V̇) and perfusion (Q̇) in the normal healthy lung. This arises because of the interaction between the complex structure of the lung (including its tissue, airways, and blood vessels) and gravity, which affects the mechanical deformation of the lung parenchyma and influences blood flow distribution. Despite this heterogeneity, regional V̇ and Q̇ are sufficiently well-matched to support the requirements for gas exchange in the normal healthy lung. Understanding of the precise matching mechanisms of V̇ and Q̇ in normal lung function is essential for understanding how gas exchange is impaired in disease, yet current understanding is incomplete. The two main theories propose either gravity (38) or matched airway/arterial tree branching (10) as the primary determinant of effective V̇/Q̇ matching.
Gravity has direct action on the highly deformable lung tissue and blood in the pulmonary circulation. Early observations of gravitationally directed gradients in V̇ and Q̇ in the human lung using scintigraphy (38) and more recent imaging studies using magnetic resonance imaging (MRI) (17), single-photon emission computed tomography (SPECT) (24, 25) and positron emission tomography (PET) (37) point to gravity playing a major role in determining the distributions of V̇ and Q̇. Specifically, that gradients in Q̇ result from the balance of hydrostatic pressures at the capillary level [described by the “zonal” model (8)]; and/or that the displacement of lung tissue due to gravity [the “Slinky” effect (17)] increases the perfusion per unit volume of tissue in gravitationally dependent regions. The “Slinky” effect also explains the V̇ gradient based on greater compliance in gravitationally dependent tissue due to its smaller volume preinspiration (compared with a uniformly expanded lung) in comparison to tissue in the nondependent regions. That gravity acts on V̇ and Q̇ via a common mechanism is suggested to explain the relatively close matching of V̇ and Q̇ in the healthy lung.
An alternative hypothesis is that the innate matching branching geometry of the airway and pulmonary arterial trees results in well matched V̇ to Q̇. Evidence to support this comes from a range of animal and human experimental studies. In animals, the incomplete reversal of V̇ and Q̇ gradients following inversion of posture suggests that the vascular and airway trees could play a major role in determining V̇ and Q̇ distributions (11); studies using fluorescent microspheres (32) have shown significant and similar isogravitational heterogeneities in V̇ and Q̇ (1, 11, 32), with Glenny and Robertson (14) estimating that the contribution of gravity to perfusion distribution is only 7–25% in dogs; and fractal analysis showing that both V̇ and Q̇ exhibit similar fractal characteristics (1, 12). In human studies conducted in sustained microgravity, V̇/Q̇ heterogeneity was found to be similar to that under normal gravity (1G) (28), suggesting the persistence of a nongravitational mechanism in maintaining adequate V̇/Q̇ matching for gas exchange.
Notwithstanding their relative contributions, gravitational and structural mechanisms act in combination in the intact lung, and therefore they are extremely difficult to distinguish from each other experimentally. Clark et al. (6) showed how a structure-based computational analysis can be used to examine the relative contributions of multiple mechanisms that coexist and interact within the lung; in that particular example their contributions to Q̇ distribution was considered. The current study takes an approach similar to Clark et al. (6) to isolate the additive contributions of gravity from the influence of the matched airway and vascular trees. V̇/Q̇ matching and gas exchange are evaluated in the supine lung (for consistency with imaging) under normal and zero gravity, and with or without matched airway and arterial branching trees.
METHODS
Model Components
This study combines previously published models of the geometry of lung, airway (35), and pulmonary vasculature (5), with functional models of tissue mechanics (36), ventilation (33), perfusion (6), and oxygen transfer (19) to simulate V̇ and Q̇ distributions and oxygen exchange during tidal breathing in a healthy young adult in the supine posture. A summary of the model components is given below, with references to the original literature for the models, and noting any modifications that are specific to the current study. More detailed descriptions can be found in the appendix.
Structure-based models.
An anatomically structured model of the bronchial airways (from trachea to terminal bronchioles) was generated using the methods of Tawhai et al. (35). The model was generated for one representative subject from the Human Lung Atlas Database (Univ. of Iowa). Data were acquired retrospectively from this study, which was conducted under approval from the University of Iowa Institutional Review Board and Radiation Safety Committee. The subject was male, 22 yr old, 1.82 m tall, 82.6 kg (BMI 24.9 kg/m2), and with normal lung function by ATS criteria. Volumetric multidetector row-computed tomography (MDCT) imaging acquired at 50% and 95% of vital capacity was used for this study. The lung surfaces and centerlines of central airways were segmented using custom-written software (PASS, Univ. of Iowa). Finite element models of the lung shape and airways (from trachea to approximately generation 6) were geometry-fitted to the imaging segmentations. Airways down to the level of the terminal bronchioles were generated using a volume-filling branching algorithm (35) that recursively branches toward the center of mass of sets of seed points that represent the distribution of pulmonary acini. The similar geometries of the airway and vascular trees have been hypothesized to play in a role in passive V̇/Q̇ matching (16). To test this hypothesis, an almost exact matching of the vascular trees to the airway model geometry was adopted to ensure a “best case” scenario that represented the maximum theoretical contribution of structure to V̇/Q̇ for trees with normal geometry. That is, for the purposes of this study the pulmonary arterial and venous trees were assumed to be exact replicas of the airway tree except for the primary feeding artery/vein. The trachea geometry was bent to a near 90 degree angle to represent the orientation of the pulmonary artery trunk, and the same geometry was adopted for the largest veins, as the predicted perfusion distribution in this one-dimensional (1D) network model is largely unaffected by central arterial/venous structure. The pulmonary veins were connected to the arteries at the terminal vessels through a ladder-like model for the pulmonary microcirculation. Measurements from segmented CT for the subject were used to initialize diameters of the upper airway, arterial and venous trunk. Diameters of the lower order branches were calculated using Horsfield diameter ratios (RDH) weighted against the respective ratio of child to parent branch diameter for the tree type (airway, artery, or vein), such that the average diameter characteristics for each tree structure were consistent with data from morphometric studies (35). The values for RDH were 1.14, 1.54, and 1.55 for airways, arteries, and veins, respectively.
Tissue mechanics.
The airway and vessel trees were embedded in a deformable tissue model (36) that had regular (straight sided) shape, to represent the deformation of the tissue under gravity loading while avoiding the contribution of curvilinear lung geometry to tissue deformation. Tissue deformation was simulated for zero gravity (uniform expansion from a reference state) and normal gravity in the supine posture. Airways, acini, and blood vessels were assumed to displace with the tissue.
Ventilation.
The ventilation model of Swan et al. (33) was used to predict ventilation distribution to each acinus in the model. Acinar volumes and compliances were initialized at FRC using the tissue mechanics model.
Perfusion.
The pulmonary perfusion model of Clark et al. (6) was used to predict the time-averaged distribution of blood. Regional elastic recoil pressures (Pe) that were used as input to the perfusion model were estimated from the tissue mechanics model. Arterial and venous diameter in the model was proportional to transmural pressure, Ptm, where Ptm is the sum of blood pressure (Pb, internal) and Pe (external). A larger Ptm therefore translates to a larger arterial or venous diameter. For the microcirculatory model, Pe is assumed to be proportional to the size of the alveoli. Larger Pe implies greater stretch of the alveolar wall, and therefore reduction in thickness of the capillary sheet. A large local Pe therefore reduces large vessel resistance (when considering two vessels with equal Pb) but increases capillary resistance.
O2 transfer.
Kapitan and Hempleman’s steady-state gas transfer model (19) was used to estimate the effect of variation in regional V̇/Q̇ on alveolar Po2 () and arterial Po2 (). The model used acinar V̇ and Q̇ from the ventilation and perfusion models, respectively, as input to calculate acinus partial pressures. An acinus is defined as the unit of gas exchange in the model and is assumed to be a well-mixed unit represented by a lumped parameter model. Therefore, any intra-acinar heterogeneity in V and Q variance is neglected here. Following the approach of Kapitan and Hempleman, was calculated as the ventilation-weighted sum of the acinar alveolar partial pressures (which indicates the expired alveolar partial pressure rather than the average of the partial pressures within the acini); was calculated from the flow-weighted sum of acinar blood oxygen contents. Anatomical shunt was not included in the model.
Simulation Protocol
To separate the effects of lung structure from gravity on overall V̇/Q̇ matching, five sets of simulations were conducted. These are described below and summarized in Table 1. Simulation parameters are listed in Table 2. Each mechanism that is proposed to contribute to V̇ and Q̇ matching was turned “off” and “on” in each simulation, and hence their relative effects were quantified. The tree structures contribute to models M1–M4 in the list below. The five simulation cases were as follows.
Table 1.
Mechanisms included in each of the five models, for comparison of ventilation and perfusion distributions
| Deformation (Slinky effect) | Gravity (Weight of Blood and Pe Gradient) | Structure (Tree Resistance) | |
|---|---|---|---|
| Model 1 (full model) | Included | Included | Included |
| Model 2 (no deformation) | Not included | Included | Included |
| Model 3 (deformation only) | Included | Not included | Included |
| Model 4 (zero gravity) | Not included | Not included | Included |
| Model 5 (uniform) | Not included | Not included | Not included |
Table 2.
Simulation parameters used by the model components
| Simulation Parameters | Values | |
|---|---|---|
| Tissue Mechanics | Reference to FRC volume ratio | 0.5 |
| Ventilation | Breath duration | 5.0 s |
| Tidal volume | 0.5 liters | |
| Chest wall compliance | 0.2 l/cmH2O | |
| Perfusion | Venous pressure | 666 Pa |
| O2 Transfer | Mixed venous Po2 | 40 mmHg |
All parameters were the same throughout the five model scenarios.
1) Full model (normal V̇ Q̇) (M1).
V̇ and Q̇ distributions were simulated for the supine lung at FRC in 1G (with gravity), to obtain baseline values of V̇, Q̇, and pulmonary O2 transfer.
2) No tissue deformation (M2).
Displacement of lung tissue due to gravity was neglected, while all other gravitational effects were retained. A linear increase in acinar compliance was imposed in the anterior-to-posterior direction for V̇ simulation, and the effect of hydrostatic pressure (weight of blood in arteries and veins, and “zonal flow” for capillary blood) in response to gravity was included in the Q̇ simulation.
3) Deformation only (M3).
Hydrostatic pressure effects via the weight of blood, and variation in acinar compliance due to the tissue deformation was neglected. The model included only the physical movement of lung tissue and embedded structures (airways, vessels) due to gravitational displacement (the “Slinky” effect), such that there was a gravitational variance in tissue density.
4) Zero gravity (M4).
This model was the full geometric model without tissue deformation, and no other gravitational mechanisms. The model was solved in 0G (zero gravity). Acinar compliance was assumed to be uniform throughout the model, and blood was effectively weightless.
5) Uniform distribution (M5).
The contribution of the geometric structure of the airway and blood vessels and gravity were neglected, such that all acini were assumed to have the same properties as each other and each acinus received the same amount of ventilation and perfusion.
All simulations were conducted for the lung supine with FRC of 3.6 liters (conducting airway volume of 150 ml), and breath duration of 5 s with inspiration:expiration ratio of 1. In each simulation, the cardiac output and total alveolar ventilation were set at 5 l/min for a total lung V̇/Q̇ of 1 (excluding dead space).
Eliminating the Contribution of Shared Structure
To further analyze the contribution of shared (airway and arterial) structure to V̇/Q̇ matching, the contribution of shared structure was eliminated by randomly redistributing the acinar ventilations that were predicted by the full model, while retaining the gravitational V̇ gradient. To do this, the lung was split into 10 isogravitational sections, each containing ~3,000 acini. Acinar V̇ values for each section were randomly distributed among the acini in the section. Acinar Q̇ were fixed at the baseline values. The process is shown schematically in Fig. 1. To ensure that reported results were not biased due to sampling, the random assignment of V̇ was repeated 300 times.
Fig. 1.

Schematic to illustrate the redistribution of ventilation within an isogravitational section to eliminate the effect of matched airway and arterial structure. Left pane: acinar ventilation (V̇) and perfusion (Q̇) from the baseline model e.g., V̇1/Q̇1. Right pane: acinar ventilations are randomly assigned to other acini within the isogravitational section (e.g., V̇1 assigned to Q̇5) to give a different V̇/Q̇ ratio for each acinus.
Statistical Analysis
To enable comparison with published imaging studies, we employed similar post-processing methods as Clark et al. (6) to perform per-voxel and per-acinus analysis of the simulation results. In the per-voxel analysis the lung was partitioned into 1 cm3 regions of interest (ROIs) and the flow (either V̇ or Q̇) was summed within the cube and presented as a flow per unit tissue. Reporting in flow per unit tissue is more suitable than “per acinus” for comparison with voxel-based imaging measurements such as MRI, SPECT, and microspheres. Per-acinus values of V̇ and Q̇ (and acinar gas partial pressures) were the direct output of the model. These values are more useful for quantifying the relative contribution of hypothesized mechanisms to V̇, Q̇, and V̇/Q̇ distributions, since physiologically relevant matching of V̇ and Q̇ is at the acinar level.
For both types of analysis, V̇, Q̇, and V̇/Q̇ (obtained as V̇ divided by Q̇ in each ROI in the per-voxel analysis) gradients were calculated using linear regression analysis, with flow in each ROI (voxel or acinus) regressed against gravitational height. Mean flow was calculated as the sum of flow through all ROIs divided by total number of ROIs and was used to normalize the flows.
Heterogeneity of V̇, Q̇, and V̇/Q̇ was quantified using variance of log transformed distributions (, where i = V̇, Q̇, or V̇/Q̇). Wilson and Beck (39) quantified the relationship between V̇ and Q̇ distributions and V̇/Q̇ inhomogeneity using the variances in V̇, Q̇, and V̇/Q̇ (, , and respectively) calculated on a log scale, as follows:
| (1) |
where is the coefficient of correlation between V̇ and Q̇ on a log scale. and are the standard deviations of V̇ and Q̇, also calculated on the log domain. Reporting of variance of log transformed distributions facilitates quantification of the contribution of individual mechanisms to variances in V̇, Q̇, and V̇/Q̇ distributions.
RESULTS
Baseline Results from the Full Model
The acinar V̇ and Q̇ gradients predicted using the full model (supine, 1G) were 1.1% per cm and 6.5% per cm, respectively, and −6.8% per cm for the resulting V̇/Q̇ gradient. Analyzing at the 1 cm3 voxel level increased the gradients (1.48% per cm for V̇, 6.89% per cm for Q̇) and the variance ( = 0.07, = 0.16) for both V̇ and Q̇ distributions. Interestingly, the voxel-level V̇/Q̇ gradient remained largely the same (−6.7% per cm), whereas voxel variance decreased compared with acinar V̇/Q̇ variance. These values compare well with values from experiments performed at FRC in human subjects of 1.4–3.7% per cm and 3.5–11% per cm for V̇ and Q̇, respectively (23, 24, 31), and for the resulting V̇/Q̇ gradient (11, 14, 24, 25). The acinar V̇/Q̇ distribution in a transverse section through the full model is shown in Fig. 2A, where a clear gravitational gradient is apparent. Highest V̇/Q̇ is predicted in the anterior (nondependent) region, and considerable isogravitational heterogeneity is visually apparent.
Fig. 2.
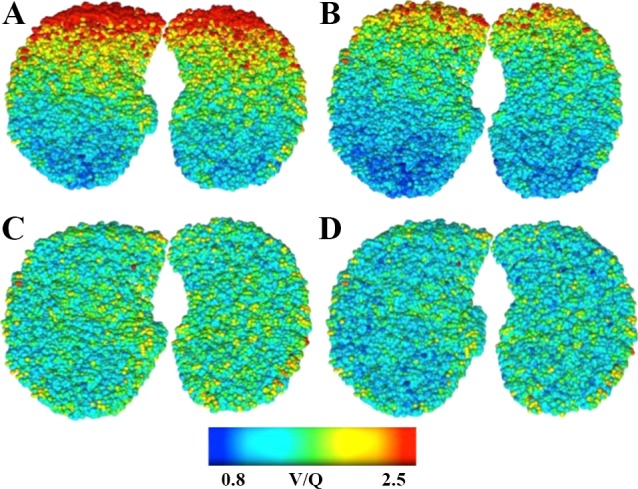
Visualization of acinar ventilation/perfusion distribution in a transverse section through a lung model for a subject lying supine. Results are shown for the full model, (A), the model with no tissue deformation (B), the model with only tissue deformation (C), and the model with zero gravity (D). In the full model a clear gradient in V̇/Q̇ can be seen in the direction of gravity, as well as considerable isogravitational heterogeneity. The gravitational gradient is reduced or zero in the other model simulation results.
Figure 3A shows a scattergram of normalized voxel V̇ and Q̇ for the full model. This figure is comparable to the analysis of microsphere data presented for healthy pigs (1), where the goodness of V̇/Q̇ matching was evaluated by plotting V̇ against Q̇ in 2 cm3 blocks of tissue. Data that fell along the line of isopleth (x = y) was assumed to indicate excellent matching. The model data in the current study generally lie along the V̇-Q̇ isopleth of 1.0, but with considerable variation above and below this line.
Fig. 3.

Scattergrams of normalized ventilation against perfusion (left) and associated frequency distributions of perfusion (middle) and ventilation (right) for a model of a supine lung, with analysis in 1 cm3 voxels. Results shown for full model at baseline (A), no tissue deformation (B), deformation only (C), zero gravity (D), and uniform distribution (E).
The oxygen transfer model predicted alveolar-arterial oxygen partial pressure difference [] associated with these V̇ and Q̇ distributions of 5.9 mmHg. The predicted is within the expected normal range of 8.3 mmHg (6.2 1SD) for healthy young adults between 21 to 30 yr old (20),but is toward the lower end as anatomical shunt was not included in the O2 transfer model.
Gradients, Heterogeneity, and Gas Exchange in Alternate Models
Gradients (in V̇, Q̇, and V̇/Q̇) and variances for each of the four alternate models (i.e., no tissue deformation but all gravitational effects and structure; only tissue deformation without gravitational effects but structure; zero gravity with structure; no displacement or gravity and uniform structure) are presented in Table 3. The visualizations of acinar V̇/Q̇ in transverse sections of the alternate models in Fig. 2, B–D correspond to the data in Table 3. In terms of gradients at the acinar level, for the model with no tissue deformation (i.e., with linear gradient in tissue compliance, and weight of blood in vessels) the gradients in V̇ and Q̇ were 73% and 61% of baseline, respectively. Reintroducing the tissue deformation but eliminating the gradient in tissue compliance essentially eliminated the V̇ gradient; however, the Q̇ gradient persisted at 26% of baseline. For zero gravity model simulation, both of the gravitational gradients were eliminated. The variance of V̇ was similar to baseline when only tissue deformation was removed, but decreased to ~20% of baseline when only tissue deformation or structures were included in the models. Results for Q̇ were similar: removing tissue deformation resulted in a modest reduction of the COV; whereas the other two alternate models resulted in an approximate halving of the COV compared with baseline. Analyzing in 1 cm3 voxels slightly increased both the calculated variance and the gradients in V̇ and Q̇ for all simulation cases, but correspondingly decreased the total fraction of heterogeneity in both distributions that can be explained by the gravitational gradient (indicated by the R2). The change in variances and the distribution of these variances in V̇ and Q̇ for the four alternate models compared with the full model are shown as histograms in Fig. 3, following the approach of Ref. 21.
Table 3.
The contributions of tissue deformation and structure to V̇, Q̇, and V̇/Q̇ in “leave-one-or-several-out” models in comparison to a full baseline model of function in a supine lung
| V̇ |
Q̇ |
V̇/Q̇ |
||||||||
|---|---|---|---|---|---|---|---|---|---|---|
| GV | R2V | GQ | R2Q | GV/Q | R2V/Q | ρ (V̇, Q̇) | ||||
| Full model (M1) | ||||||||||
| Voxel | 1.48 | 0.04 | 0.072 | 6.89 | 0.391 | 0.161 | −6.65 | 0.748 | 0.054 | 0.72 |
| Acinus | 1.05 | 0.464 | 0.005 | 6.55 | 0.470 | 0.116 | −6.75 | 0.391 | 0.088 | 0.52 |
| No tissue deformation (M2) | ||||||||||
| Voxel | 0.864 | 0.014 | 0.070 | 6.17 | 0.416 | 0.156 | −5.76 | 0.827 | 0.065 | 0.62 |
| Acinus | 0.820 | 0.599 | 0.004 | 6.15 | 0.519 | 0.114 | −5.79 | 0.480 | 0.097 | 0.50 |
| Deformation only (M3) | ||||||||||
| Voxel | 0.313 | 0.001 | 0.068 | 0.360 | 0.002 | 0.086 | −0.275 | 0.013 | 0.007 | 0.98 |
| Acinus | 0.265 | 0.148 | 0.002 | 0.138 | 0.005 | 0.044 | −0.285 | 0.002 | 0.045 | 0.05 |
| Zero gravity (M4) | ||||||||||
| Voxel | 0.317 | 0.002 | 0.068 | 0.328 | 0.002 | 0.086 | −0.408 | 0.02 | 0.004 | 0.99 |
| Acinus | 0.265 | 0.148 | 0.002 | 0.136 | 0.005 | 0.044 | −0.431 | 0.004 | 0.045 | 0.04 |
| Uniform distribution (M5) | ||||||||||
| Voxel | 0.440 | 0.004 | 0.068 | 0.440 | 0.004 | 0.068 | 0 | 0.004 | 0 | 1 |
| Acinus | 0 | 1 | 0 | 0 | 1 | 0 | 0 | 1 | 0 | 1 |
Results are shown for the gradients (Gi, where i = , V̇, Q̇, or V̇/Q̇) calculated as % per cm, with R2i indicating the proportion of variance explained by the vertical gradient. Dispersion is shown as the variance of the log-transformed data (), and ρ is the correlation between log transformed V̇ and Q̇ calculated from Eq 1.
The correlation between V̇ and Q̇ (ρ) was least for the baseline model and the model with no tissue deformation; ρ was almost 1 (indicating perfect correlation) when the only mechanisms for V̇/Q̇ matching were deformation or matched structure. This correlation is also represented visually in Fig. 3 (column 1).
Predictions of for each of the four model simulations are shown in Table 4. The model with only deformation and model with matched structure gave the two lowest predictions of . The excellent gas exchange values predicted are in line with both the reduced COV for V̇ and Q̇ distributions and the tighter correlations between V̇ and Q̇ reported in Table 3. Inclusion of gravitational forces into model simulations increased model-predicted .
Table 4.
Alveolar and arterial oxygen partial pressures calculated using a steady-state oxygen transfer model
| , mmHg | , mmHg | , mmHg | |
|---|---|---|---|
| Full model | 92.5 | 86.6 | 5.9 |
| No tissue deformation | 92.8 | 86.5 | 6.3 |
| Deformation only | 93.2 | 91.6 | 1.5 |
| Structure only (0G) | 93.1 | 92.2 | 0.9 |
Eliminating Structure
For 300 randomized reassignments of acinar V̇, the overall V̇ and Q̇ remained well correlated with a value of 0.49 (SD ± 0.023); that is, only a minor decrease in overall correlation compared with the baseline simulation value of 0.52. The average correlation between acinar V̇ and Q̇ for each isogravitational section is shown in Fig. 4A. For the baseline (full model) condition, correlation within the sections ranged between 0.04 and 0.12. After the randomized acinar V̇ assignment to units, the correlation for each section decreased to between 0.02 and 0.03. This poorer correlation was accompanied by a slight increase in overall variance of V̇/Q̇ by 1.6% compared with the baseline value. A scatterplot of baseline acinar V̇/Q̇ plotted against its corresponding new V̇/Q̇ for one representative case of randomized V assignment is shown in Fig. 4B. V̇/Q̇ generally falls along the isopleth (x = y), with scattered deviations giving the slight increase in variance. After the randomized V̇ assignments, the decreased very slightly by an average of 0.23 mmHg (one sample t-test, P < 0.0001) compared with the baseline condition.
Fig. 4.

A: comparison of per-slice correlation between normalized ventilation and perfusion in the direction of gravity for the full model, with an isogravitationally nonmatching structure. The model with acinar V̇ and Q̇ distributions that were dependent on matching airway and arterial structures resulted in greater correlation of V̇ and Q̇ (per section) than when V̇ was randomly redistributed within sections. B: acinar V̇/Q̇ distribution for the baseline model comparing with a representative case of new V̇/Q̇ from redistributed V̇.
DISCUSSION
Building on previously published models, the current study presents a modeling framework that allows for the prediction of regional V̇/Q̇ distributions and O2 transfer. To the best of our knowledge, this is the first modeling study that predicts complete spatial mapping of acinar V̇/Q̇, including a coupling to lung tissue mechanics. Model estimation of O2 transfer links the contribution of V̇ and Q̇ distributions and various hypothesized mechanisms to gas exchange efficiency. Moreover, we used a “leave-one-or-several-out” approach to understand how various gravitational and nongravitational mechanisms contribute to V̇/Q̇ matching in the normal supine human lung. The current analysis of the contributions of gravity and branching structure supports previous experimental findings that the gravitational gradient is the predominant mechanism that determines V̇ to Q̇ matching in healthy lungs under normal gravitational loading. The matched structures of the airway and arterial vessels is shown to also contribute to V̇/Q̇ matching; however, in the relatively large adult human lung this is a minor effect in comparison to the effects of gravity.
Physiological Consistency of the Model
Individual components of this multiscale model have been validated in previous studies, for different subjects in various postures (6, 33, 36). Simulations of V̇ and Q̇ distributions compare well against the literature, although a wide range of published V̇ and Q̇ gradients and variances are found due to intersubject variability (e.g., of subject height, age, total ventilation, and cardiac output), experimental methods (posture, level of lung inflation, imaging, or microsphere), and analysis techniques (such as density normalization, image resolution, edge or large vessel exclusion). The relative contribution of each factor (given in Table 3) to baseline gradients and variance is consistent with values given in Swan et al. (33) for V̇ and Clark et al. (6) for Q̇.
Both the gradient and the variance for V̇ and Q̇ distributions in the baseline model were increased when using per-voxel analysis compared with per-acinus results (Table 3). Image resolution is known to affect these scale-dependent measures. One reason is due to an uneven number of acini distributed within voxels which introduces additional heterogeneity on top of the actual underlying distribution. Analysis at acinus and 1 cm3 voxel resolution in the model with uniform distributions of V̇ and Q̇ (M5) showed that voxel sampling gave a 0.067 increase in variance, and a gradient of −0.44%/cm (Table 3); both of these are artifacts of the voxel sampling. The commonality of the source of this additional heterogeneity enhances the correlation between per-voxel V̇ and Q̇ distributions in the full model. Although individual V̇ and Q̇ variances increased in the per-voxel analysis, the elevated correlation resulted in a reduction in V̇/Q̇ variance compared with the more physiologically relevant per-acinus estimate.
The correlation coefficient for acinar V̇ and Q̇ at baseline is 0.52, and 0.72 at 1 cm3 voxel resolution. This estimated ρ is slightly lower than microsphere estimates obtained from pigs (ρ = 0.72 ± 0.049, 2 cm3 resolution) (1) and in awake goats (ρ = 0.63–0.87, 1.5 cm3 resolution) (21). However, we do not expect the model results to be directly comparable with these animal data as the model does not represent the analysis methods of a microsphere experiment, there might be important species differences, and the model neglects some mechanisms that would increase V̇ heterogeneity (see Study Limitations). Calculated per-voxel ρ is within the range of estimates from expired gas measurements in resting and exercising humans 0.76 ± 0.08 (3), although the exact resolution was not clear in this experimental study.
Gravitational Influences on Ventilation-Perfusion Matching
The matching structure of airways and blood vessels means that the tissue surrounding them and the tissue that they supply experiences a common gravitational influence; this is expressed in the model through a gravitationally dependent acinar compliance distribution (acting on V̇) and hydrostatic effects (acting on Q̇). Thus, despite the large increase in the variances of V̇ and Q̇ with the introduction of a gravitational gradient (92% of baseline V̇, and 89% of baseline Q̇), the common topographical gradient (73% of baseline V̇ gradient, and 61% of baseline Q̇ gradient) of the two distributions means areas of high V̇ (via more compliant acinar units at gravitationally dependent region) are associated with high Q̇ (via higher transpulmonary pressure and lower capillary resistance). The more dense blood experiences compound gravitational effects, of tissue deformation and the hydrostatic pressure gradient, and therefore Q̇ has a larger-magnitude gravitational gradient (−7.8%/cm) than V̇ (−1.1%/cm), which only experiences tissue deformation (26). Since the gradients are able to explain a significant proportion of the variance in acinar V̇ and Q̇ (R2 = 0.464 for V̇ and R2 = 0.470 for Q̇), this shared gravitational gradient provides a considerable degree of matching between the two distributions, to reduce the influence of gravity-induced variation in V̇ and Q̇ on the resulting acinar V̇/Q̇ variance. This finding is consistent with that of Prisk (27), who reasoned that gravity imposes common effects on both ventilation and perfusion, serving to maintain high gas exchange efficiency.
Gravity-induced tissue deformation also results in a tissue density gradient, with more acini per unit volume (per voxel) on average in the gravitationally dependent tissue. The effect of gravity-induced tissue deformation was assessed in M3 (Table 3). There is a slight increase in the V̇ and Q̇ gradient and variance at the per-voxel level compared with the zero gravity (0G) case (M4), which represents contribution to a systematic sampling artifact in the observed per-voxel measurements that is not present in the actual acinar distributions. This is consistent with the effect of lung density on perfusion measurements from Hopkins et al. (17).
Comparison of the 0G Model with the Lung in Microgravity
Zero gravity (0G) was simulated by assuming uniform acinar volume and weightless blood. This is comparable to the lung under microgravity (μG). Simulation parameters were set the same as at baseline, which was justified by recordings in μG that found no significant difference in FRC or respiratory drive, and constant alveolar ventilation between μG and 1G (7).
No direct measurement of V̇, Q̇, or V̇/Q̇ ratio is available for humans under μG conditions [however, these data are available for pig (13)]; qualitative comparisons between 1G and μG are drawn from indirect measures such as N2 and CO2 single- and multiple-breath washouts. As expected, removal of gravity from the model completely abolished both V̇ and Q̇ gradients. This is consistent with the observation of a lack of terminal fall in the CO2 expirogram (which is a marker for a topographical gradient) in μG (29, 30). There was a corresponding decrease in acinar variance of both V̇ and Q̇, although the heterogeneity for Q̇ remained much larger than V̇ because upstream resistance (due to anatomical branching) plays a more important role in determining Q̇ (6) for the more viscous blood than for air.
The reductions in gradient and variance in 0G suggest that V̇ and Q̇ are more uniformly distributed within the lung in this case compared with the cases that included gravity. The matched geometries of the airways and vasculature provide correlation in the distributions of airway and vascular resistances that are the predominant contributors to V̇ and Q̇ variance under the assumption of uniform tissue compliance (for V̇) and hydrostatic pressure (for Q̇) for the 0G simulation. This, taken together with the more uniform distribution of individual V̇ and Q̇ distributions, greatly reduced the resulting V̇/Q̇ variance in 0G, and is reflected in the very small prediction seen in Table 4.
The Combined Effect of Gravity and Structure
If the matched airway and arterial trees were assumed to be open-ended conduits (no downstream resistance or compliance), then the distributions of V̇ and Q̇ would be far more similar than for the 0G model. That is, adopting conditions for zero gravity does not reduce the model to “structure only” because V̇ is still dominated by acinus compliance, and arterial Q̇ is strongly influenced by downstream resistances. Therefore, to probe the contribution of matched structure to the V̇ and Q̇ distributions, we used a reassignment of acinar V̇ within isogravitational planes in the model, to disrupt the effect of geometric matching structure (which manifests through the acini’s proportional upstream airway and vessel resistance). The model predicted lower correlation between V̇ and Q̇ at all isogravitational planes as a result of this (Fig. 4A). This observation of lowering V̇ and Q̇ correlation following V̇ reassignment supports the hypothesis of Glenny et al. that the anatomically matched structure of airway and blood vessels is a mechanism that can contribute to matching of regional V̇ and Q̇ (9), since any deviation from the “ideal” matched structure (which we simulated in 300 different combinations) resulted in a decrease in correlation of V̇ and Q̇ within isogravitational planes, and resulted in a slight widening of the V̇/Q̇ ratio as shown by the increase in variance. This is presumably due the fractal characteristics of V̇ (1) and Q̇ (15), where asymmetric flow as a result of branch asymmetry (1) is no longer mirrored due to the disruption of local mirroring of the airway and vessel tree. However, overall V̇ and Q̇ correlation for the whole lung only suffered a minor reduction and can still be regarded as well-matched with a correlation value of 0.49 compared with the baseline case.
In the normal lung, the innate vascular geometry is the largest contributor to Q̇ heterogeneity. The effect of gravity through the “Slinky” effect and the heterogeneous transmission of hydrostatic pressure, while adding more heterogeneity, also imposes some order to V̇ and Q̇ in the form of a gravitational gradient. During normal breathing, V̇ distribution is known to be dominated by tissue compliance (22), which is influenced by the gravitationally induced transmission of pleural pressure that affects local tissue expansion (36). A recent modeling study of ventilation distribution in a healthy lung showed that in the presence of nonuniform acinar compliance, V̇ was well correlated with acinar compliance but not airway resistance (33). Thus, in the presence of a common gravitational gradient, airway resistance plays a relatively minor role in determining V̇ distribution. This relationship may change in disease, especially for obstructive diseases such as asthma, where peripheral airway resistance is shown to contribute significantly to local ventilation distribution (40) and in turn alter its contribution to V̇/Q̇ variance. However, for normal breathing in healthy subjects that is of interest here, the effect of the disruption of local matching in airway and vascular geometry on V̇/Q̇ heterogeneity is relatively minor in comparison to the contribution provided through the common driver for the V̇ and Q̇ gradients. This can be put in terms of the Wilson and Beck equation (Eq. 1) which relates dispersion in V̇ and Q̇ to that of V̇/Q̇. While acinar and are constant, the slight reduction in ρ only resulted in a slight widening of , which can be considered a global index of gas exchange efficiency. This is reflected in the very slight decrease in steady-state predicted by the O2 transfer model compared with baseline: gas exchange efficiency is maintained, and implies a robust construction of the lungs with a built-in safety factor, such that small-scale disruption does not result in great reduction in gas exchange efficiency.
One footnote to this, however, is that the model has lower V̇ heterogeneity () than some reported experimental measures. If an increase in toward experimentally measured values increases the correlation of V̇ with Q̇, then the impact of redistributing V̇ within isogravitational sections would be enhanced. That is, a greater contribution of matched structure and shared peripheral tissue compliance to V̇/Q̇ matching could be revealed.
The simulation cases considered in this study assumed that the lung was supine. This posture was chosen to allow comparison to supine imaging. The same model can be used to explore V̇/Q̇ matching in prone or upright, as has been done in previous studies (6, 34, 36). Change of posture simply requires a change in the gravity vector that is a component of the tissue mechanics and perfusion models, and change of lung volume associated with the change in posture.
Study Limitations
There are several assumptions made in this study that require examination. First, the current model neglects several sources of heterogeneity in tissue compliance: the curvilinear lung shape, relative displacement of the lung lobes, interaction with the heart, nonuniform chest wall expansion, and normal random variation in regional tissue properties. The impact of this is lower V̇ heterogeneity ( in Table 3) than Q̇ heterogeneity (), whereas measurements in pig and rat (1, 2, 10, 32) show nearly equal and . The estimated for the baseline case is lower than some experimental measures (21), but is within range of values reported by high resolution PET studies operating at a similar resolution (23, 37). Nonetheless, each of the neglected factors would contribute to the isogravitational heterogeneity in compliance that is lacking in the current model but which has been observed in several experimental studies using high-resolution methods (16). Increasing tissue compliance heterogeneity would increase the model because of the strong dependence of regional V̇ on peripheral tissue elasticity. would also be expected to increase, but it is not clear whether its change in distribution would match the change in V̇ due to the counteracting influences of tissue expansion on extra-alveolar vessel resistance (reduces with tissue expansion) and alveolar vessel resistance (increases with tissue expansion). Further studies would therefore be required to understand whether introducing additional baseline tissue compliance heterogeneity would improve the correlation between V̇ and Q̇ for each of the model scenarios considered here.
Second, the vascular structures used to simulate perfusion distribution did not derive from MDCT images, but were assumed to be mirror images of the conducting airway tree. This approach is considered a reasonable assumption as morphometric studies have shown pulmonary vasculature to follow and branch in union with the airway tree until the respiratory bronchiole (18), below which we assumed a lumped parameter model. This assumption will only emphasize the contribution of a matching structure on V̇/Q̇ matching.
Third, the effect of V̇/Q̇ on gas exchange was estimated using an “O2 transfer model” rather than by solution of a system of gas transport equations. The transfer model subtracts the anatomical dead space from the tidal volume to calculate alveolar ventilation, but its assumption of steady state in each V̇/Q̇ unit neglects the mixing that occurs in the dead space that is proximal to different V̇/Q̇ units; hence this model might underestimate the effective “homogenization” of alveolar gas.
Fourth, conclusions drawn from this study are based on analysis from a single healthy young male and therefore include features specific to this subject such as the extent of tissue deformation. However, as the current study is focused on studying the trend in relative contribution of various mechanisms, the findings are expected to be population size invariant.
Conclusions
An integrated multiscale modeling framework including 3D anatomically based tree structure and physiological models of tissue deformation, ventilation, and perfusion was used in this study to investigate key contributors to efficient gas exchange in the normal lung. An advantage of this modeling approach lies in its ability to isolate the contribution from each factor systematically; here, a “leave-one-or-several-out” approach was used. A strength of the model is its ability to separate the influence of a single factor (e.g., airway or vessel resistance) from others (e.g., regional differences in compliance), which cannot be achieved in an in vivo experiment. For example, microsphere aerosol deposition studies cannot distinguish the relative importance of local compliance and airway diameter to V̇ distribution, whereas the model suggests airway diameter has a minor effect in the determination of regional V̇ between small lung units. The model predicts that the heterogeneities of V̇ and Q̇ during normal breathing under gravitational loading contribute to the heterogeneity in V̇/Q̇ due to the shared gravitationally induced pleural pressure gradient transmitted to the airway and pulmonary vasculature through the lung parenchyma. However, these effects impact on the passive V̇/Q̇ heterogeneity much less than predicted from the measured heterogeneities in V̇ and Q̇ because they are spatially correlated. The heterogeneity in V̇/Q̇ due to mismatched tree structures is minor, and only potentially important at the small scale (within an isogravitational slice). The current study focused on passive V̇/Q̇ matching mechanisms in normal adult lungs, where the relatively large size of the lung structure makes it susceptible to influence by gravitational forces. This passive V̇/Q̇ matching relationship may be different in children (when the lungs are not yet fully developed) (4) and small animals such as rats (10). Given the small size of their lungs, the relative effect of gravity in V̇/Q̇ heterogeneity may be reduced, leaving the innate structure of the lungs as the primary contribution to the low heterogeneity in V̇/Q̇ distribution in normal neonates and small animals.
GRANTS
This study was supported by funding from the Medical Technologies Centre of Research Excellence (M. H. Tawhai), the Rutherford Discovery Fellowship (14-UOA-19; A. R. Clark), and National Institutes of Health Bioengineering Research Partnership Grant RO1-HL-119263.
DISCLOSURES
No conflicts of interest, financial or otherwise, are declared by the authors.
AUTHOR CONTRIBUTIONS
W.K., A.R.C., and M.H.T. conceived and designed research; W.K. performed experiments; W.K., A.R.C., and M.H.T. analyzed data; W.K., A.R.C., and M.H.T. interpreted results of experiments; W.K. prepared figures; W.K. drafted manuscript; W.K., A.R.C., and M.H.T. edited and revised manuscript; W.K., A.R.C., and M.H.T. approved final version of manuscript.
Appendix
Additional details for each model component are provided below. All of these models have been published previously, and the reader should refer to the literature for more comprehensive information.
Lung Tissue Mechanics
The finite element continuum model proposed by Tawhai et al. (36) was used to predict lung tissue deformation under gravity loading. The lung was considered as a compressible, homogeneous, and isotropic material with relationship between stress and strain defined by a strain energy density function (W), where
| (A1) |
J1 and J2 are the first and second invariants of the Green-Lagrangian finite strain tensor and a, b, and ε are constants (a and b dimensionless, ε with units of pressure). To simulate the displacement of tissue with gravity and posture, the model was first uniformly expanded from an arbitrary zero stress state (here at volume of 50% FRC), and then gravity was added incrementally. In the original model of Tawhai et al. the deformable lung model was constrained to remain in contact with a rigid chest wall using geometric contact constraints. In the current study the tissue model has straight sides, so “contact” was enforced by setting displacement boundary conditions such that nodes on any tissue block surface must remain in plane.
Following simulation of uniform expansion for zero gravity, and full gravitational loading in the supine position for normal gravity, stress and strain were calculated at each vessel and acinus location. These distributions were used to estimate regional lung tissue (therefore acinus) volume at FRC, instantaneous tissue compliance, and elastic recoil pressure. Elastic recoil pressure (Pe) and compliance (C) were calculated as
| (A2) |
| (A3) |
where λ is isotropic stretch, V0 is undeformed volume and
The parameters a, b, and ε are as defined for Eq. A1. Pe was used as input to the perfusion model, specifically to the relationship between transmural pressure and vessel diameter. C was used as input to the ventilation model, to initialize the compliance of the acini at FRC. Equation A3 was also used to update acinus compliance at each time step during simulation of ventilation.
Airways, blood vessels, and acini were assumed to be “tethered” to the tissue, such that they moved with the tissue displacement.
Ventilation Model
Swan et al. (34) modeled ventilation distribution by coupling an airway flow model to compliant acini that were embedded within a tissue continuum (as described in the previous section). The flow model assumed Poiseuille flow with modification to the branch resistances to account for energy losses at the airway bifurcations, such that
| (A4) |
where the pressure difference between two points of an airway segment (, ) determines the volumetric flow rate of air through the segment. Rp is the Poiseuille resistance (Rp = ) multiplied by Zpe, the correction term for energy dissipation, calculated as:
| (A5) |
where Re is the Reynolds number (Re = ), r and l are radius and length of airway segment, and Kpe is constant at 1.51 × 10⁻⁶ g/m3. Conservation of flow at bifurcations was also assumed. Flow was coupled to tissue elasticity via an equation of motion for each terminal airway and elastic tissue unit, following
| (A6) |
Paw, Raw, and V̇ are pressure, resistance and flow of the terminal airway, respectively, and Pe is the local pressure acting to expand the acinus calculated from the tissue deformation model. Va is acinus volume, which is initialized at FRC using the tissue deformation model and updated at each time step following solution of the ventilation model.
Blood Flow Model
The multiscale model of Clark et al. (6) was used to simulate blood flow through the entire pulmonary circulation. In this model, flow through the extra-acinar pulmonary arteries and veins is modeled using a modified Poiseuille equation. For a vessel segment of length L and diameter D,
| (A7) |
where is the pressure drop along the segment, μ is the viscosity of blood, Q̇ is the volumetric blood flow rate in the segment, ρb is the density of blood, g is gravitational acceleration, and θ is the angle that the vessel makes with the direction of gravity. The extracapillary vessels are assumed compliant with the relationship
| (A8) |
where D and D0 are the strained and unstrained vessel diameter, respectively. Vessel compliance α is constant at 1.49×10⁻⁴ Pa/s, and Ptm is the transmural pressure which varies throughout the lung. Ptm is calculated as the sum of blood pressure, Pb, of the vessel segment and the local elastic recoil pressure, Pe, which is derived from the tissue mechanics model.
A “ladder-like” model for the intra-acinar microcirculation joins each terminal artery to a terminal vein. The model has 9 generations of supplying arterioles and draining venules, where each generation is connected by a recruitable and distensible capillary sheet to form the ladder-like structure. Flow through the arterioles and venules follows Poiseuille flow. Each section of capillary bed is represented by a lumped parameter sheet flow model following Fung and Sobin (8), such that
| (A9) |
where Q̇ is the volumetric flow rate through the capillary bed, SA is the surface area of the capillary sheet, f is a numerical friction factor, and lc is average path length between arteriole and venule. Capillary sheet thickness H is a function that depends on the interaction between blood and alveolar pressures, and local elastic recoil pressure, which modulates the compliance properties of the capillary sheet. Equation 2 from Ref. 6 provides additional detail for the estimation of H under different conditions.
O2 Transfer Model
Kapitan and Hempleman’s steady-state gas transfer model (19) was used to estimate the effect of regional V̇/Q̇ on O2 partial pressure, using breath averaged acinar V̇ and Q̇ calculated from the ventilation and perfusion models. at each acinus was defined by:
| (A10) |
where V̇i is the inspired ventilation (l/min), is the O2 partial pressure (mmHg) of the humidified inspired air, V̇a is the alveolar ventilation (l/min), is the O2 partial pressure (mmHg) of the alveolar air, is the O2 content of the end-capillary blood (ml gas/100 ml blood), is the O2 content of the mixed venous blood (ml gas/100 ml blood), and k is a constant that accounts for differences in temperature and pressure between body and the atmosphere. in each acinus is a function of end-capillary oxygen partial pressure , such that
| (A11) |
where is oxygen saturation calculated using the Monod-Wyman-Changeux (MWC) model. Capillary transit time was assumed to always be sufficient to allow O2 equilibration such that acinar and were equal. Thus lung was effectively the ventilation weighted sum of acinar .
REFERENCES
- 1.Altemeier WA, McKinney S, Glenny RW. Fractal nature of regional ventilation distribution. J Appl Physiol (1985) 88: 1551–1557, 2000. [DOI] [PubMed] [Google Scholar]
- 2.Altemeier WA, McKinney S, Krueger M, Glenny RW. Effect of posture on regional gas exchange in pigs. J Appl Physiol (1985) 97: 2104–2111, 2004. doi: 10.1152/japplphysiol.00072.2004. [DOI] [PubMed] [Google Scholar]
- 3.Beck KC, Johnson BD, Olson TP, Wilson TA. Ventilation-perfusion distribution in normal subjects. J Appl Physiol (1985) 113: 872–877, 2012. doi: 10.1152/japplphysiol.00163.2012. [DOI] [PMC free article] [PubMed] [Google Scholar]
- 4.Bhuyan U, Peters AM, Gordon I, Davies H, Helms P. Effects of posture on the distribution of pulmonary ventilation and perfusion in children and adults. Thorax 44: 480–484, 1989. doi: 10.1136/thx.44.6.480. [DOI] [PMC free article] [PubMed] [Google Scholar]
- 5.Burrowes KS, Hunter PJ, Tawhai MH. Anatomically based finite element models of the human pulmonary arterial and venous trees including supernumerary vessels. J Appl Physiol (1985) 99: 731–738, 2005. doi: 10.1152/japplphysiol.01033.2004. [DOI] [PubMed] [Google Scholar]
- 6.Clark AR, Tawhai MH, Hoffman EA, Burrowes KS. The interdependent contributions of gravitational and structural features to perfusion distribution in a multiscale model of the pulmonary circulation. J Appl Physiol (1985) 110: 943–955, 2011. doi: 10.1152/japplphysiol.00775.2010. [DOI] [PMC free article] [PubMed] [Google Scholar]
- 7.Elliott AR, Prisk GK, Guy HJ, West JB. Lung volumes during sustained microgravity on Spacelab SLS-1. J Appl Physiol (1985) 77: 2005–2014, 1994. [DOI] [PubMed] [Google Scholar]
- 8.Fung YC, Sobin SS. Theory of sheet flow in lung alveoli. J Appl Physiol 26: 472–488, 1969. [DOI] [PubMed] [Google Scholar]
- 9.Glenny RW. Emergence of matched airway and vascular trees from fractal rules. J Appl Physiol (1985) 110: 1119–1129, 2011. doi: 10.1152/japplphysiol.01293.2010. [DOI] [PubMed] [Google Scholar]
- 10.Glenny RW, Bauer C, Hofmanninger J, Lamm WJ, Krueger MA, Beichel RR. Heterogeneity and matching of ventilation and perfusion within anatomical lung units in rats. Respir Physiol Neurobiol 189: 594–606, 2013. doi: 10.1016/j.resp.2013.07.027. [DOI] [PMC free article] [PubMed] [Google Scholar]
- 11.Glenny RW, Bernard S, Robertson HT, Hlastala MP. Gravity is an important but secondary determinant of regional pulmonary blood flow in upright primates. J Appl Physiol (1985) 86: 623–632, 1999. [DOI] [PubMed] [Google Scholar]
- 12.Glenny RW, Bernard SL, Robertson HT. Pulmonary blood flow remains fractal down to the level of gas exchange. J Appl Physiol (1985) 89: 742–748, 2000. [DOI] [PubMed] [Google Scholar]
- 13.Glenny RW, Lamm WJ, Bernard SL, An D, Chornuk M, Pool SL, Wagner WW Jr, Hlastala MP, Robertson HT. Selected contribution: redistribution of pulmonary perfusion during weightlessness and increased gravity. J Appl Physiol (1985) 89: 1239–1248, 2000. [DOI] [PubMed] [Google Scholar]
- 14.Glenny RW, Robertson HT. Determinants of pulmonary blood flow distribution. Compr Physiol 1: 39–59, 2011. doi: 10.1002/cphy.c090002. [DOI] [PubMed] [Google Scholar]
- 15.Glenny RW, Robertson HT. Fractal properties of pulmonary blood flow: characterization of spatial heterogeneity. J Appl Physiol (1985) 69: 532–545, 1990. [DOI] [PubMed] [Google Scholar]
- 16.Glenny RW, Robertson HT. Spatial distribution of ventilation and perfusion: mechanisms and regulation. Compr Physiol 1: 375–395, 2011. doi: 10.1002/cphy.c100002. [DOI] [PubMed] [Google Scholar]
- 17.Hopkins SR, Henderson AC, Levin DL, Yamada K, Arai T, Buxton RB, Prisk GK. Vertical gradients in regional lung density and perfusion in the supine human lung: the Slinky effect. J Appl Physiol (1985) 103: 240–248, 2007. doi: 10.1152/japplphysiol.01289.2006. [DOI] [PMC free article] [PubMed] [Google Scholar]
- 18.Hsia CC, Hyde DM, Weibel ER. Lung structure and the intrinsic challenges of gas exchange. Compr Physiol 6: 827–895, 2016. doi: 10.1002/cphy.c150028. [DOI] [PMC free article] [PubMed] [Google Scholar]
- 19.Kapitan KS, Hempleman SC. Computer simulation of mammalian gas-exchange. Comput Biol Med 16: 91–101, 1986. doi: 10.1016/0010-4825(86)90034-X. [DOI] [PubMed] [Google Scholar]
- 20.Mellemgaard K. The alveolar-arterial oxygen difference: its size and components in normal man. Acta Physiol Scand 67: 10–20, 1966. doi: 10.1111/j.1748-1716.1966.tb03281.x. [DOI] [PubMed] [Google Scholar]
- 21.Melsom MN, Kramer-Johansen J, Flatebø T, Müller C, Nicolaysen G. Distribution of pulmonary ventilation and perfusion measured simultaneously in awake goats. Acta Physiol Scand 159: 199–208, 1997. doi: 10.1046/j.1365-201X.1997.92355000.x. [DOI] [PubMed] [Google Scholar]
- 22.Milic-Emili J, Henderson JA, Dolovich MB, Trop D, Kaneko K. Regional distribution of inspired gas in the lung. J Appl Physiol 21: 749–759, 1966. [DOI] [PubMed] [Google Scholar]
- 23.Musch G, Layfield JD, Harris RS, Melo MF, Winkler T, Callahan RJ, Fischman AJ, Venegas JG. Topographical distribution of pulmonary perfusion and ventilation, assessed by PET in supine and prone humans. J Appl Physiol (1985) 93: 1841–1851, 2002. doi: 10.1152/japplphysiol.00223.2002. [DOI] [PubMed] [Google Scholar]
- 24.Petersson J, Rohdin M, Sánchez-Crespo A, Nyrén S, Jacobsson H, Larsson SA, Lindahl SG, Linnarsson D, Neradilek B, Polissar NL, Glenny RW, Mure M. Posture primarily affects lung tissue distribution with minor effect on blood flow and ventilation. Respir Physiol Neurobiol 156: 293–303, 2007. doi: 10.1016/j.resp.2006.11.001. [DOI] [PubMed] [Google Scholar]
- 25.Petersson J, Rohdin M, Sánchez-Crespo A, Nyrén S, Jacobsson H, Larsson SA, Lindahl SG, Linnarsson D, Neradilek B, Polissar NL, Glenny RW, Mure M. Regional lung blood flow and ventilation in upright humans studied with quantitative SPECT. Respir Physiol Neurobiol 166: 54–60, 2009. doi: 10.1016/j.resp.2009.01.008. [DOI] [PubMed] [Google Scholar]
- 26.Prisk GK. The lung in space. Clin Chest Med 26: 415–438, 2005. doi: 10.1016/j.ccm.2005.05.008. [DOI] [PubMed] [Google Scholar]
- 27.Prisk GK. Microgravity and the respiratory system. Eur Respir J 43: 1459–1471, 2014. doi: 10.1183/09031936.00001414. [DOI] [PubMed] [Google Scholar]
- 28.Prisk GK, Elliott AR, Guy HJ, Kosonen JM, West JB. Pulmonary gas exchange and its determinants during sustained microgravity on Spacelabs SLS-1 and SLS-2. J Appl Physiol (1985) 79: 1290–1298, 1995. [DOI] [PubMed] [Google Scholar]
- 29.Prisk GK, Guy HJ, Elliott AR, Paiva M, West JB. Ventilatory inhomogeneity determined from multiple-breath washouts during sustained microgravity on Spacelab SLS-1. J Appl Physiol (1985) 78: 597–607, 1995. [DOI] [PubMed] [Google Scholar]
- 30.Prisk GK, Guy HJ, Elliott AR, West JB. Inhomogeneity of pulmonary perfusion during sustained microgravity on SLS-1. J Appl Physiol (1985) 76: 1730–1738, 1994. [DOI] [PubMed] [Google Scholar]
- 31.Prisk GK, Yamada K, Henderson AC, Arai TJ, Levin DL, Buxton RB, Hopkins SR. Pulmonary perfusion in the prone and supine postures in the normal human lung. J Appl Physiol (1985) 103: 883–894, 2007. doi: 10.1152/japplphysiol.00292.2007. [DOI] [PMC free article] [PubMed] [Google Scholar]
- 32.Robertson HT, Glenny RW, Stanford D, McInnes LM, Luchtel DL, Covert D. High-resolution maps of regional ventilation utilizing inhaled fluorescent microspheres. J Appl Physiol (1985) 82: 943–953, 1997. [DOI] [PubMed] [Google Scholar]
- 33.Swan AJ, Clark AR, Tawhai MH. A computational model of the topographic distribution of ventilation in healthy human lungs. J Theor Biol 300: 222–231, 2012. doi: 10.1016/j.jtbi.2012.01.042. [DOI] [PMC free article] [PubMed] [Google Scholar]
- 34.Swan AJ, Tawhai MH. Evidence for minimal oxygen heterogeneity in the healthy human pulmonary acinus. J Appl Physiol (1985) 110: 528–537, 2011. doi: 10.1152/japplphysiol.00888.2010. [DOI] [PMC free article] [PubMed] [Google Scholar]
- 35.Tawhai MH, Hunter P, Tschirren J, Reinhardt J, McLennan G, Hoffman EA. CT-based geometry analysis and finite element models of the human and ovine bronchial tree. J Appl Physiol (1985) 97: 2310–2321, 2004. doi: 10.1152/japplphysiol.00520.2004. [DOI] [PubMed] [Google Scholar]
- 36.Tawhai MH, Nash MP, Lin CL, Hoffman EA. Supine and prone differences in regional lung density and pleural pressure gradients in the human lung with constant shape. J Appl Physiol (1985) 107: 912–920, 2009. doi: 10.1152/japplphysiol.00324.2009. [DOI] [PMC free article] [PubMed] [Google Scholar]
- 37.Treppo S, Mijailovich SM, Venegas JG. Contributions of pulmonary perfusion and ventilation to heterogeneity in V̇a/Q̇ measured by PET. J Appl Physiol (1985) 82: 1163–1176, 1997. [DOI] [PubMed] [Google Scholar]
- 38.West JB. Regional differences in gas exchange in the lung of erect man. J Appl Physiol 17: 893–898, 1962. [DOI] [PubMed] [Google Scholar]
- 39.Wilson TA, Beck KC. Contributions of ventilation and perfusion inhomogeneities to the V̇a/Q̇ distribution. J Appl Physiol (1985) 72: 2298–2304, 1992. [DOI] [PubMed] [Google Scholar]
- 40.Wongviriyawong C, Harris RS, Greenblatt E, Winkler T, Venegas JG. Peripheral resistance: a link between global airflow obstruction and regional ventilation distribution. J Appl Physiol (1985) 114: 504–514, 2013. doi: 10.1152/japplphysiol.00273.2012. [DOI] [PMC free article] [PubMed] [Google Scholar]
