Abstract
Understanding how gene regulatory networks control the progressive restriction of cell fates is a long-standing challenge. Recent advances in measuring single cell gene expression are providing new insights into lineage commitment. However, the regulatory events underlying these changes remain elusive. Here we investigate the dynamics of chromatin regulatory landscapes during embryogenesis at single cell resolution. Using single cell combinatorial indexing assay for transposase accessible chromatin (sci-ATAC-seq)1, we profiled chromatin accessibility in over 20,000 single nuclei from fixed Drosophila embryos spanning three landmark embryonic stages: 2-4 hours (hrs) after egg laying (predominantly stage 5 blastoderm nuclei), when each embryo comprises ~6,000 multipotent cells; 6-8hrs (predominantly stage 10-11), to capture a midpoint in embryonic development when major lineages in the mesoderm and ectoderm are specified; and 10-12hrs (predominantly stage 13), when each of the embryo’s >20,000 cells are undergoing terminal differentiation. Our results reveal spatial heterogeneity in the usage of the regulatory genome prior to gastrulation, a feature that aligns with future cell fate, and nuclei can be temporally ordered along developmental trajectories. During mid-embryogenesis, tissue granularity emerges such that individual cell types can be inferred by their chromatin accessibility, while maintaining a signature of their germ layer of origin. The data reveal overlapping usage of regulatory elements between cells of the endoderm and non-myogenic mesoderm, suggesting a common developmental program reminiscent of the mesendoderm lineage in other species2–4. Altogether, we identify over 30,000 distal regulatory elements exhibiting tissue-specific accessibility. We validated the germ layer specificity of a subset of these predicted enhancers in transgenic embryos, achieving 90% accuracy. Overall, our results demonstrate the power of shotgun single cell profiling of embryos to resolve dynamic changes in the chromatin landscape during development, and to uncover the cis-regulatory programs of metazoan germ layers and cell types.
Keywords: single cell, ATAC-seq, open chromatin, embryonic development, regulatory landscape, cell fate decisions, single cell epigenetics, developmental enhancers
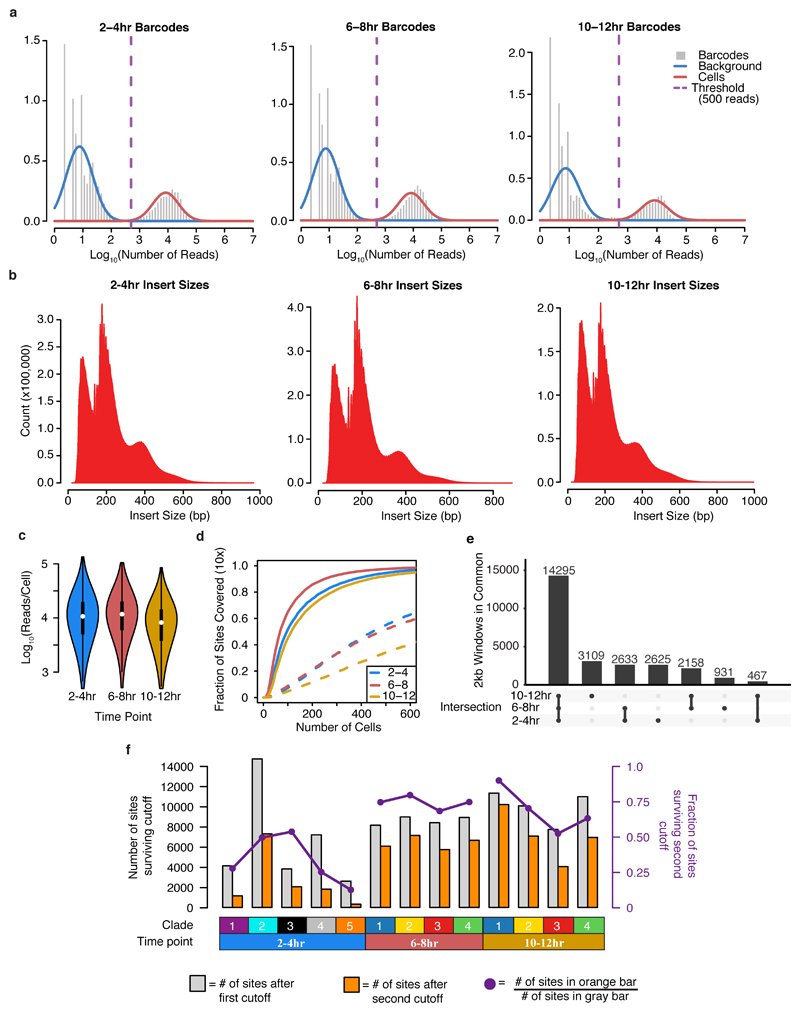
We adapted our sci-ATAC-seq protocol1 to work with nuclei from formaldehyde-fixed Drosophila embryos, concurrently implementing optimizations to increase sensitivity by roughly an order of magnitude. The nuclei processed from each time point were derived from hundreds of embryos of both sexes, and naturally sample intermediate developmental states. Of 431M sequenced read pairs, 70% mapped to the nuclear reference genome and were assigned a cell barcode (Extended Data Fig. 1a,b). Altogether, we recovered chromatin accessibility profiles for 23,085 cells across the three time points (mean 12,904 ± 10,979 (s.d.) reads per cell after de-duplication, minimum 500 unique reads per cell (Extended Fig. 1c)). Sequenced fragments exhibited nucleosomal banding and were strongly enriched in DNase hypersensitive sites (DHS) defined on bulk Drosophila embryos5 (Extended Data Fig. 1d).
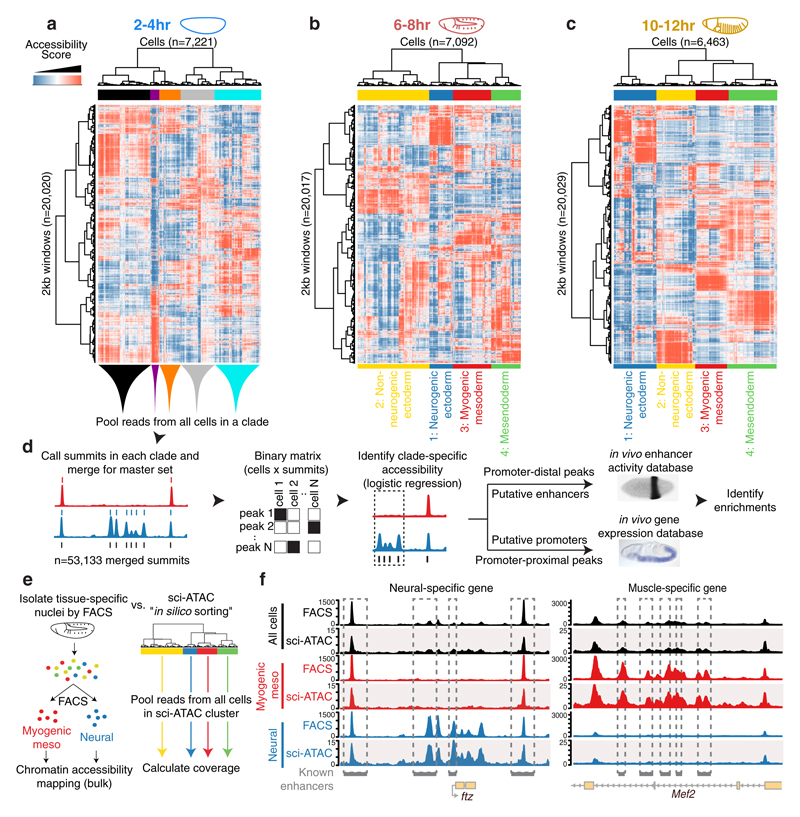
We partitioned the genome into 2 kilobase (kb) windows and scored each cell by whether any reads were observed in each window. For each time point, we performed latent semantic indexing1 (LSI) using the 20,000 most frequently accessible windows and discarding the sparsest 10% of cells. 14,295 of the 20,000 windows were common across all three time points (Extended Data Fig. 1e). Although accessibility measurements in individual cells are naturally sparse (as there are only 2-4 genome equivalents per nucleus), the data are sufficiently structured to reveal subsets of cells exhibiting similar chromatin accessibility (Fig. 1a-c). To map the underlying regulatory elements, we aggregated data from cells within each of the largest 4-5 clades per time point to call peaks and summits of accessibility for each ‘in silico sorted’ clade (Fig. 1d). Merging summits across all time points and clades identified 53,133 potential cis-regulatory elements. 40,967 of these have clade-specific accessibility in at least one time point (Table S1), including 12,605 at 2-4hrs, 25,615 at 6-8hrs, and 28,253 at 10-12hrs (Extended Data Fig. 1f). These results reveal the highly dynamic and heterogeneous nature of chromatin accessibility during embryogenesis, with roughly twice as many differentially accessible sites identified at the later time points.
Figure 1. Single cell profiling of chromatin accessibility across Drosophila embryogenesis.
a-c, Heatmaps of binarized, LSI-transformed, clustered read counts for single cells (columns) in 2 kb windows across the genome (rows) at 2-4hr (a), 4-6hr (b) and 10-12hr (c) after egg laying. Major clades are assignable to germ layers at post-gastrulation time points (b,c). d, Approach to annotate clades by intersecting clade-specific peaks of chromatin accessibility with enhancer activity and gene expression. In situ image of enhancer activity (black stain) from ref 7; RNA in situ (blue stain) from the Berkeley Drosophila Genome Project10,31,32. e, Comparing FACS-DNase-seq and sci-ATAC-seq “in silico sorting.” Nuclei from myogenic mesoderm and neurons were isolated from 6-8hr embryos using antibodies against tissue-specific regulatory proteins Mef2 (myogenic mesoderm) and Elav (neurons) followed by FACS and DNase-seq. In silico sorts from sci-ATAC-seq were built by pooling reads from all cells within each LSI-defined clade. f, Library-size normalized coverage tracks from FACS-DNase-seq (top in each color) and sci-ATAC-seq in silico sorts (bottom in each color) for whole embryo (black)), mesoderm (red)), and neuronal (blue) at 6-8hrs. Shown are ftz (neuronal; left) and Mef2 (mesodermal; right) loci. Known enhancers for each tissue are indicated.
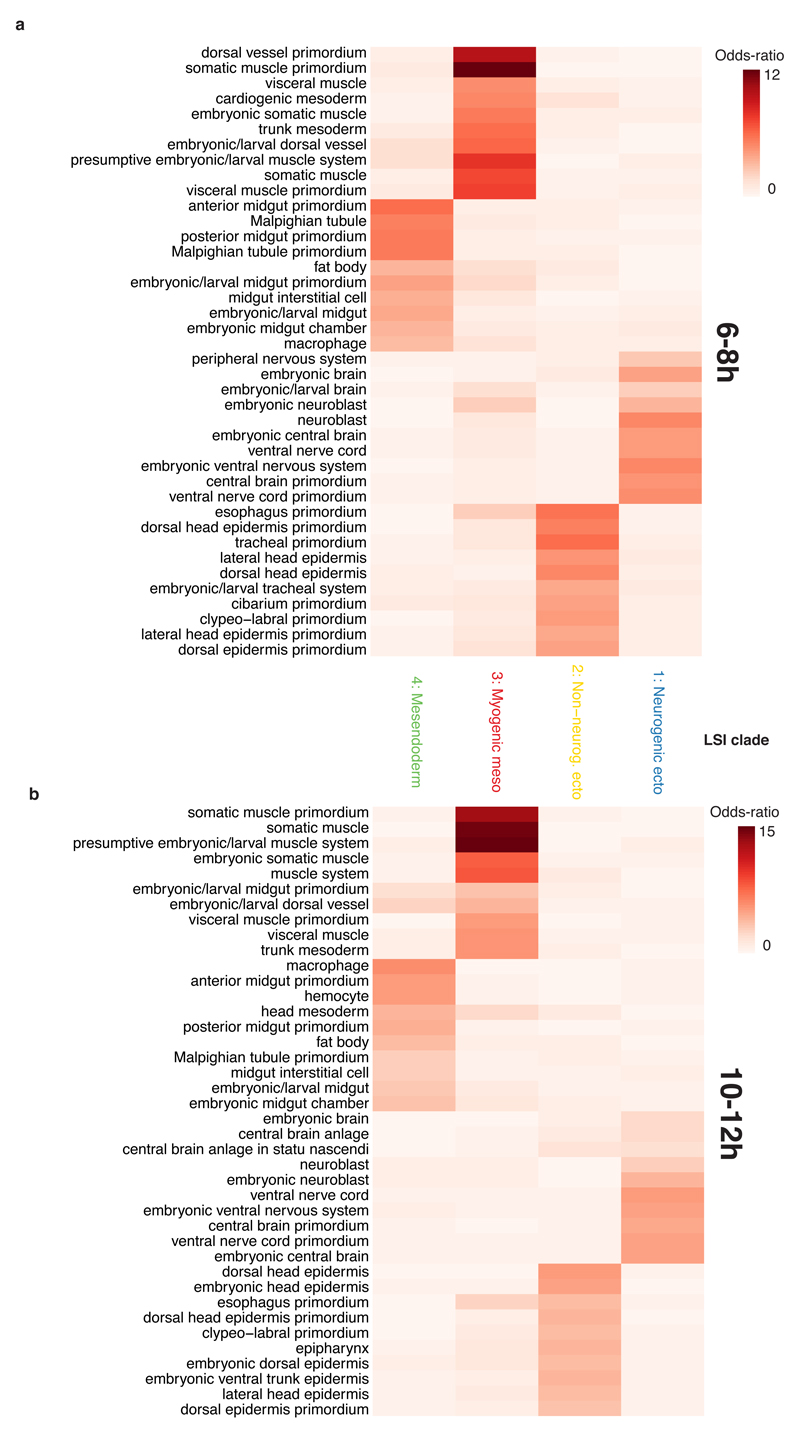
To determine the identity of each cell clade, we compared accessible regions to 3,841 developmental enhancers6–8 and 9,356 gene promoters9,10 with characterized tissue activity across embryogenesis. The enrichments of clade-specific promoter-distal (putative enhancers) and promoter-proximal (putative promoters) elements gave consistent results (Table S2): the four major clades at 6-8hrs and 10-12hrs correspond to the three major germ layers, with two subdivisions: ectoderm, which is split into neurogenic (clade 1) and non-neurogenic (clade 2) lineages, and mesoderm which is split into myogenic mesoderm (clade 3) and non-myogenic mesoderm (e.g. fat body and hemocytes) combined with endoderm (clade 4) (Extended Data Fig. 2, Table S2). The latter indicates that non-myogenic mesoderm and endoderm exhibit similar chromatin accessibility, suggesting a shared developmental program. Although a common origin is not known in Drosophila, this is highly reminiscent of the mesendoderm lineage in C. elegans2, sea urchins3, and vertebrates4. Of the 53,133 potential cis-regulatory elements, 35,963 are distal (putative enhancers); 12% overlap characterized developmental enhancers and 48% overlap putative enhancers from bulk DHS data5 (based on 1bp overlap). Conversely, of the 3,841 characterized developmental enhancers in our database, 2,533 (66%) overlapped elements identified here.
To validate in silico sorting and clade assignments, we used FACS to isolate myogenic mesoderm and neuronal nuclei from 6-8hr embryos11 to ~98% purity. Sorted nuclei were subjected to DNase-seq in bulk, and the resulting accessibility maps compared to our in silico sorted (i.e. clade-defined) 6-8hr sci-ATAC-seq data (Fig. 1e). The data show striking similarity both globally (Spearman’s rho >0.85 for matched vs. 0.53 for non-matched comparisons) and at individual loci. For example, previously characterized neuronal enhancers near the ftz gene are accessible in neurogenic ectoderm but not myogenic mesoderm with both methods (Fig. 1f, left). Conversely, muscle enhancers of Mef2 are accessible in myogenic mesoderm but not neurogenic ectoderm (Fig. 1f, right).
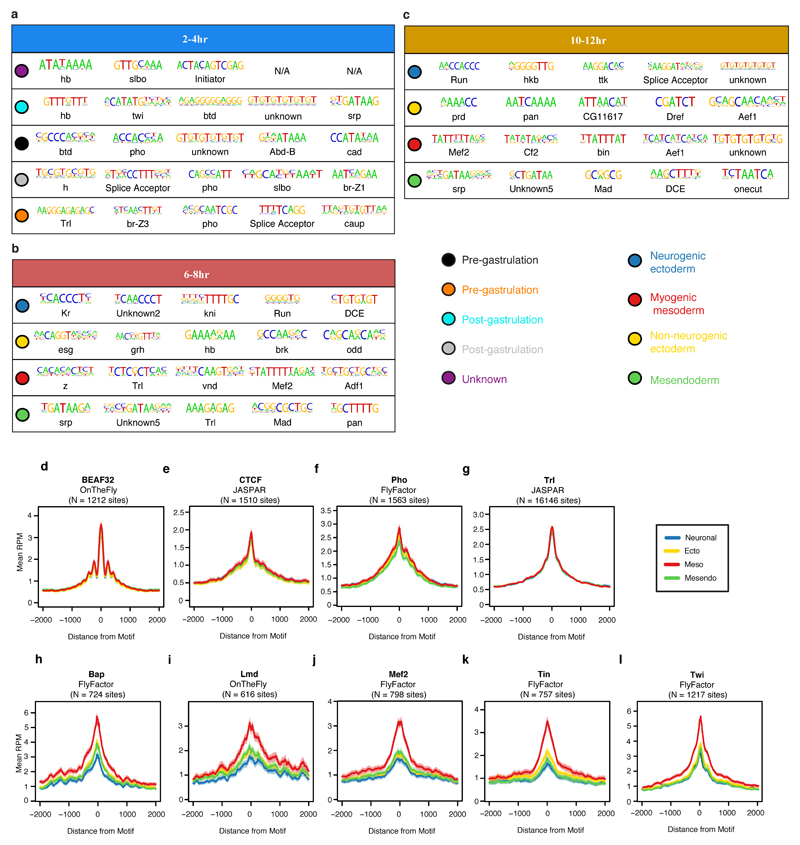
The clade assignments are further supported by motif enrichments for transcription factor (TF) binding sites and TF occupancy at putative enhancers. For example, at mid and late embryogenesis, motifs for the lineage-specifying factors Krüppel (Kr), Tramtrack (ttk) and Runt (Run) were among the most enriched in neurogenic ectoderm12 (clade 1); Mef2 and CF2 motifs in myogenic mesoderm13 (clade 3); and GATA motifs in mesendoderm (clade 4) (Extended Data Fig. 3a-c, Table S3). The later may reflect GATA factors’ conserved role in the specification of both non-myogenic mesoderm14 and endoderm15. Similarly, regions occupied by TFs with more constitutive roles, like CTCF, exhibit similar accessibility across all clades, while regions bound by myogenic TFs are more accessible in the myogenic mesodermal clade (Extended Data Fig. 3d-g versus 3h-l)16.
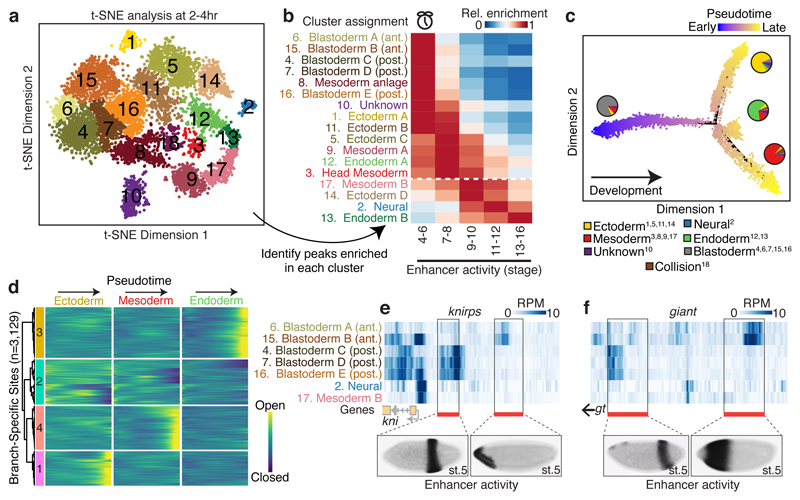
Cells examined at 2-4hrs fall into five major clades (Fig. 1a), whose regulatory identities are clearly distinct from later stages in embryogenesis (Extended Data Fig. 4; Table S2). The 2-4hr nuclei span embryos from the syncytial blastoderm, cellularization, gastrulation, and early germ-band extension (stages 5-8), with the majority of embryos being pre-gastrulation (stage 5). Developmental transitions during these stages are very rapid, with cellularization (stage 5) lasting 40 minutes, and gastrulation onset (stage 6) lasting only 10 minutes. To capture finer granularity across these dynamic transitions, we applied t-distributed stochastic neighbor embedding (t-SNE)17 to the binary sci-ATAC-seq matrix of cells vs. summits of accessibility. Because of confounding differences in sex chromosome copy number between male and female nuclei (Extended Data Fig. 5), we restricted the matrix to autosomal elements.
Density peak clustering18 cells after t-SNE identified 18 cell clusters at 2-4hrs (Fig. 2a). Calculating their relative enrichment in active enhancers and TF occupancy (Tables S4-S5) revealed marked differences in each cluster’s developmental stage (Fig. 2b), highlighting developmental time as a major axis of variation within this time point. Interestingly, two of the developmentally early clusters were sex-biased (cluster 10: 85% male; cluster 1: 69% female). While the identity of the male-biased cluster remains unclear, the female-biased cluster is enriched for enhancers active in brain anlage.
Figure 2. Temporal dynamics and spatial heterogeneity in chromatin accessibility in the early embryo.
a, t-SNE analysis of cells at 2-4hrs. Clusters were defined by a density peak clustering algorithm (Methods), and annotated based on overlaps between cluster-enriched peaks and known tissue-specific enhancers/genes. b, Relative enrichment of enhancers active at different developmental stages in each cluster. Clusters below the white dashed line are likely derived from embryos outside of the 2-4hr window, consequent to female ‘holding’ of older embryos. c, Pseudotime ordering of cells along a developmental trajectory. Cells were ordered in 3 dimensions (only 2 shown) with DDRTree. Point colors correspond to cells’ progression along the trajectory. Pie charts indicate relative frequencies of germ layer assignments (Fig. 2a) for cells in each branch. Superscript numbers in key indicate which clusters from (a) were included in each category. d, Heatmap of smoothed accessibility curves fit to sites (rows) for 100 bins of cells progressing through pseudotime (columns). Sites were clustered into 4 groups based on their temporal dynamics. Only sites classified as branch-specific are shown. e,f, Heatmaps of library size normalized read counts in the vicinity of the gap genes knirps (e) and giant (f). In each case, one characterized enhancer is known to drive anterior expression and another posterior expression in blastoderm embryos (stage 5). In situ images of enhancer activity obtained from ref 7.
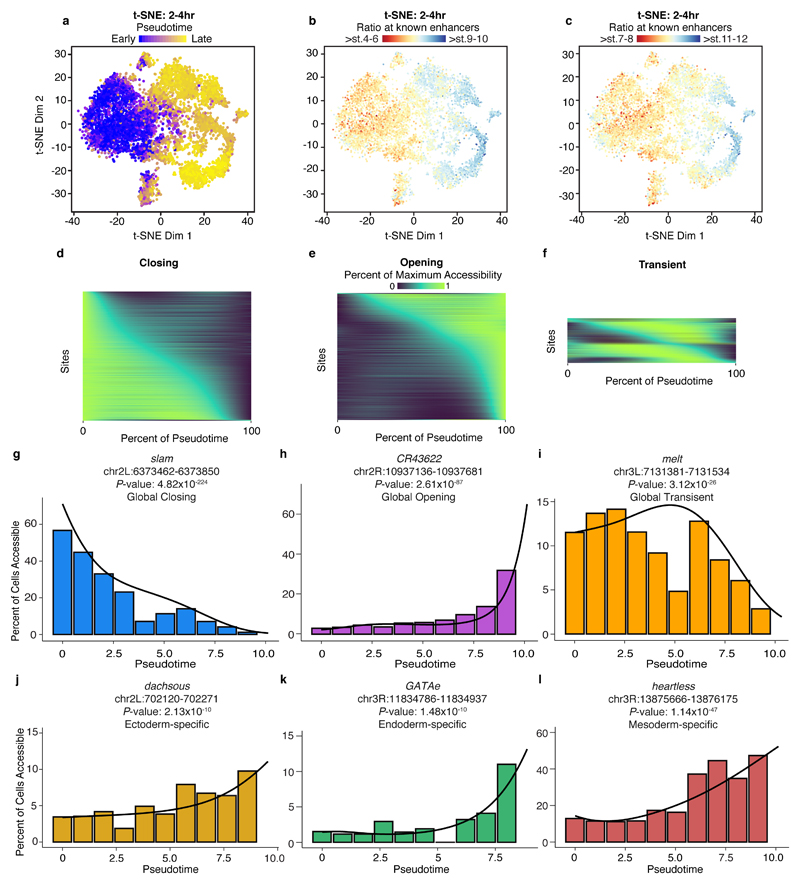
To evaluate this temporal ordering more formally, we employed a graph-based method to arrange single cell data into a developmental trajectory19. This ‘pseudotemporal’ ordering agreed well with the observed enrichments in cell clusters for active enhancers (Extended Data Fig. 6a-c). Notably, the trajectory split cells into three major branches that were consistent with our annotations of the major germ layers (neuronal cells are rare at this time point, as expected) (Fig. 2c). Pseudotemporal ordering also allowed us to explore the dynamics of sites that open or close within the 2-4hr window. We identified 12,165 sites with significant pseudotime-dependent temporal changes (1% false discovery rate, ‘FDR’). Using a simple heuristic, we classified 5,219 (43%) as closing as pseudotime progressed, 5,133 (42%) as opening, and the remaining 1,813 (15%) having more complex dynamics (Extended Data Fig. 6d-i, Table S6). Many of the most significant sites match expectations, falling within gene loci with dynamic roles during early embryogenesis. For example, the most significant closing site (P-value = 5x10-224) is within the slam locus, a gene essential for blastoderm cellularization during a very brief temporal window20 (Extended Data Fig. 6g).
To identify sites that open or close specifically within individual germ layer trajectories, we tested for pseudotime-dependent changes along each of the three paths (Fig. 2c) independently (with the potential caveat that these branches may be ‘contaminated’ to some degree by cells from older embryos, due to female ‘holding’). This identified 3,129 sites that are significantly pseudotime-dependent in only one branch, with 992, 1,071, and 1,066 restricted to the ectoderm, mesoderm, and endoderm, respectively (Fig. 2d, Tables S7-S10). As with the global pseudotime ordering, sites associated with lineage-specific pseudotime showed dynamics consistent with biological expectation (e.g. sites in heartless21, GATAe22, and dachsous23 loci are specifically open in mesoderm, endoderm, and ectoderm, respectively, Extended Data Fig. 6j-l).
As shown, germ layers appear late in pseudotime at 2-4hr (Fig. 2c). Yet, developmentally early nuclei in this same window (as defined in Fig. 2b; clusters 6, 15, 4, 7, 8, 16) have heterogeneous chromatin accessibility that reflects enhancer activity in refined spatial domains along the embryo’s antero-posterior (A/P) and dorso-ventral (D/V) axes (Table S5). For example, chromatin accessibility surrounding two gap genes, knirps and giant, varies among developmentally early clusters (Fig. 2e,f). The expression of knirps and giant is spatially patterned in two broad stripes along the A/P axis of the embryo, each controlled by two enhancers driving either the posterior or anterior expression7. The anterior enhancers of both genes have greater accessibility in cells of the presumptive anterior blastoderm clusters (clusters 6 and 15), while the posterior enhancers exhibit greater accessibility in the presumptive posterior blastoderm clusters (clusters 4, 7, and 16) (Fig. 2e,f). This example illustrates how despite being ‘shotgun’, sci-ATAC-seq can identify regulatory regions specifically accessible in spatially refined subsets of cells, without the need for FACS sorting. Classic lineage-tracing and transplantation experiments showed that the broad fate, and developmental potential, of cells is largely determined at the cellular blastoderm stage, leading to the concept of a blastoderm fate map24. Our data support the view that these early pre-gastrulation cell specification events are underpinned by spatial heterogeneity in chromatin accessibility.
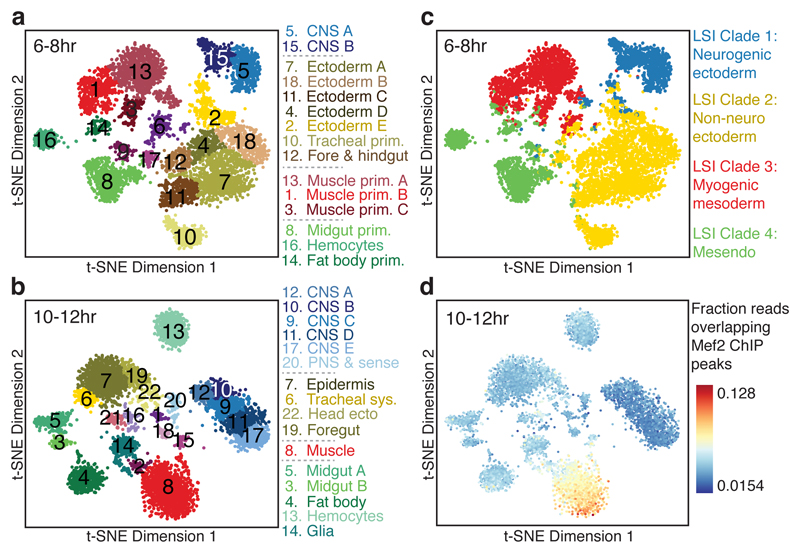
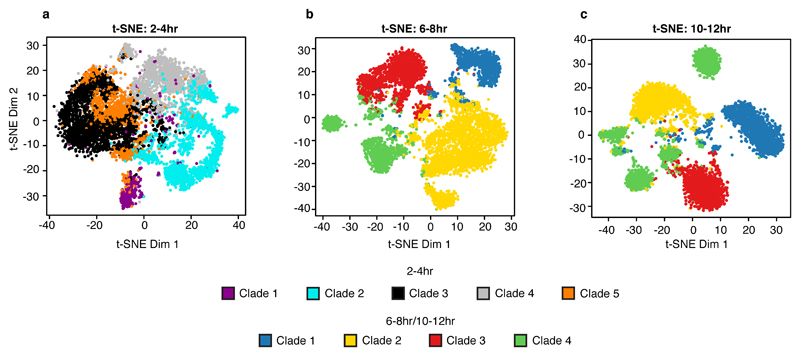
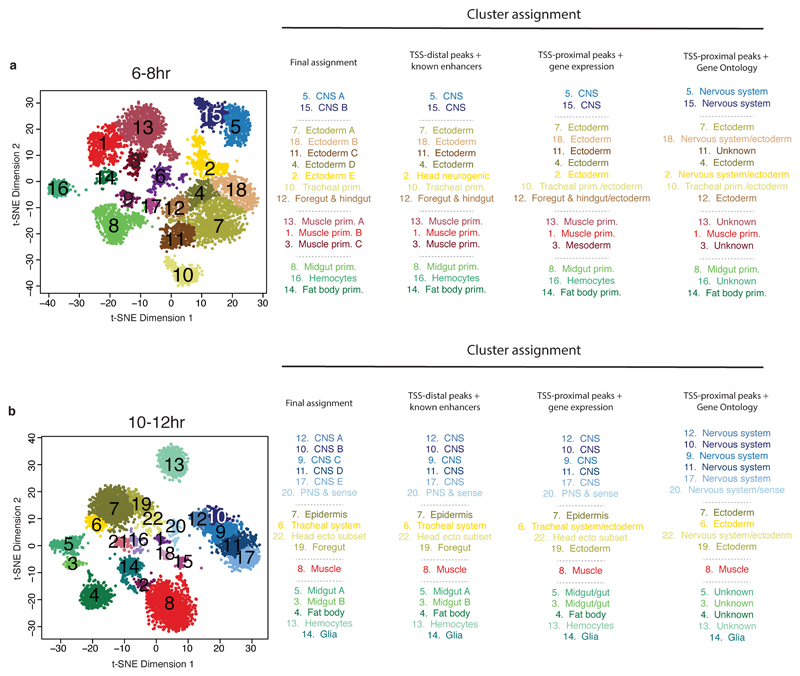
Applying t-SNE to the later time points, during lineage commitment (6-8hrs) and differentiation (10-12hrs), revealed a fine-grained map of cell clusters whose identities could be readily assigned to specific tissues or cell types (Fig. 3a,b; Table S4). A few small clusters were identified as likely ‘collisions’ resulting from the combinatorial indexing, and discarded (purple clusters in Fig. 3a,b; Extended Data Fig. 7). For all remaining clusters, the cell type assignments are broadly consistent with the germ layer clade assignments (Fig. 3c, Extended Data Fig. 8), but with much finer granularity, and are robust to using information from either enhancer or gene activity databases (Extended Data Fig. 9). For example, mesendoderm (clade 4 in Fig. 1, Fig. 3c) is resolved into three separate clusters at 6-8hrs, comprising the fat body (cluster 14) and hemocytes (cluster 16) from the non-myogenic mesoderm, and midgut (cluster 8) from the endoderm (Fig. 3a). Although we are clearly undersampling the number of cells present at these stages, the data is not obviously biased towards any particular tissue or cell type. The clusters’ tissue identities also match TF occupancy by tissue-specific factors (Table S4). For example, cells in cluster 8 (muscle) at 10-12hrs are enriched for reads overlapping Mef2 ChIP peaks at 10-12hrs, a key myogenic factor (Fig. 3d).
Figure 3. Single cells are readily assigned to tissues and cell types based on chromatin accessibility.
a,b, Clustering of sci-ATAC-seq data from the 6-8hr (a) and 10-12hr (b) time points after t-SNE dimensionality reduction. Clusters were annotated based on overlaps between cluster-enriched peaks and enhancers/genes with known tissue-specific activity. Three 6-8hr (6, 9, 17) and six 10-12hr (1, 2, 15, 16, 18, 21) clusters likely comprise multi-cell ‘collisions’ based on library complexity and the distribution of reads mapping to the X chromosome (Extended Data Fig. 7). c, 6-8 hr t-SNE shown in (a) but colored by original germ layer assignment. d, 10-12hr t-SNE shown in (b) but colored by the fraction of reads falling in Mef2 ChIP-seq peaks.
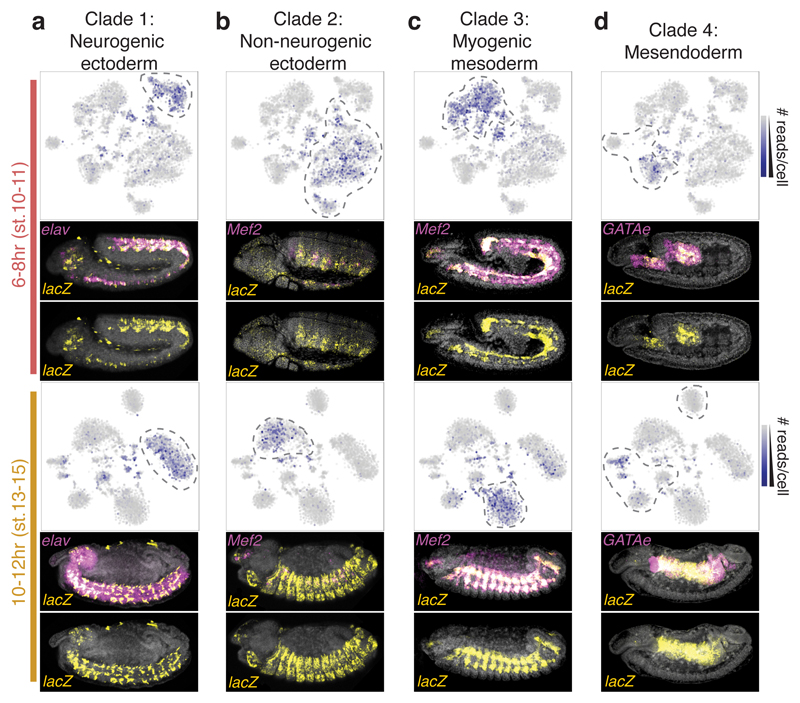
A major advantage of profiling chromatin accessibility is its potential to identify distal regulatory elements that shape gene expression. To determine if elements exhibiting tissue-specific chromatin accessibility corresponded to bona fide tissue-specific enhancers, we experimentally tested 31 elements in transgenic embryos. We selected promoter-distal elements exhibiting clade-specific accessibility at 6-8hrs and/or 10-12hrs that did not overlap previously characterized enhancers (Table S11). No other criteria were used to bias the selection towards different classes of distal regulation (e.g. enhancers vs. insulators). Each putative regulatory element was cloned in front of a minimal promoter driving a lacZ reporter and stably integrated into a common location in the Drosophila genome to minimize positional effects. Enhancer activity was assessed across all stages of embryogenesis by in situ hybridization.
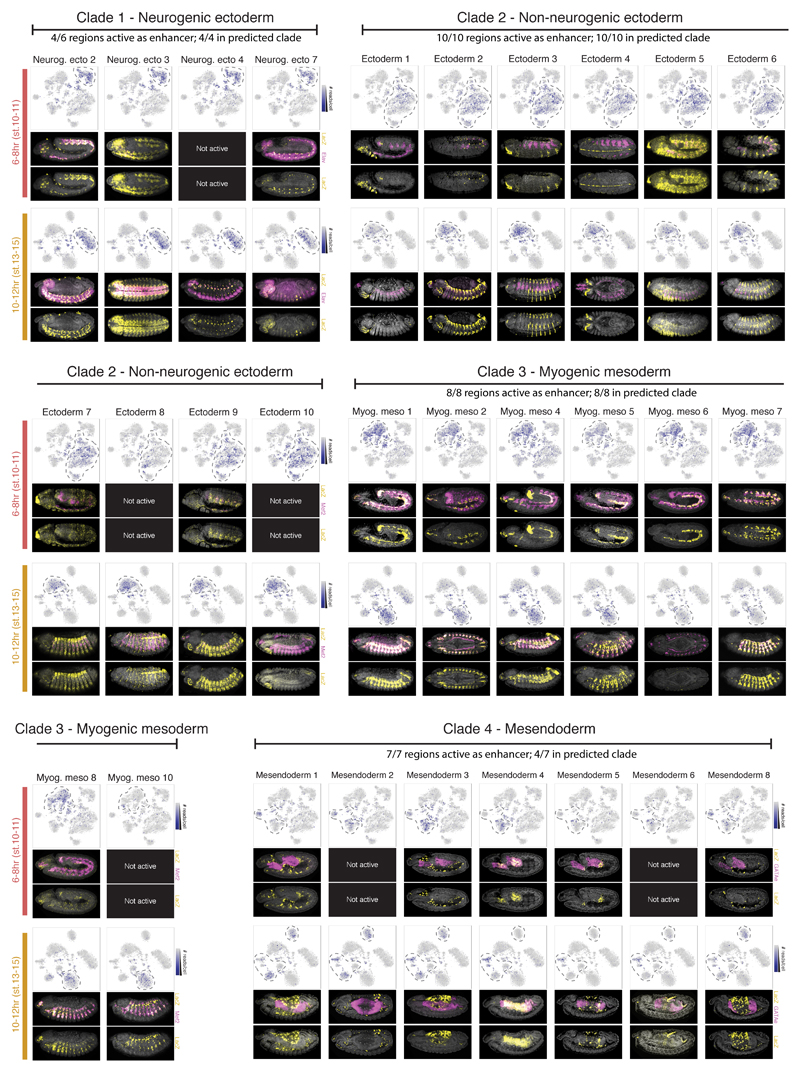
Surprisingly, given the simple selection strategy, 94% (29/31) of tested regions function as developmental enhancers in vivo (Fig. 4; Extended Data Fig. 10; Table S11). 90% (26/29) of active enhancers showed activity in the predicted tissue, with 23 being exclusive to that tissue (Extended Data Fig. 10; Table S11). For example, elements specifically accessible in the neuronal, ectodermal, or muscle clades show enhancer activity in the developing central nervous system (with some amnioserosa) (Fig. 4a), epidermis (Fig. 4b), and muscle (Fig. 4c), respectively. Elements specifically accessible in the mesendoderm clade often act as enhancers in either the gut endoderm or hemocytes (mesoderm). Enhancer 4, for example, is accessible in cells of the developing midgut (endoderm) at both 6-8hrs and 10-12hrs, matching the enhancer’s activity in the anterior-posterior midgut during these stages (Fig. 4d). The only exceptions to our predictions were 3/7 elements specifically accessible in clade 4, which when tested are active in yolk nuclei (Extended Data Fig. 10). As the yolk is extra-embryonic, this was unexpected and suggests a potential regulatory link between the yolk and mesendodermal tissues, which is supported by the role of the GATA TF Serpent in both yolk25 and non-myogenic mesoderm14.
Figure 4. Prediction of tissue-specific enhancer activity using sci-ATAC-seq.
a-d, Examples of candidate LSI clade-specific enhancers tested in transgenic reporters. For each time point, upper panels show the t-SNE map with the intensity of blue representing the number of sci-ATAC-seq reads obtained from each tested element. Cell clusters bounded by dashed lines correspond to the predicted clade of activity. Lower panels show transgenic embryos with nuclei stained with DAPI (grey), in situ hybridization for the lacZ reporter gene driven by the enhancer (yellow), and a tissue marker (magenta). All embryo images are lateral views, with anterior left and dorsal up, and are representative of observations across hundreds of embryos. The activity, and an overview, of all tested enhancers is shown in Extended Data Fig. 10.
In summary, our results demonstrate the power of sci-ATAC-seq to elucidate not only the developmental dynamics of chromatin accessibility, but also for the large-scale prediction of in vivo enhancer activity. Altogether, we identified 30,075 putative distal regulatory elements exhibiting clade-specific accessibility (Table S1). Combining reads from cells within each t-SNE cluster, we generated cell type-specific tracks of chromatin accessibility, which reveal a wealth of differences between cell types, and a powerful resource for future investigations (http://shiny.furlonglab.embl.de/scATACseqBrowser/). We also provide site-by-cell matrices and vignettes to facilitate further exploration of the data (http://atlas.gs.washington.edu).
The sparsity of data from single cell molecular profiling technologies, including sci-ATAC-seq, remains a challenge. Although new insights can be derived from aggregating observations across subsets of cells, as done here, increasing the number of reads per cell will increase the granularity at which chromatin accessibility can be explored. Of note, combinatorial indexing is subject to ‘collisions’. With our current strategy, ~12% of cell barcodes are expected to represent aggregates of 2+ cells. Analogous to doublets in emulsion-based single cell RNA-seq, these primarily add noise to the aggregate profiles of clades, but can sometimes lead to artifactual clusters. We present one strategy for identifying such clusters here; however, collisions are likely to be more effectively overcome by additional rounds of combinatorial indexing26, which would also increase throughput.
Looking forward, an expanded dataset that includes many more cells per time point, and that covers the entirety of Drosophila development, has the potential to identify rarer cell types and reveal a fully continuous view of the landscape of chromatin accessibility as it unfolds. Our ability to understand how changes in the regulatory landscape underlie lineage commitment would be greatly aided by the concurrent measurement of chromatin accessibility and transcription. In the long term, the integration of chromatin state, transcriptional output26, lineage history27,28, and spatial information29,30 at single cell resolution has the potential to unlock how an organism’s genome encodes its development.
Online Methods
Fixation of embryos and nuclear isolation
Wild-type D. melanogaster embryos were collected and fixed as described previously33. Briefly, embryos were collected on apple-agar plates in two-hour windows following three one-hour pre-collections to synchronize the collections. After aging (at 25°C) to the appropriate time window, embryos were washed from the plates, cleaned and dechorionated in 50% bleach for 2 minutes, followed by 15 minutes fixation while shaking at room temperature in a solution of heptane and cross-linking solution (1.8% formaldehyde in PBS, v/v). Fixation was stopped by washing with a solution of 125 mM glycine in PBS. The embryos were washed, dried, and frozen at -80°C in ~1 g aliquots. Embryo dissociation and nuclear isolation was performed as described previously (steps 1-10)11 using a dounce homogenizer and a 22G needle. The resulting nuclei were pelleted at 2,000g at 4°C, resuspended in Nuclear Freezing Buffer (50 mM Tris at pH 8.0, 25% glycerol, 5 mM Mg(OAc)2, 0.1 mM EDTA, 5 mM DTT, 1X protease inhibitor cocktail [Roche], 1:2500 superasin [Ambion]) and flash frozen in liquid nitrogen.
Collection of sci-ATAC-seq data
Our protocol for generating sci-ATAC-seq data was largely as previously described1, but with a few important improvements. Frozen nuclei were thawed quickly in a 37°C water bath and then pelleted at 500g for 5 minutes at 4°C, aspirated and resuspended in cold lysis buffer (supplemented with protease inhibitors). Nuclei were stained with 3 μM DAPI and 2,500 DAPI+ nuclei were sorted into each well of a 96-well plate containing 9 ul of lysis buffer (10 mM Tris-HCl, pH 7.4, 10 mM NaCl, 3 mM MgCl2, 0.1% IGEPAL CA-630 from34, supplemented with protease inhibitor [Sigma]) and 10 μl of TD buffer (Illumina, part of FC-121-1031) in each well. 1 μl of each of the 96 custom and uniquely indexed Tn5 Transposomes (Illumina, 2.5 uM)35 was then added to each well and nuclei were incubated at 55°C for 30 minutes. Following tagmentation, 20 μl of 40 mM EDTA (supplemented with 1 mM Spermidine) was added to stop the reaction and the plate was incubated at 37°C for 15 minutes. All wells of the plate were then pooled, nuclei were stained again with 3 μM DAPI and 25 DAPI+ nuclei were sorted into each well of a second set of 96-well plates that contained 12 μl of our reverse crosslinking buffer (11 μl of EB buffer [Qiagen] supplemented with 0.5 μl of 20 mg/ml Proteinase K [Qiagen] and 0.5 μl of 1% SDS). For each time point, we collected 4 plates of nuclei at this stage. We expect that sorting 25 nuclei into each well at this stage will result in approximately 12% of barcodes representing more than one nucleus (‘collisions’)1. Nuclei were then incubated overnight at 65°C. Proceeding from reverse-crosslinking, we added primers (0.5 μM final concentration, Table S12), 7.5 μl of NPM polymerase master mix (Illumina, FC-121-1012) and BSA (2X final concentration; NEB) to each well. Tagmented DNA was then PCR amplified. To determine the number of cycles required, we first amplified several test wells of nuclei that had been sorted onto an additional plate and monitored the reactions with SYBR green on a qPCR machine to establish when the libraries reached saturation. The cycling conditions were as follows:
72°C 3 minutes
98°C 30 seconds
- 15-25 Cycles:
- 98°C 10 seconds
- 63°C 30 seconds
- 72°C 1 minute
Hold at 10°C
We have found that the optimal number of cycles can vary from one experiment to the next, but is usually in the range of 15-25 cycles. After PCR amplification, all wells were pooled and split across 4 DNA Clean & Concentrator-5 columns (Zymo) and then all 4 products were pooled and cleaned again using Ampure beads (Agencourt). Finally, the concentration and quality of the libraries was determined using the BioAnalyzer 7500 DNA kit (Agilent). For sequencing, equimolar libraries from the three time points were pooled and loaded at 1.5 pM on a NextSeq High output 300 cycle kit and sequenced using custom primers and a custom sequencing recipe35. 50 base pairs (bp) were sequenced from each end, in addition to the barcodes introduced during tagmentation and PCR amplification. This improved protocol resulted in roughly an order of magnitude more reads per cell than previously reported.
Read alignment, cell assignment, and duplicate removal
To process the data, BCL files were converted to fastq files using bcl2fastq v2.16 (Illumina). Each read was assigned a barcode which was actually made up of 4 individual components: a tagmentation barcode and a PCR barcode added to the P5 end of the molecule and a distinct tagmentation and PCR barcode added to the P7 end of the molecule. To correct for sequencing and/or PCR amplification errors, we broke the barcode into its constituent parts and matched each piece against all possible barcodes. If the component was within 3 edits of an expected barcode and the next best matching barcode was at least 2 edits further away, we fixed the barcode to its presumptive match. Otherwise, we classified the barcode as ambiguous or unknown. We next mapped each read to the dm3 reference genome using bowtie236 with ‘-X 2000 -3 1’ as options and then filtered out read pairs that did not map uniquely to autosomes or sex chromosomes with a mapping quality of at least 10, as well as reads that were associated with ambiguous or unknown barcodes. Of 430,658,635 sequenced read pairs, 301,314,040 (70%) mapped to the nuclear reference genome, with an assigned cell barcode. In contrast, only 366,468 read pairs (0.09%) mapped to the mitochondrial genome, with an assigned cell barcode. We subsequently removed PCR duplicates for all reads that mapped to the nuclear genome using a custom python script that only considered reads assigned to the same barcode. Finally, to determine which barcodes represented genuine cells (as opposed to background reads assigned to improper barcodes), we counted the number of reads assigned to each barcode and log-transformed those counts and then used the mclust package in R37,38, which fits the data using a mixture model and determines the maximum likelihood parameters for a given number of distributions, to define two distributions of barcodes – setting the read depth cutoff for a cell at the point at which we were 95% confident that the barcode belonged to the higher read depth distribution. Considering the distribution of barcodes for all three experiments at the same time, we determined this read depth cutoff to be 500 reads (i.e. we required a barcode to be associated with at least 500 reads to be considered a true cell; Extended Data Fig. 1). See http://atlas.gs.washington.edu for more details on data processing.
Latent semantic indexing
To further process the raw data we first broke the genome into 2kb windows and then scored whether each cell had any insertions in each window, creating a large binary matrix of windows by cells for each time point. Based on this binary matrix, we only retained the top 20,000 most commonly used sites (this number could extend a little above 20,000 because we retained all sites that were tied at the threshold for cell counts) and then filtered out the lowest 10% of cells in terms of number of sites accessible. We then normalized and re-scaled these large binary matrices by using the term frequency-inverse document frequency (“TF-IDF”) transformation. We first weighted each site that was accessible in an individual cell by the total number of sites accessible in that cell. We then multiplied these weighted values by log(1 + the inverse frequency of each site across all cells). Subsequently, we performed singular value decomposition on the TF-IDF matrix and then generated a lower dimensional representation of the data by only considering the 2nd through 6th dimensions (because we have found that the first dimension is always highly correlated with read depth). After standardizing these LSI scores of accessibility by row and capping them at +/-1.5, they were then used to cluster cells and windows based on cosine distances using the ward algorithm in R. Visual examination of the resulting bi-clustered heatmap identified 4-5 major clades for each time point.
Peak calling
To identify specific regulatory elements within each of the major clades in each time point, we aggregated the data across cells from each clade using a process we call “in silico cell sorting”. To do so we simply collected all the unique mapped reads associated with cells that were assigned to a given clade and saved that as a distinct bam file. Then for each bam file representing a clade, we used MACS239 to identify peaks of increased insertion frequency, as well as summits of accessibility within each of those peaks. For MACS, we used the macs2 callpeak command with the following parameters: --nomodel --keep-dup all --extsize 200 --shift -100. For downstream analyses we generated a master list of potential regulatory elements by taking 150 bp windows centered on all summits called in each clade in each time point and merged them with the BEDTools program40. For Extended Data Fig. 1d, we also compared our sci-ATAC-seq data to DNase-seq bulk data collected by Thomas et al5 on whole embryos at similar time points. In order to be consistent in our comparisons (and provide a comprehensive list of peaks), we downloaded the raw DNase-seq reads (36 bp, single-end), remapped them with our pipeline and called peaks with MACS2 as described above. Specifically, we downloaded two replicates for each of 3 time points - stage 5, stage 11 and stage 14. Peaks called on each replicate independently were intersected to create a master list of peaks for each time point, which were then intersected with our sci-ATAC-seq data.
Identification of differentially accessible sites
To identify regulatory elements that were more accessible specifically in individual clades, we started by generating a new binary matrix of insertion scores for individual cells using the master list of summits of accessibility described above. We then used a logistic regression framework to test whether cells of a given clade were more likely to have insertions at a given site relative to all other cells. To identify sites that were specifically more accessible in a single clade, we first found summits that were significantly more open in a given clade at a 1% FDR, including log10(total unique reads) for each individual cell as a covariate. To ensure that these sites were specific to any one clade, we also filtered out sites that were significantly open in any other clade at a relaxed 20% FDR. All testing of differential accessibility was implemented with the Monocle 2 package19,41 using the binomialff test. For this analysis, only sites observed in at least 50 cells in a given time point were tested.
K-mer discovery
We used SeqGL42 to identify motifs that were enriched in clade-specific elements. To do so, we started with all clade specific sites, based on our logistic regression testing described above. Because our master list of sites included sites of variable length (after merging all sites from all clusters), we only considered 150 bp windows centered on summit midpoints. We also removed sites within 500 bp of a transcription start site, to focus on tissue specific distal elements. As a background set of regions we randomly selected an equal number of sites from the master summit list that matched the GC and repeat element content of the test set (this was controlled using a script provided in the gkm-SVM software package)43. Finally, instead of default parameters, we used 200 groups and 30,000 features, similar to the parameters used to analyze DNase-seq data in the original SeqGL publication42.
Enrichments for tissue/cell type activity and TF binding data
To perform categorical enrichments, we annotated regions/windows/peaks of the non-coding genome using two types of experimental information: 1) Tissue specific expression of the nearest gene comprising in situ hybridization data from the Berkeley Drosophila Genome Project (http://insitu.fruitfly.org/cgi-bin/ex/insitu.pl) and a download of the FlyBase gene expression annotations (May 2016). 2) A custom enhancer database of ~8,000 transgenic reporter assays covering 15% of the non-coding genome, containing spatio-temporal information of ~4000 active developmental enhancers (CAD4; Table S13). We compiled the enhancer database (CAD4) from three primary resources: Our previous CRM Activity Database (CAD)6, entries from the RedFly enhancer database (Release 5)8, and data from the Vienna Tiling Project7. We compiled this dataset in two steps. First, all expression terms (and timing terms, where available) were mapped to a common standard (FlyBase anatomy terms v.1.47) and, when timing information was available) a common set of stage windows (stages 1-3, stages 4-6, stages 7-8, stages 9-10, stages 11-12, stages 13-16). In most cases, the mapping was automatic and unambiguous. In some cases, manual term matching was required (generally unambiguous). In the second step, we merged overlapping entries from CAD3 and the RedFly database and manually removed redundant information. Given the different methodologies used in the compilation of the data sources, no attempt was made to combine entries from CAD3/RedFly with the Vienna Tiles.
Almost all expression terms for both the gene and enhancer annotations could be mapped to a common set of hierarchically organized anatomical terms (FlyBase anatomy OBO file v.1.47). In the few cases where an exact match could not be found, a choice was made manually or using the map provided by FlyBase (FBrf0219073). The stage/timing information from both datasets was shifted as needed to match a common set of grouped stages (stages 1-3, stages 4-6, stages 7-8, stages 9-10, stages 11-12, stages 13-16). Our compiled data is available in Table S13. In addition to BDGP/FlyBase gene expression data, we made use of Drosophila-specific gene-level functional information (biological process, molecular function, and cellular compartment) downloaded from the Gene Ontology Consortium (v.1.2) and additional, higher-level functional annotations downloaded from the PANTHER classification system (v.8) corresponding roughly to the higher-level categories of the GO-SLIM ontology.
To further explore the function of specific regions of noncoding DNA, we also made use of a custom compilation of high-quality transcription factor binding data from ChIP studies during embryogenesis (taken from ref16) that allowed us to assign transcription factor binding events to each sciATAC window/peak. Transcription factor binding motifs were taken from this same dataset. To infer likely transcription factor binding events, we scanned under published ChIP peaks for instances of the motif using FIMO44. Enrichments for these data are listed under the category name ‘custom’ in the enrichment data tables.
Categorical enrichments
To identify enriched categories within the LSI clades, we first assigned categorical labels by looking for overlaps between our summit regions and our enhancer activity database, with summits inheriting the timing and expression labels of all overlapping enhancers. Gene-based annotations (expression, GO, and PANTHER terms) were assigned by association to the nearest gene.
To identify differentially accessible summit regions we used a logistic-regression framework (see above) as applied to all summit regions containing reads in at least 50 cells. Enriched summit regions constituted the foreground set for any clade, with the remaining tested summit regions constituting the background set. For each of our category sets (e.g. enhancer expression, gene expression, or GO) we used a Fisher’s exact test to look for over-representation of each category among our foreground set relative to the background set. Because many of our categories are strongly overlapping, we have applied no formal correction for multiple comparison, choosing instead to focus on large, consistent enrichments with highly significant p-values. Overlaps among significant categories were visualized by plotting distances between categories using the pyEnrichment package (https://github.com/ofedrigo/pyEnrichment) to avoid overcalling a category.
Categorical enrichment within our t-SNE clusters was assessed similarly. Foreground sets per cluster (within each time point) were assessed using the results of our binomial enrichment test (q-value <= 0.01 and a beta > 0). The background set consisted of all other tested summits at that time point (see above).
t-stochastic neighbor embedding and cluster identification
To identify clusters of cells with finer resolution than the LSI-based clades, we used t-SNE17 for dimensionality reduction. To do so, we started with the same binary matrix of insertions in summits that we used to identify clade-specific differentially accessible sites. We again filtered out the lowest 10% of cells (in terms of site coverage) and in this case we only retained sites that were observed in at least 5% of cells. We then transformed this matrix with the TF-IDF algorithm described above. Finally, we generated a lower dimensional representation of the data by including the first 50 dimensions of the singular value decomposition of this TF-IDF-transformed matrix. This representation was then used as input for the Rtsne package in R17,45,46. To identify clusters of cells in this two dimensional representation of the data, we used the density peak clustering algorithm18 as implemented in Monocle 219,41. Rho and delta parameters were chosen to be very inclusive of outlier peak centers (based on the decision plot), while making sure that the clusters were sensible based on visual inspection of the cluster assignments on the t-SNE plot.
t-SNE differential accessibility
To identify summits that were significantly more accessible in t-SNE-defined cell clusters, we used a similar framework to the one described for LSI-based clades above. There were however a few differences. In this case, we consider sites that were seen in at least 10 cells in any time point (instead of 50). In addition, we did not use a second cutoff to determine specificity within a time point.
Sexing individual nuclei
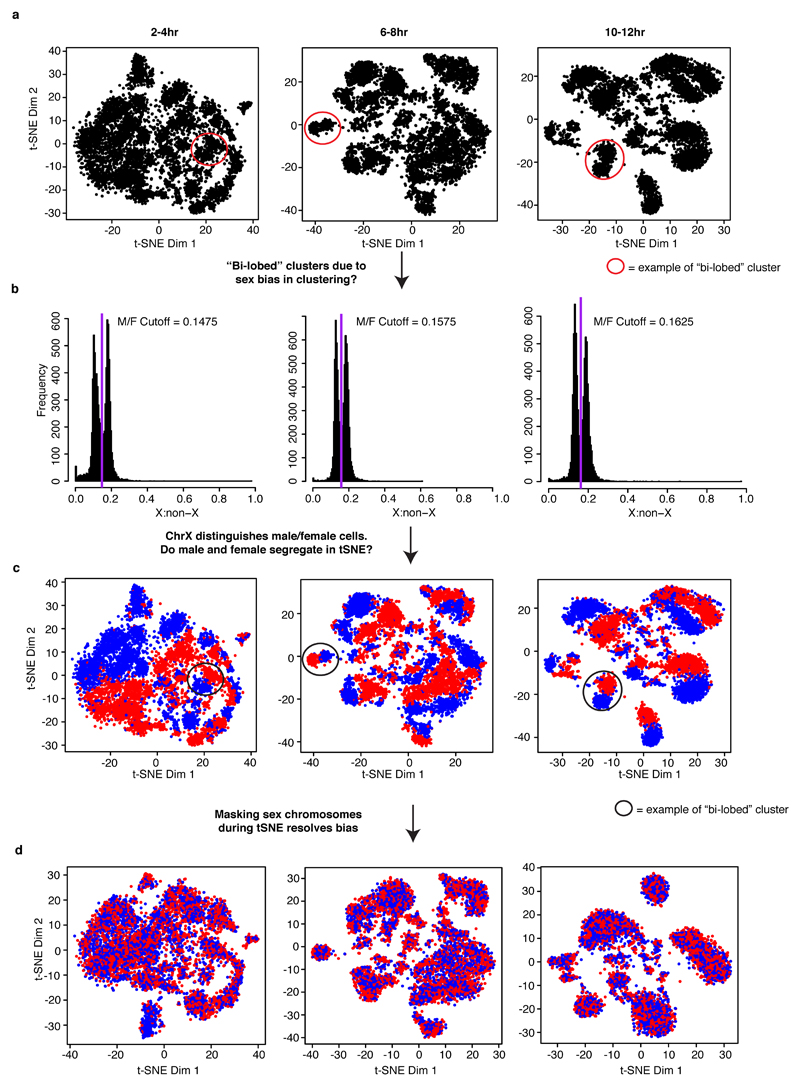
Another biological axis of the data that came to light through the use of t-SNE plots was that we were able to clearly distinguish nuclei from male and female embryos. In an initial analysis, we included data from the sex chromosomes while clustering cells (as was done for the germ layer analysis). This resulted in many individual cell clusters appearing ‘bi-lobed’ (Extended Data Fig. 5a), which prompted us to explore if there was sex-bias in the lobes of individual cell clusters. We found that the distribution of reads mapping to the X chromosome in individual cells was distinctly bimodal (Extended Data Fig. 5b), allowing us to assign a sex to each cell. When we colored the t-SNE plots by these sex assignments we found that the lobes of individual cell clusters almost perfectly segregated the sexes (Extended Data Fig. 5c). Although this may be very useful for future studies, we alleviated this ‘bi-lobed’ problem here by excluding sex chromosome reads from our analysis and re-clustered cells with t-SNE. This resolved the bi-lobed structures and removed the sex bias from almost every individual cluster (Extended Data Fig. 5d).
Arranging single cells from 2-4hr embryos along developmental trajectories
Because we noted that cells from 2-4hr embryos were distributed across the t-SNE map in a manner consistent with their developmental stage, we sought to more formally evaluate the arrangement of individual cells along a temporal trajectory. To do so, we employed Monocle 219,41 version 2.5.3, which uses a reverse graph embedding algorithm to learn trajectories in single cell data and was recently extended to single cell ATAC-seq data47. To define sites to use for ordering cells, we combined the t-SNE clusters into major groups based on our annotations - “blastoderm”, “mesoderm”, “endoderm”, “ectoderm”, “neural ectoderm”, “unknown” and “collisions” - and identified sites that were differentially accessible (1% FDR) between each cluster and all other cells within that time point (with the exception of the “collision” and “unknown” clusters). We then took the union of sites that were among the 100 most differentially accessible for each cluster and used this set of sites to order cells in Monocle. In order to reduce the sparsity of the data, we aggregated all sites that were within 1kb of each other and summed their reads to obtain a regional score accessibility. Using these aggregated sites as features, cells were ordered by the DDRTree algorithm in three dimensions (“max_components = 3”), with the “ncenter” parameter set to 200 and the maxIter parameter set to 1000 during the dimensionality reduction step. Only the first two dimensions are visualized and the coordinates of the first dimension were multiplied by -1 so that pseudotime would run left to right (Fig. 2c). This resulted in a tree with four differentiated branches representing the major germ layers (one is a possibly spurious, short branch along the ectodermal lineage). On the basis of this ordering, we aimed to identify sites that were significantly associated with progression in pseudotime using the likelihood ratio testing framework in Monocle 2 (Table S6). As with ordering the cells, we adopted a strategy to reduce the sparsity of our data. Specifically, we binned the pseudotime into 100 bins and counted how many cells had accessible chromatin in each pseudotime bin for each site. All sites that were accessible in more than 10 cells were tested. To identify sites that were associated with pseudotime in a lineage-specific fashion we used a similar framework. First, we separated out cells along each unbranched path through the trajectory to test for pseudotime dependence separately. To do so, we took the cells at the tip of each lineage state and traversed the graph to the root state (i.e. beginning of the pseudotime) collecting the cells that were arranged along this path. As mentioned above, there was a small branch off of the ectodermal lineage that was ignored for this analysis. Then we binned the cells along this single pseudotime branch and performed likelihood ratio testing for each lineage as we did for the global pseudotime measure (Tables S7-S9). After testing all three lineages, we defined a site as specific to a lineage if it was significantly associated with pseudotime in that lineage (1% FDR) but was not significantly associated with pseudotime in the other two lineages at a relaxed threshold (20% FDR).
Identifying clusters of cells that are likely artifacts of barcode collisions
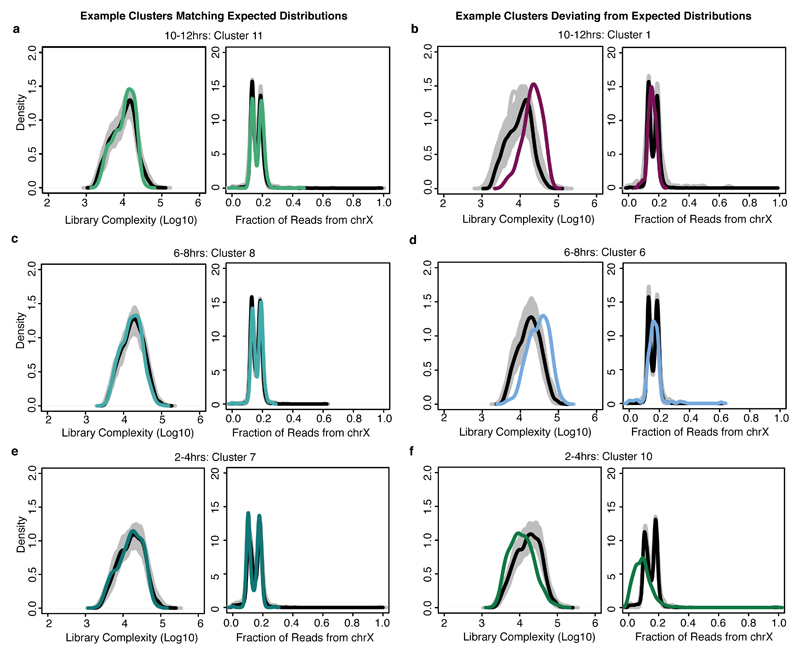
Several small clusters (e.g. cluster 6 at 6-8hrs) appear to be mixtures of cells from different germ layers and/or tissues based on our enrichment analysis. To determine if these are technical (due to barcode collisions, where one cell barcode represents the nuclear contents of two cells) or biological we used two metrics to identify collisions (instances wherein two or more cells coincidentally pass through the same combination of wells during sci-ATAC-seq): First, we looked at the estimated complexity of individual cells that make up these small clusters, as collisions are expected to be twice as complex on average as barcodes that truly represent an individual cell. To calculate the estimated library complexity (i.e. the estimated total number of unique reads per cell in the library), we used the same algorithm as implemented in Picard (http://broadinstitute.github.io/picard) on a cell-by-cell basis. Second, we considered whether the proportion of reads mapping to the X chromosome for cells in these clusters was distinctly bimodal, as collisions would be just as likely to combine data from cells of the opposite sex as from two cells of the same sex (Extended Data Fig. 7). While the vast majority of clusters exhibited distributions of complexity and X chromosome coverage consistent with single nuclei, a small subset of clusters in each time point showed either higher complexity than expected, more unimodality of reads mapping to the X chromosome, or both - consistent with our suspicion that these are cell collision clusters (Extended Data Fig. 7). At 2-4hrs, we identified one (2.3% of cells), at 6-8hrs three (5.8% of cells) and 10-12hrs six (7.3% of cells) potential collision clusters (Fig. 2a and Fig. 4a,b - purple clusters).
Transgenic enhancer assays
Candidate clade-specific enhancers were selected from sci-ATAC-seq summits using the following criteria only: (1) Summit shows enriched accessibility specifically in the target cell clade at 6-8hrs and/or 10-12hrs (q-value<0.01 and beta>0 in target clade, q-value>0.2 in all other clades); (2) summit does not fall within 500 bp of an annotated transcription start site; (3) summit does not overlap a region already in our database of characterized developmental enhancers. Summits showing a range of effect sizes (beta) were selected (minimum beta approx. 1.9; see Table S11). The selected regions, plus 100-200 bp of flanking sequence, were PCR amplified from genomic DNA (primers are listed in Table S11) and cloned upstream of a minimal hsp70-promoter driving a LacZ reporter gene in an attB-containing plasmid. All constructs were injected into embryos according to standard methods48 and inserted into the attP landing site line M{3xP3-RFP.attP'}ZH-51C via PhiC31 integrase insertion49, yielding integration at chromosomal position 51C1. Transgenic lines were generated by BestGene Inc (Chino Hills, CA, USA). Ten elements from each of the four germ layer clades were initially selected – some failed at the cloning or transgenesis phase. We obtained 31 transgenic lines, representing six candidate regions with specific accessibility in neurogenic ectoderm, ten in non-neurogenic ectoderm, eight in myogenic mesoderm, and seven in non-myogenic mesoderm plus endoderm.
Overnight collections of homozygous embryos spanning all stages of embryogenesis were formaldehyde-fixed, stained by double fluorescent in situ hybridization50, and mounted in ProLong Gold with DAPI (Invitrogen; cat. #P36931). Antisense in situ probes against LacZ and a tissue marker gene were used: Mef2 marking myogenic mesoderm was used for predicted myogenic mesoderm and non-neurogenic ectoderm enhancers; GATAe was used for predicted non-myogenic mesoderm and endoderm enhancers. For the predicted neurogenic ectoderm enhancers, neurons were marked by immunostaining with antibodies against the Elav protein (Elav-9F8A9; Developmental Studies Hybridoma Bank). The annotation of enhancer activity is based on observations across hundreds of embryos. Representative images were acquired with a Zeiss LSM780 laser-scanning confocal microscope using a PlanApo 20X/NA0.8 objective at an effective pixel size of 461 nm in xy. Images were processed using Fiji51. Annotated t-SNE plots for each candidate enhancer were produced by plotting the sum of sci-ATAC-seq reads per cell that overlap each tested genomic region.
FACS-isolation of tissue-specific nuclei and DNase-seq
Target populations of cell nuclei from staged fixed embryos were obtained by FACS as previously described11 with the following modifications. Prior to incubation with primary antibodies, nuclei from 6-8hr embryos were incubated in PBS supplemented with 5% BSA, 0.1% TritonX-100 and 0.2% Igepal-630 on a rotator at 4°C for 30 mins. Primary antibody staining was performed overnight at 4°C in 3mL PBS supplemented with 5% BSA and 0.1% TritonX-100 per 1g of frozen embryos. Primary antibodies used were monoclonal anti-elav (Developmental Studies Hybridoma Bank 9F8A9 at 1:100 dilution) to mark post-mitotic neurons, and anti-Mef2 (produced and pre-cleared in the Furlong lab and used at 1:200 dilution) to mark myogenic mesoderm. Secondary antibody staining was performed for 1 hr at 4°C in the same buffer. Following each antibody staining, nuclei were washed twice by pelleting and resuspending in 10mL PBS supplemented with 5% BSA. An aliquot of stained, unsorted nuclei was put aside to represent the whole-embryo. For DNase digestion, nuclei were resuspended in R-buffer (7.5mM Tris pH8, 45mM NaCl, 30mM KCl, 6mM MgCl2, 1mM CaCl2) and between 10 and 20 million nuclei were digested using between 5 and 20 units of DNaseI at 37°C for 3min, and the reaction was stopped by adding 500uL Stop-buffer (50mM Tris, pH-8, 100mM NaCL, 0.1% SDS, 100mM EDTA pH-8). A small control digest without DNaseI was performed to assess DNA integrity. Following addition of RNaseA, samples were incubated at 55°C for 10 mins, then 25uL of ProteinaseK (25mg/mL) was added and the samples were incubated overnight at 65°C to reverse cross-links. A small aliquot was run on a 1% agarose gel to assess digestion levels, and optimal digests were size-fractionated using 10-40% sucrose gradients. DNA fragments ~100-500bp in length were isolated from fractions using a Qiagen PCR clean up kit and checked for enrichment in known hypersensitive sites by qPCR. The digests with the highest qPCR enrichment were selected for library preparation using the NextFlex qRNA-seq Kit v2 kit (Biooscientific #NOVA-5130-12). In short, between ~10 and 30ng DNA consisting of ~100-500bp fragments that result from DNase digestion was end-repaired and terminal adenosine residues were added. Adapters containing in-line molecular barcodes were ligated, after which the material was size selected using AMPure beads (negative selection with 0.6X beads, then positive selection with 0.98X beads). PCR amplification was performed using barcoded primers to introduce sample barcodes for 12-16 cycles, depending on input amount. The PCR-amplified library was purified using AMPure beads, quantified using a Qubit High-sensitivity DNA kit (Invitrogen), and sized on a Bioanalyzer High-sensitivity DNA chip (Agilent). Libraries were pooled and sequenced in paired-end mode on a HiSeq2000 (Ilumina). Reads were mapped to the Dm3 reference genome using BWA aln52, keeping only reads with a mapping quality score greater than 20. Duplicate reads originating from PCR were removed using the Je suite53 making use of the molecular indices.
Ethics statement
Anti-Mef2 antibodies were generated from rabbits at EMBL in accordance with European Law and EMBL ethical guidelines. Drosophila melanogaster were reared and collected at EMBL in accordance with standard practice and the ethical standards of the European Research community.
Data availability
All raw ATAC-seq and DNase-seq data are available through GEO (accession GSE101581) and ArrayExpress (E-MTAB-5999). BigWig files for coverage within each clade, regions of accessibility (peak calls), and a master list of all potential regulatory elements (Table S1) will be made available on the Furlong lab web page http://furlonglab.embl.de/data. To make the data easily accessible we have generated a searchable html where users can select a t-SNE cluster or genomic locus of interest and visualize the data throughout the genome (http://shiny.furlonglab.embl.de/scATACseqBrowser/) and site-by-cell matrices and vignettes to facilitate further exploration of the data (http://atlas.gs.washington.edu).
Code availability
Code used in the processing and analysis of the data in this manuscript is available upon request.
Extended Data
Extended Data Figure 1. Summary of read distributions across the three sampled time points.
a, Log10 counts of sci-ATAC-seq reads per barcode at each time point are bimodally distributed. A threshold of 500 reads was used to identify barcodes corresponding to valid cells vs. background. b, Fragment size distribution at each of time point is consistent with expected nucleosomal banding pattern of standard (bulk) ATAC-seq experiments. c, Violin plot for distribution of unique, mappable reads per cell at each time point (2-4hr N = 8,024, 6-8hr N = 7,880, 10-12hr N = 7,181) plotted on a Log10 scale. White point indicates median value, thick black line extends to 25th and 75th percentile, and thin black lines extend to most extreme values within 1.5 times the interquartile range of the median. The filled color width represents a density estimate of the distribution of cells along the y-axis. d, Fraction of previously characterized DHS covered in least 10 cells upon sampling a given number of cells (solid lines) as compared to random genomic windows (dashed lines). e, An UpSet plot shows the degree to which the top 20,000 windows overlap between the three time points. Each bar shows the number of sites included in a specific intersection and the “peg board” below shows which comparison in particular is included in that bar. f, Bar plot of the number of sites identified as significantly open in each clade (1% FDR; gray bar; “first cutoff”) and the number of sites specific to that clade (orange bar; “second cutoff”). Overlaid on the barplot (purple points) is the fraction of sites passing the first cutoff that also pass the second cutoff (count of orange bar / count of gray bar).
Extended Data Figure 2. Enhancer enrichments for LSI clades at 6-8hrs and 10-12hrs.
Enrichment for tissue-of-expression information for characterized distal enhancers overlapping clade-specific peaks at 6-8hrs (a) and 10-12hrs (b) of development. Each column represents a different clade and each row represents an annotation term assigned to tested enhancer elements. Shading indicates the odds-ratio for the intersection of enhancers sharing a given annotation with clade-specific accessible sites. Shown are all categories in the top 10 enrichment of any clade (enrichment scores capped at 15 for display) containing at least 35 known enhancer overlaps.
Extended Data Figure 3. Relationship between transcription factor binding motifs and LSI clade-specific accessibility.
a-c, SeqGL was run on LSI clade-specific distal peaks at each time point to identify enriched sequence motifs. The top 5 most enriched unique motifs for each clade are displayed. Colored circles indicate which clade is represented by each line. For the later time points (6-8hrs and 10-12hrs), blue is neurogenic ectoderm, yellow is non-neurogenic ectoderm, red is myogenic mesoderm, and green is mesendoderm. The results show an enrichment of motifs for factors associated with early development at 2-4hrs with more tissue-specific factor motifs (e.g. mesodermal factor Mef2 or neural regulator Tramtrack (ttk)) within germ-layer annotated clades at later stages of development. d-l, Using ChIP occupancy data (peaks) and transcription factor binding motifs compiled previously16, we scanned for all TF motif instances under ChIP peaks from datasets spanning 6-8hrs of development using FIMO. Aggregate read counts in 4kb windows centered on each identified motif instance is shown for each of the four LSI clades at 6-8hrs. Green is endoderm, red is myogenic mesoderm, yellow is non-neurogenic ectoderm, and blue is neurogenic ectoderm. 95% confidence intervals are indicated by light shading of the same colors. d-g, Aggregate plots for four ubiquitous transcription factors (BEAF32, CTCF, Pho, and Trl) at 6-8hrs. h-l, Aggregate plots for mesodermal transcription factors (Bap, Lmd, Mef2, Tin, Twi) at 6-8hrs.
Extended Data Figure 4. Similarities and differences in accessibility across all three time points.
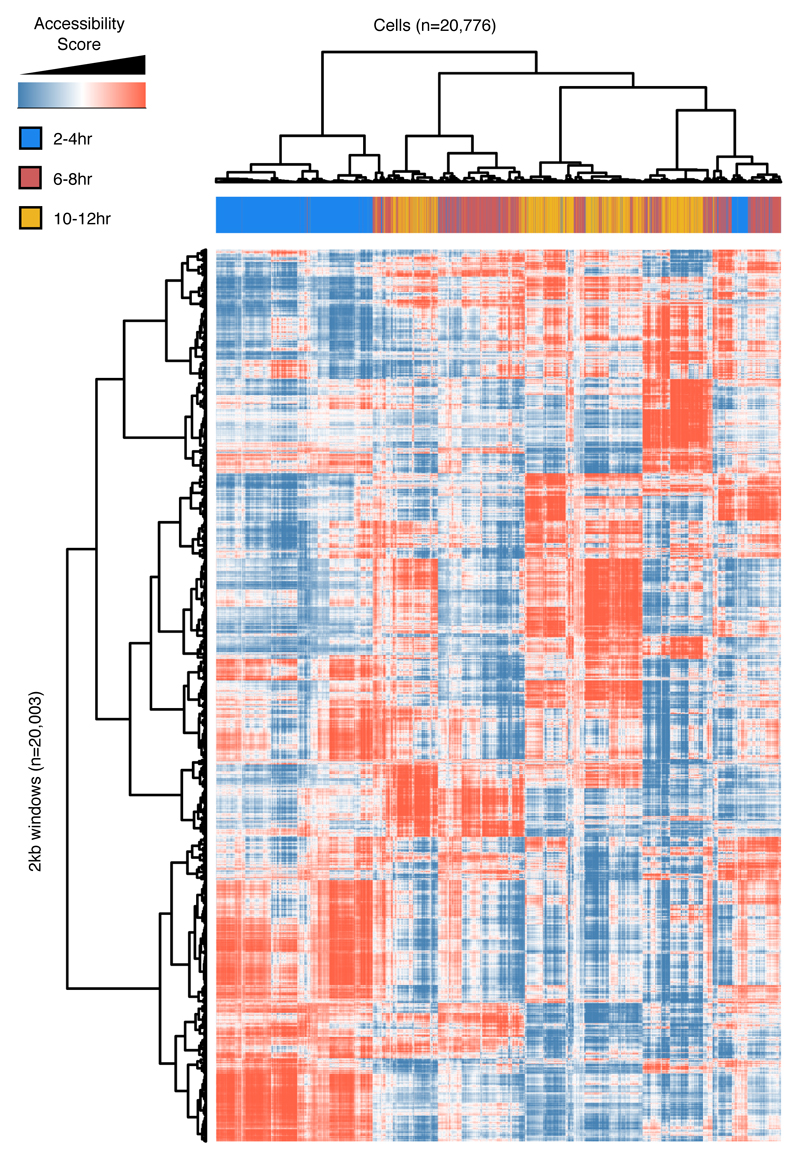
In addition to processing data from each time point independently, data from all cells can be analyzed together (with the caveat that time point and batch are confounded). Here, we show binarized, LSI-transformed, and clustered count data for 2 kb windows across the genome for cells from all three time points (blue = 2-4hrs, red = 6-8hrs, orange = 10-12hrs) processed together. The predominant pattern is one in which 2-4hr cells (blue) cluster separately from 6-8 hr (red) and 10-12 hr (yellow) cells. 6-8hrs and 10-12hrs cells are intermingled, clustering first (roughly) by germ layer-of-origin.
Extended Data Figure 5. Sex of individual cells identified by ratio of X:autosomal reads.
Embryos at all stages consist of a mixture of male and female embryos (males: XY, females: XX). a, t-SNE plots of three time points from analysis in which sex chromosome sites were not excluded. Many clusters exhibited a “bi-lobed” structure, where each individual cluster was made up of two “mirrored” lobes (red circles identify one example of bi-lobed clusters from each time point). This was most apparent at the 10-12hr time point. b, Histogram of the ratio of chromosome X to autosomal reads in individual cells. To explore whether this “bi-lobed” structure was a function of sex biases in clustering, we attempted to sex individual cells. The ratio of X:autosomal reads shows a bimodal distribution as expected in a system with heterogametic (XY) males and no evidence for imprinting. The purple line marks the local minimum between the two peaks of the histograms. c, Initial t-SNE clusters colored by sex assignment. Red indicates female cells and blue indicates male cells. Coloring individual cells by their sex reveals that the “bi-lobed” architecture is largely driven by sex biases in clustering. d, After removing X chromosomal reads, data was re-clustered and individual cells recolored by the ratio of X:autosomal reads (red: female, blue: male). The resulting clusters showed an approximately equal number of male and female cells except for clusters 1 and 10 at the 2-4hr time point.
Extended Data Figure 6. Temporal ordering of cells at 2-4hrs using Monocle.
a-c, t-SNE maps of cells at 2-4hrs with the color representing either the Monocle-inferred pseudotime of each cell (a) or the ratio of reads per cell at enhancers active at different stages of development (b,c). Read counts within temporally characterized enhancers provide insight into the specific stage of development from which a cell is derived. Plotted here are ratios of counts in earlier vs. later active enhancers showing a rough temporal progression from left to right that is also inferred by Monocle. d-f, Heatmaps of sites significantly associated with pseudotime (based on a likelihood ratio test). For each site, a spline was fit to the data across pseudotime. Sites (rows) were ordered for the heatmaps based on the pseudotime at which they first reached half the maximum predicted accessibility from the fit curve. The colors indicate the spline predicted accessibility across pseudotime scaled as fraction of the maximum accessibility for that site. g-i, Single locus plots of the most significant closing, opening, and transient sites. Histogram of percent of cells with the specified site accessible in 10 bins across pseudotime, within the 2-4hr time-point. Curve is from spline fit for accessibility in cells through pseudotime. j-l, As in (g-i), examples of sites with lineage-specific association with pseudotime. One example of a branch-specific opening site for each germ layer: ectoderm (j), endoderm (k), and mesoderm (l). In (g-i), P-values were calculated for likelihood ratio tests evaluating the effect of progress through pseudotime on accessibility (N = 100 bins of cells). See Methods for more details. Note that the branch point in pseudotime occurs at approximately 5.6 on the x-axis of these figures.
Extended Data Figure 7. Library complexity and fraction of X chromosome reads highlights clusters of ‘collisions’ between cells from different tissues.
Density plots of the estimated library complexity (using the same equation implemented in Picard; left panels) and the representation of chromosome X reads (right panels) in individual clusters. While most of the clusters defined by t-SNE are readily biologically interpretable, a small number of clusters (containing relatively few cells) were not easily characterized and are marked by an increase in both estimated library complexity and an unusual distribution of X-chromosome to autosomal reads. These clusters likely correspond to be clusters of “collisions” - cases in which two or more distinct cells share the same barcode as a consequence of the combinatorial indexing protocol. In each panel, the black line is the global distribution for all cells in that time point. The gray lines denote the results of randomly sampling an equal number of cells to the cluster in question. The colored line marks the distribution for the cluster being interrogated. a, c, e, Most clusters show relatively similar distributions of library complexity (left) and a characteristic, bimodal distribution among cells in the ratio of X chromosome to autosomal reads (reflecting our use of a pool of male (XY) and female (XX) embryos, right). b, d, Putative collision clusters show a clear increase in the average library complexity (left) and a unimodal rather than bimodal distribution of X:autosomal reads (right). f, These features are not universally diagnostic (e.g. cluster 10 at 2-4hrs does seem to show a strong, bona fide sex bias), but the combination of features is strongly predictive of clusters containing few cells and conflicting biological annotations based on gene/enhancer overlaps.
Extended Data Figure 8. LSI defined clades and t-SNE clusters show strong correspondence.
Shown are t-SNE maps of cells from each of the three time points colored by the LSI clade to which they were previously assigned (Fig. 1a-c). For the post-gastrulation time points, green is endoderm, red is myogenic mesoderm, yellow is non-neurogenic ectoderm, and blue is neurogenic ectoderm. There is strong correspondence between the germ layer level clade annotations from the LSI analysis with tissue-specific t-SNE clusters, particularly at the post-gastrulation time points (6-8hrs and 10-12hrs).
Extended Data Figure 9. Cell cluster assignment is similar using either enhancer or gene tissue activity.
For each time point, cell clusters were annotated based on first dividing peaks into TSS-distal peaks (putative enhancers) and TSS-proximal (gene promoters). Each cell cluster was then annotated separately by overlaps between cluster-enriched peaks and (1) enhancers, comparing the TSS-distal elements to the tissue/cell type activity of characterized enhancers, (2) genes, comparing TSS-proximal elements to the tissue expression of genes, and (3) Gene Ontology (GO) information (Methods). Shown are the cluster assignments based on enhancer, gene expression, or Gene Ontology annotation alone. The final assignment, used within the main figures, combines all enrichment information to produce more robust assignments.
Extended Data Figure 10. sci-ATAC-seq can predict tissue-specific enhancer usage during development.
All candidate clade-specific enhancers tested in transgenic reporters. For each time point, upper panels show single cells visualized by t-SNE with the intensity of blue representing the number of sci-ATAC-seq reads obtained from each tested element in each individual cell. Cell clusters bounded by dashed lines correspond to the predicted clade of activity. Lower panels show representative embryos for each time point with nuclei stained with DAPI (grey), in situ hybridization for the reporter gene driven by the enhancer (yellow), and a tissue marker (magenta). Annotation of each element’s activity involved observations across hundreds of embryos.
Supplementary Material
Acknowledgements
This work was technically supported by the EMBL Advanced Light Microscopy, Genomics, and Flow Cytometry Facilities. We thank D. Prunkard and L. Gitari in the UW-Pathology Flow Cytometry Facility for their exceptional sorting assistance. We thank all members of the Furlong and Shendure laboratories for discussions and comments. This work was financially supported by BMBF (TransDiag-2) funds to EEF, and NIH (DP1HG007811 and R01HG006283) and the Paul G. Allen Family Foundation funds to JS. DAC was partly supported by T32HL007828 from the National Heart, Lung, and Blood Institute. JS is a Howard Hughes Medical Institute Investigator.
Footnotes
Author Contributions
DAC, JPR, DAG, JS and EEF designed the study, explored results and prepared the manuscript, with contributions from all authors. DAC and RD developed and optimized sci-ATAC-seq, with assistance from LC and FJS. JPR and DAG led sample preparation and biological validations, with assistance from RMF. DAC, JPR and DAG led data analysis with assistance on specific analyses from DA, HP, CT and XQ. LC and FJS have competing financial interests in the form of stock ownership and paid employment by Illumina, Inc. JS and EEF supervised the study.
References
- 1.Cusanovich DA, et al. Multiplex single cell profiling of chromatin accessibility by combinatorial cellular indexing. Science. 2015;348:910–914. doi: 10.1126/science.aab1601. [DOI] [PMC free article] [PubMed] [Google Scholar]
- 2.Maduro MF, Meneghini MD, Bowerman B, Broitman-Maduro G, Rothman JH. Restriction of mesendoderm to a single blastomere by the combined action of SKN-1 and a GSK-3beta homolog is mediated by MED-1 and -2 in C. elegans. Mol Cell. 2001;7:475–485. doi: 10.1016/s1097-2765(01)00195-2. [DOI] [PubMed] [Google Scholar]
- 3.Sethi AJ, Wikramanayake RM, Angerer RC, Range RC, Angerer LM. Sequential signaling crosstalk regulates endomesoderm segregation in sea urchin embryos. Science. 2012;335:590–593. doi: 10.1126/science.1212867. [DOI] [PMC free article] [PubMed] [Google Scholar]
- 4.Rodaway A, Patient R. Mesendoderm. an ancient germ layer? Cell. 2001;105:169–172. doi: 10.1016/s0092-8674(01)00307-5. [DOI] [PubMed] [Google Scholar]
- 5.Thomas S, et al. Dynamic reprogramming of chromatin accessibility during Drosophila embryo development. Genome Biol. 2011;12:R43. doi: 10.1186/gb-2011-12-5-r43. [DOI] [PMC free article] [PubMed] [Google Scholar]
- 6.Bonn S, et al. Tissue-specific analysis of chromatin state identifies temporal signatures of enhancer activity during embryonic development. Nat Genet. 2012;44:148–156. doi: 10.1038/ng.1064. [DOI] [PubMed] [Google Scholar]
- 7.Kvon EZ, et al. Genome-scale functional characterization of Drosophila developmental enhancers in vivo. Nature. 2014;512:91–95. doi: 10.1038/nature13395. [DOI] [PubMed] [Google Scholar]
- 8.Gallo SM, et al. REDfly v3.0: toward a comprehensive database of transcriptional regulatory elements in Drosophila. Nucleic Acids Res. 2011;39:D118–123. doi: 10.1093/nar/gkq999. [DOI] [PMC free article] [PubMed] [Google Scholar]
- 9.Frise E, Hammonds AS, Celniker SE. Systematic image-driven analysis of the spatial Drosophila embryonic expression landscape. Mol Syst Biol. 2010;6:345. doi: 10.1038/msb.2009.102. [DOI] [PMC free article] [PubMed] [Google Scholar]
- 10.Tomancak P, et al. Systematic determination of patterns of gene expression during Drosophila embryogenesis. Genome Biol. 2002;3 doi: 10.1186/gb-2002-3-12-research0088. RESEARCH0088. [DOI] [PMC free article] [PubMed] [Google Scholar]
- 11.Bonn S, et al. Cell type-specific chromatin immunoprecipitation from multicellular complex samples using BiTS-ChIP. Nat Protoc. 2012;7:978–994. doi: 10.1038/nprot.2012.049. [DOI] [PubMed] [Google Scholar]
- 12.Doe CQ. Temporal Patterning in the Drosophila CNS. Annu Rev Cell Dev Biol. 2017;33:219–240. doi: 10.1146/annurev-cellbio-111315-125210. [DOI] [PubMed] [Google Scholar]
- 13.Ciglar L, Furlong EE. Conservation and divergence in developmental networks: a view from Drosophila myogenesis. Curr Opin Cell Biol. 2009;21:754–760. doi: 10.1016/j.ceb.2009.10.001. [DOI] [PubMed] [Google Scholar]
- 14.Spahn P, et al. Multiple regulatory safeguards confine the expression of the GATA factor Serpent to the hemocyte primordium within the Drosophila mesoderm. Dev Biol. 2014;386:272–279. doi: 10.1016/j.ydbio.2013.12.012. [DOI] [PubMed] [Google Scholar]
- 15.Reuter R. The gene serpent has homeotic properties and specifies endoderm versus ectoderm within the Drosophila gut. Development. 1994;120:1123–1135. doi: 10.1242/dev.120.5.1123. [DOI] [PubMed] [Google Scholar]
- 16.Cannavo E, et al. Genetic variants regulating expression levels and isoform diversity during embryogenesis. Nature. 2017;541:402–406. doi: 10.1038/nature20802. [DOI] [PubMed] [Google Scholar]
- 17.v d Maaten LJP, Hinton GE. Visualizing High-Dimensional Data Using t-SNE. Journal of Machine Learning Research. 2008:2579–2605. [Google Scholar]
- 18.Rodriguez A, Laio A. Machine learning. Clustering by fast search and find of density peaks. Science. 2014;344:1492–1496. doi: 10.1126/science.1242072. [DOI] [PubMed] [Google Scholar]
- 19.Qiu X, et al. Reversed graph embedding resolves complex single-cell developmental trajectories. bioRxiv. 2017 doi: 10.1101/110668. [DOI] [PMC free article] [PubMed] [Google Scholar]
- 20.Lecuit T, Samanta R, Wieschaus E. slam encodes a developmental regulator of polarized membrane growth during cleavage of the Drosophila embryo. Dev Cell. 2002;2:425–436. doi: 10.1016/s1534-5807(02)00141-7. [DOI] [PubMed] [Google Scholar]
- 21.Beiman M, Shilo BZ, Volk T. Heartless, a Drosophila FGF receptor homolog, is essential for cell migration and establishment of several mesodermal lineages. Genes Dev. 1996;10:2993–3002. doi: 10.1101/gad.10.23.2993. [DOI] [PubMed] [Google Scholar]
- 22.Okumura T, Matsumoto A, Tanimura T, Murakami R. An endoderm-specific GATA factor gene, dGATAe, is required for the terminal differentiation of the Drosophila endoderm. Dev Biol. 2005;278:576–586. doi: 10.1016/j.ydbio.2004.11.021. [DOI] [PubMed] [Google Scholar]
- 23.Clark HF, et al. Dachsous encodes a member of the cadherin superfamily that controls imaginal disc morphogenesis in Drosophila. Genes Dev. 1995;9:1530–1542. doi: 10.1101/gad.9.12.1530. [DOI] [PubMed] [Google Scholar]
- 24.Simcox AA, Sang JH. When does determination occur in Drosophila embryos? Dev Biol. 1983;97:212–221. doi: 10.1016/0012-1606(83)90078-7. [DOI] [PubMed] [Google Scholar]
- 25.Tingvall TO, Roos E, Engstrom Y. The GATA factor Serpent is required for the onset of the humoral immune response in Drosophila embryos. Proc Natl Acad Sci U S A. 2001;98:3884–3888. doi: 10.1073/pnas.061230198. [DOI] [PMC free article] [PubMed] [Google Scholar]
- 26.Cao J, et al. Comprehensive single-cell transcriptional profiling of a multicellular organism. Science. 2017;357:661–667. doi: 10.1126/science.aam8940. [DOI] [PMC free article] [PubMed] [Google Scholar]
- 27.McKenna A, et al. Whole-organism lineage tracing by combinatorial and cumulative genome editing. Science. 2016;353 doi: 10.1126/science.aaf7907. aaf7907. [DOI] [PMC free article] [PubMed] [Google Scholar]
- 28.Raj B, et al. Simultaneous single-cell profiling of lineages and cell types in the vertebrate brain by scGESTALT. bioRxiv. 2017 doi: 10.1101/205534. [DOI] [PMC free article] [PubMed] [Google Scholar]
- 29.Karaiskos N, et al. The Drosophila embryo at single-cell transcriptome resolution. Science. 2017;358:194–199. doi: 10.1126/science.aan3235. [DOI] [PubMed] [Google Scholar]
- 30.Frieda KL, et al. Synthetic recording and in situ readout of lineage information in single cells. Nature. 2017;541:107–111. doi: 10.1038/nature20777. [DOI] [PMC free article] [PubMed] [Google Scholar]
- 31.Tomancak P, et al. Global analysis of patterns of gene expression during Drosophila embryogenesis. Genome Biol. 2007;8:R145. doi: 10.1186/gb-2007-8-7-r145. [DOI] [PMC free article] [PubMed] [Google Scholar]
- 32.Hammonds AS, et al. Spatial expression of transcription factors in Drosophila embryonic organ development. Genome Biol. 2013;14:R140. doi: 10.1186/gb-2013-14-12-r140. [DOI] [PMC free article] [PubMed] [Google Scholar]
- 33.Sandmann T, Jakobsen JS, Furlong EE. ChIP-on-chip protocol for genome-wide analysis of transcription factor binding in Drosophila melanogaster embryos. Nat Protoc. 2006;1:2839–2855. doi: 10.1038/nprot.2006.383. [DOI] [PubMed] [Google Scholar]
- 34.Buenrostro JD, Giresi PG, Zaba LC, Chang HY, Greenleaf WJ. Transposition of native chromatin for fast and sensitive epigenomic profiling of open chromatin, DNA-binding proteins and nucleosome position. Nat Methods. 2013;10:1213–1218. doi: 10.1038/nmeth.2688. [DOI] [PMC free article] [PubMed] [Google Scholar]
- 35.Amini S, et al. Haplotype-resolved whole-genome sequencing by contiguity-preserving transposition and combinatorial indexing. Nat Genet. 2014;46:1343–1349. doi: 10.1038/ng.3119. [DOI] [PMC free article] [PubMed] [Google Scholar]
- 36.Langmead B, Salzberg SL. Fast gapped-read alignment with Bowtie 2. Nat Methods. 2012;9:357–359. doi: 10.1038/nmeth.1923. [DOI] [PMC free article] [PubMed] [Google Scholar]
- 37.Fraley C, Raftery AE. Model-based Clustering, Discriminant Analysis and Density Estimation. Journal of the American Statistical Association. 2002:611–631. [Google Scholar]
- 38.Fraley C, Raftery AE, Murphy TB, Scrucca L. Version 4 for R: Normal Mixture Modeling for Model-Based Clustering, Classification, and Density Estimation Technical Report No. 597. Department of Statistics, University of Washington. 2012 [Google Scholar]
- 39.Zhang Y, et al. Model-based analysis of ChIP-Seq (MACS) Genome Biol. 2008;9:R137. doi: 10.1186/gb-2008-9-9-r137. [DOI] [PMC free article] [PubMed] [Google Scholar]
- 40.Quinlan AR, Hall IM. BEDTools: a flexible suite of utilities for comparing genomic features. Bioinformatics. 2010;26:841–842. doi: 10.1093/bioinformatics/btq033. [DOI] [PMC free article] [PubMed] [Google Scholar]
- 41.Trapnell C, et al. The dynamics and regulators of cell fate decisions are revealed by pseudotemporal ordering of single cells. Nat Biotechnol. 2014;32:381–386. doi: 10.1038/nbt.2859. [DOI] [PMC free article] [PubMed] [Google Scholar]
- 42.Setty M, Leslie CS. SeqGL Identifies Context-Dependent Binding Signals in Genome-Wide Regulatory Element Maps. PLoS Comput Biol. 2015;11:e1004271. doi: 10.1371/journal.pcbi.1004271. [DOI] [PMC free article] [PubMed] [Google Scholar]
- 43.Ghandi M, Lee D, Mohammad-Noori M, Beer MA. Enhanced regulatory sequence prediction using gapped k-mer features. PLoS Comput Biol. 2014;10:e1003711. doi: 10.1371/journal.pcbi.1003711. [DOI] [PMC free article] [PubMed] [Google Scholar]
- 44.Grant CE, Bailey TL, Noble WS. FIMO: scanning for occurrences of a given motif. Bioinformatics. 2011;27:1017–1018. doi: 10.1093/bioinformatics/btr064. [DOI] [PMC free article] [PubMed] [Google Scholar]
- 45.v d Maaten LJP. Accelerating t-SNE using Tree-Based Algorithms. Journal of Machine Learning Research. 2014:3221–3245. [Google Scholar]
- 46.Krijthe JH. Rtsne: T-Distributed Stochastic Neighbor Embedding using a Barnes-Hut Implementation. 2015 [Google Scholar]
- 47.Pliner H, et al. Chromatin accessibility dynamics of myogenesis at single cell resolution. bioRxiv. 2017 doi: 10.1101/155473. [DOI] [Google Scholar]
- 48.Rubin GM, Spradling AC. Genetic transformation of Drosophila with transposable element vectors. Science. 1982;218:348–353. doi: 10.1126/science.6289436. [DOI] [PubMed] [Google Scholar]
- 49.Bischof J, Maeda RK, Hediger M, Karch F, Basler K. An optimized transgenesis system for Drosophila using germ-line-specific phiC31 integrases. Proc Natl Acad Sci U S A. 2007;104:3312–3317. doi: 10.1073/pnas.0611511104. [DOI] [PMC free article] [PubMed] [Google Scholar]
- 50.Furlong EE, Andersen EC, Null B, White KP, Scott MP. Patterns of gene expression during Drosophila mesoderm development. Science. 2001;293:1629–1633. doi: 10.1126/science.1062660. [DOI] [PubMed] [Google Scholar]
- 51.Schindelin J, et al. Fiji: an open-source platform for biological-image analysis. Nat Methods. 2012;9:676–682. doi: 10.1038/nmeth.2019. [DOI] [PMC free article] [PubMed] [Google Scholar]
- 52.Li H, Durbin R. Fast and accurate short read alignment with Burrows-Wheeler transform. Bioinformatics. 2009;25:1754–1760. doi: 10.1093/bioinformatics/btp324. [DOI] [PMC free article] [PubMed] [Google Scholar]
- 53.Girardot C, Scholtalbers J, Sauer S, Su SY, Furlong EE. Je, a versatile suite to handle multiplexed NGS libraries with unique molecular identifiers. BMC Bioinformatics. 2016;17:419. doi: 10.1186/s12859-016-1284-2. [DOI] [PMC free article] [PubMed] [Google Scholar]
Associated Data
This section collects any data citations, data availability statements, or supplementary materials included in this article.
Supplementary Materials
Data Availability Statement
All raw ATAC-seq and DNase-seq data are available through GEO (accession GSE101581) and ArrayExpress (E-MTAB-5999). BigWig files for coverage within each clade, regions of accessibility (peak calls), and a master list of all potential regulatory elements (Table S1) will be made available on the Furlong lab web page http://furlonglab.embl.de/data. To make the data easily accessible we have generated a searchable html where users can select a t-SNE cluster or genomic locus of interest and visualize the data throughout the genome (http://shiny.furlonglab.embl.de/scATACseqBrowser/) and site-by-cell matrices and vignettes to facilitate further exploration of the data (http://atlas.gs.washington.edu).


