

Abstract
Vitamin A deficiency (A-) is a worldwide public health problem. To better understand how vitamin A status influences gut microbiota and host metabolism, we systematically analyzed urine, cecum, serum, and liver samples from vitamin A sufficient (A+) and deficient (A-) mice using 1H NMR-based metabolomics, quantitative (q)PCR, and 16S rRNA gene sequencing coupled with multivariate data analysis. The microbiota in the cecum of A− mice showed compositional as well as functional shifts compared to the microbiota from A+ mice. Targeted 1H NMR analyses revealed significant changes in microbial metabolite concentrations including higher butyrate and hippurate and decreased acetate and 4-hydroxyphenylacetate in A+ relative to A− mice. Bacterial butyrate-producing genes including butyryl-CoA:acetate CoA-transferase and butyrate kinase were significantly higher in bacteria from A+ versus bacteria from A− mice. A− mice had disturbances in multiple metabolic pathways including alterations in energy (hyperglycemia, glycogenesis, TCA cycle, and lipoprotein biosynthesis), amino acid, and nucleic acid metabolism. A− mice had hyperglycemia, liver dysfunction, changes in bacterial metabolism, and altered gut microbial communities. Moreover, integrative analyses indicated a strong correlation between gut microbiota and host energy metabolism pathways in the liver. Vitamin A regulates host and bacterial metabolism and the result includes alterations in energy homeostasis.
Keywords: Vitamin A, microbiota, short chain fatty acids, diabetes, metabolomics
1. Introduction
Vitamin A deficiency is a public health problem, especially in developing countries where the diets are low in sources of vitamin A [1]. Vitamin A deficiency results in night blindness and permanent blindness if not corrected. The World Health Organization estimates that 250,000 to 500,000 vitamin A deficient (A-) children in developing countries become blind every year, half of them dying within 12 months of losing their sight [1, 2]. Vitamin A supplementation has been shown to decrease all-cause mortality in children in part by reducing the incidence and severity of respiratory and gastrointestinal infection [3, 4]. The protective effects of vitamin A in developing countries are attributed to the role of vitamin A in immune function and protection from infection.
A population of between 500 and 1000 different bacterial species inhabit the human gut [5]. The metagenome—the combined genomic content of the intestinal flora—can rapidly vary as a function of diet, location, host genetics and a variety of other factors. Studies have shown that the gut microbiota are essential for normal immune system development, displacement of pathogens, and extraction of additional energy, e.g., short chain fatty acids (SCFAs) from otherwise non-digestible dietary substrates [6, 7]. The composition of the gut microbiota play a critical role in determining health versus disease in the gastrointestinal tract and extra-intestinal tissues [8]. Two groups of bacteria, Firmicutes and Bacteroidetes, represent more than 80% of the bacterial phyla found in the mouse cecum [9]. Increased Firmicutes to Bacteroidetes ratios are associated with many diseases including diabetes [11]. The increased Firmicutes to Bacteroidetes ratio results in higher fermentation that represents a host-mediated adaptive response to limit energy uptake/storage [13, 14]. Butyrate is an important metabolite produced by gut microbial fermentation of dietary fiber [15, 16]. Butyrate induces regulatory T cells that maintain homeostasis in the gut [17] and colonocytes utilize butyrate as an energy source locally in the gastrointestinal tract [18]. Microbial community composition and the resulting microbial metabolism regulate health and disease of the host.
Vitamin A deficiency affects the composition of the microbiota in mice [19, 20] and humans [21]. Short term vitamin A deficiency in mice had large effects on the bacterial community structure and metatranscriptome in mice [20]. Bacteroides vulgatus rapidly increased in mice following withdrawal of vitamin A from the diet for only 3 wks [20]. A− children had less microbial diversity in their gut microbiota and persistent diarrhea compared to vitamin A sufficient (A+) control children [21]. A− children had fewer of the butyrate producing Clostridia sp. in the feces compared to A+ children [21]. The microbiota in the A− host is different than the A+ host.
In the present study, a combination of 16S rRNA gene sequencing, qPCR, and 1H NMR-based metabolomics was done in mice that were raised A+ and A− throughout gestation and continuing through adulthood (12 wks). The data show that there are important changes in host and bacterial metabolism when comparing A+ and A− mice. Several of the effects of vitamin A on metabolites in the liver correlated with shifts in the microbiota. The data point to a complex effect of vitamin A to indirectly regulate microbial and host metabolism via shifts in the microbiota.
2. Materials and Methods
2.1. Animal experiment and samples collection
Experimental procedures were approved by the Office of Research Protection Institutional Animal Care and Use Committee at The Pennsylvania State University (University Park, PA). C57BL/6J mice were originally obtained from the Jackson Laboratory (Bar Harbor, MN) and bred at Pennsylvania State University. A+ and A− mice were generated as previously described [22, 23]. From a single stock of breeding A+ mice, A− and A+ females are separated from the A+ males in their 2nd wk of gestation [22, 23]. At weaning the A+ and A− weanling mice are continued on the same diet as their mothers [22, 23]. A+ mice were fed the A− diet, which contained 25 μg of retinyl acetate as their source of vitamin A. Because of the effects of sex hormones and estrous cycle on the microbiota only male mice were used for these experiments. Two different A+ and A− litters from different mothers were used in this study. Serum retinol levels were measured by UPLC-MS at 7 wks of age. A− mice gradually become vitamin A deficient so that at 7wks of age there is a significant difference in serum retinol (Fig. 1). All samples were snap frozen with liquid nitrogen and stored at −80 °C until further analysis.
Fig. 1. Effect of vitamin A deficiency on serum retinol and body weight.

(A) Serum retinol analysis and (B) body weight of A+ and A− mice. Values are the mean ± SD of n = 6 mice per group, *p < 0.05, **p < 0.01.
2.2. Glucose tolerance test (GTT) and insulin tolerance test (ITT)
Glucose and insulin tolerance were done as previously described and following a 14–15h overnight fast [24]. Briefly, GTT was measured following intraperitoneal injection of 20% glucose (2.0 g/kg body weight). ITT was performed with an intraperitoneal injection of human insulin (Humulin® Eli Lilly, USA, 1 U/kg body weight) and blood glucose was measured. Blood glucose concentrations were measured using AlphaTRAK whole-blood glucose monitor (Abbott Diabetes Care, Inc., Alameda, CA).
2.3. 1H NMR spectroscopy
Sample preparations for serum, urine, cecal content, and liver extraction were performed as previously described [25]. Ad libitum fed mice were the source of the samples for these metabolomics analyses. 1H NMR spectra were recorded at 298 K on a Bruker Avance III 600 MHz spectrometer equipped with an inverse cryogenic probe (Bruker Biospin, Germany). NMR spectra of all the liver, urine, and cecal content samples were acquired for each employing the first increment of NOESY pulse sequence. For accurate quantification of SCFAs, a delay was added in the addition to RD in the sequence of cecal content samples [26]. For serum, the water presaturation was acquired with a Carr-Purcell-Meiboom-Gill pulse sequence [recycle delay-90°-(τ-180°-τ)n-acquisition]. For NMR signal assignment purposes, a series of two dimensional (2D) NMR spectra were acquired for selected samples (for more detailed methods, see Supplemental Material, “1H NMR Spectroscopy”).
The representative 1H NMR spectra of mice serum, urine, cecal content, and liver extract are illustrated in Supplementary (S)Fig. 1. The metabolites were assigned on the basis of published results [27–29] and further confirmed with 2D NMR spectra and existing databases, such as the Human Metabolome Data Base (HMDB: http://www.hmdb.ca/) (STable 1). Serum and liver extract spectra were dominated by amino acids, lipids, glucose, glycogen, 3- hydroxybutyrate (3HB), succinate, citrate, choline-containing compounds, and nucleoside metabolites (SFig. 1A and 1D). The urine spectra were composed of tricarboxylic cycle (TCA) intermediate metabolites and gut microbial-host cometabolites including hippurate, phenylacetylglycine, and 4-hydroxyphenylacetate (SFig. 1B). The cecal content profiles were characterized by bile acids, glucose, lactate, succinate, amino acids, and SCFAs (acetate, propionate and butyrate) (SFig. 1C).
2.4. NMR data processing and multivariate data analysis
1H NMR spectra were corrected for phase- and baseline-distortions, and the spectral region δ 0.50–9.50 was integrated into bins with equal width of 0.004 ppm (2.4 Hz) using AMIX package (V3.8, Bruker Biospin). Multivariate data analysis including principal component analysis (PCA) and orthogonal projection to latent structure (OPLS)-discriminant analysis (DA) were carried out with the software package SIMCA-P+ (version 13.0, Umetrics, Sweden). The quality of OPLSDA models was assessed by the R2X representing the total explained variations and Q2 indicating the model predictability. The significance validity of OPLS-DA models was further tested with CV-ANOVA approach (with p < 0.05) [30]. The loading plots from the OPLS-DA with colorcoded correlation coefficient for variables (or metabolites) was performed using an in-house developed script for MATLAB (The Mathworks Inc.; Natwick, MA). The quantification of each SCFA in the cecum was calculated by NMR peak area against an internal standard sodium 3- trimethylsilyl [2,2,3,3-d4] propionate (TSP-d4). The amounts of hippurate, phenylacetylglycine, and 4-hydroxyphenylacetate were determined relative to creatinine samples (for more detailed methods, see Supplemental Material, “NMR data processing and multivariate data analysis”). All metabolic data is available (pending link/number).
2.5. DNA extraction and quantitative real-time polymerase chain reaction (qRT-PCR)
DNA was extracted from the cecal contents using E.Z.N.A. ® stool DNA kit (omega, USA) according to the manufacture’s protocol. Bacteria were analyzed by qPCR using primers targeted at 16S ribosomal DNA of Firmicutes, Bacteroidetes, Actinobacteria, γProteobacteria, and Clostridium ramosum [31–33]. Two major bacterial butyrate-producing genes including butyryl- CoA:acetate CoA-transferase (but) and butyrate kinase (buk) were also quantified [34, 35]. All primer sets and PCR conditions used are listed in STable 2. qPCR assays were carried out using SYBR Green qPCR Master Mix on an StepOnePlus™ Real-Time PCR system (Thermo Fisher Scientific). The results were normalized to 16S ribosomal (universal) DNA sequences (for bacteria) [31] or rpoB gene levels (for bacterial genes) [36] and expressed as the relative difference using the ΔΔCT method.
2.6. 16S rRNA gene sequencing of the microbiota
The extracted bacterial DNA was amplified using the V4V4 primer set. The verification of the PCR product was demonstrated through 1% agarose gel electrophoresis and checked using a DNA 7500LabChip on the Agilent 2100 Bioanalyzer (Agilent Technologies). 16S rDNA sequencing was performed using the Illumina MiSeq platform by the Geomics Core Facility (The Pennsylvania State University). Data analysis was performed using the mothur software package [37] and aligned with the Green Genes and SILVA databases. A biom file was created (using the Green Genes databases) and uploaded onto the Huttenhower galaxy page as described previously [38]. Phylogenic Investigation of Communities by Reconstruction of Unobserved States (PICRUSt) analysis was done by the biom file [39] and the resulting biom file was split and analyze with HMP Unified Metabolic Analysis Network 2 (HUMAnN2) software [40]. The resulting abundance files were combined and ordered based on pathway description and coverage, in order to produce a summary of pathway abundance values for each sample. All data have been deposited in NCBI’s Sequence Read Archive under the accession number PRJNA396560.
A Pearson correlation analysis was used to investigate the relationships between bacterial populations and metabolite levels between A+ and A− mice. Statistical significance was determined by transforming the Pearson r value into t value and then using t distributions to find the P value. The equation used to find the statistical significant cutoff was , where r is the correlation value and n is the number of subjects. In this experiment, correlation values above 0.61 or below −0.61 were chosen based on the discrimination significance.
2.7. Statistics
All values are the means ± standard deviations (SD). Graphical illustrations and statistical analysis were performed using GraphPad Prism (v 6.0, GraphPad). Student’s t-test with Mann- Whitney tests were performed and p < 0.05 was the cut-off for significance.
3. Results
3.1. Reduced weight and changes in the microbiota of A− mice
Mice become increasingly deficient in vitamin A overtime and by 7 wks of age the A− mice had significantly lower serum retinol compared to A+ mice (Fig. 1A). Weight was not different between A+ and A− mice that were 6 or 7 wks of age but by 8 wks the A+ mice weighed significantly more than the A− mice (Fig. 1B). Generalized Unifrac plot of 16S rRNA gene sequencing showed distinct clustering of the cecal microbiota from 12 wk old A+ and A− mice (Fig. 2A). The microbiota in the A− cecum had significantly lower numbers of Bacteroidetes phyla members than A+ cecum (Fig. 2B and SFig. 2). The ratio of Firmicutes/Bacteriodetes was lower in the A+ cecum than the A− cecum (Fig. 2B). In addition, there were several class, family and genus level differences between the A+ and A− cecal microbiota (Fig. 2C). The A+ cecum had higher numbers of bacteria from the genus Clostridium_XVIII, Roseburia, Blautia, Pseudomonas, Parabacteroides, family Pseudomonadaceae, class Bacteroidia, and phyla Bacteroidetes and fewer bacteria from the genus Johnsonella and family Staphylococcaceae compared to A− cecal samples (Fig. 2C). The effects of vitamin A deficiency in mice included reduced serum retinol, lower weights and shifts in the types of bacteria present in the cecum.
Fig. 2. 16S rRNA gene sequencing analysis of the cecal bacteria in A+ and A− mice.
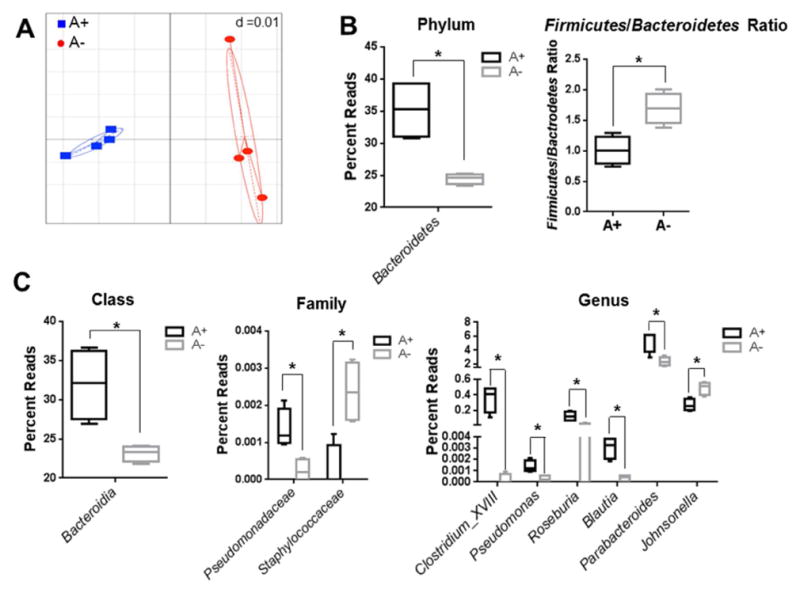
(A) Generalized Unifrac analysis of the total population of microbes from A+ (■) and A− (●) mice. Cecal microbiota in A+ and A− mice: (B) phyla and Firmicutes/Bacteroidetes ratio, (C) class, family and genus reads. Values are the mean ± SD of n = 4 mice per group, *p < 0.05.
3.2. Bacterial metabolites are affected by vitamin A status in mice
Acetate, propionate, and butyrate are the end products of fermentation of dietary fiber by the intestinal microbiota [41]. A+ mice had significantly higher butyrate levels and lower acetate levels in the cecum than A− mice (Fig. 3A). The increase in A+ butyrate levels corresponded to higher numbers of the butyrate-producing bacteria Clostridium ramosum (a member of Clostridium_XVIII) in A+ than A− cecum (Fig. 3B). Bacterial genes associated with butyrate production (but and buk) were higher in the A+ versus A− cecal samples (Fig. 3C). In the urine, several organic acids (hippurate, phenylacetylglycine, and 4-hydroxyphelacetate) are known to be of microbial origin [42]. A+ mice had significantly higher hippurate and lower 4- hydroxyphenylacetate in the urine than A− mice (SFig. 3). A+ mice had more butyrate producing bacteria that resulted in more butyrate than A− mice. In addition, there were differential production of two urinary metabolites of bacterial origin in A+ versus A− mice.
Fig. 3. Butyrate production and the ability to produce butyrate are lower in A− mice.

(A) Acetate, propionate, and butyrate in the cecal contents of A+ and A− mice by 1H NMR analysis. qPCR analysis of (B) Clostridium ramosum and (C) bacterially produced butyryl-CoA:acetate CoA-transferase (but) and butyrate kinase (buk) in the cecum of A+ and A− mice. Values are the mean ± SD of n = 6 mice per group, *p < 0.05.
3.3. Vitamin A deficiency results in altered energy metabolism
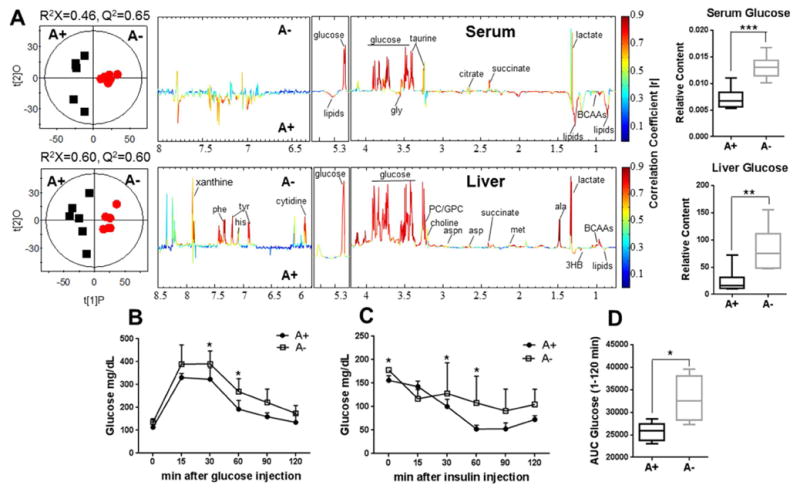
OPLS-DA analyses were carried out on the normalized NMR data collected from serum and liver to maximize the discrimination between A+ and A− mice (Fig. 4A and STable 3). The model quality indicators (serum with Q2 = 0.65 and liver with Q2 = 0.60, Fig. 4A) were significant and further supported with the results from the model evaluation with CV-ANOVA (serum with p = 0.044 and liver with p = 0.027, Fig. 4A). The metabolites in serum and liver extracts that were different in A+ and A− mice were labeled and color-coded (Fig. 4A and STable 3).
Fig. 4. Serum and liver metabolic differences between A+ and A− mice.
(A) OPLS-DA scores plots (left) and coefficient plots (right) derived from 1H NMR spectra of serum and liver extracts from A+ (■) and A− mice (
 ). These models. These models were evaluated with CV-ANOVA for serum with p = 0.044 and liver extracts with p = 0.027. Blood glucose levels following injection of glucose (B) or insulin (C) and (D) the area under the curve (AUC) for panel B. Values are the mean ± SD of n=6 mice per group, *p < 0.05, **p < 0.01, ***p < 0.001. Abbreviations: gly, glycine; ala, alanine; met, methionine; asp, aspartate; aspn, asparagine; tyr, tyrosine; his, histidine; phe, phenylalanine; 3HB, 3-hydroxybutyrate; BCAAs, branched chain amino acids; PC, phosphorylcholine; GPC, glycerophosphorylcholine.
A+ mice had significantly lower amounts of lactate and glucose in serum and liver than Amice (Fig. 4A and STable 3). A+ mice had lower amounts of branched-chain amino acids (BCAAs; valine, leucine and isoleucine), alanine, methionine, aspartate, asparagine, tyrosine, histidine, phenylalanine, succinate, choline, phosphorylcholine (PC), glycerophosphorylcholine (GPC), xanthine, and cytidine in the liver than A− mice (Fig. 4A and STable 3). Conversely, lipids and ketone bodies such as 3HB were higher in A+ than A− liver and serum samples (Fig. 4A and STable 3). In addition, A+ mice had higher BCAAs in serum compared to A− mice (Fig. 4A and STable 3). NMR showed increased levels of glucose in serum and liver of A− mice. Glucose clearance was slower in A− mice (GTT, Fig. 4B) compared to A+ mice and the area under the curve (AUC) for glucose clearance was higher in A− than A+ mice (Fig. 4D). In addition, A+ glucose levels recovered more quickly following insulin injection than A− glucose levels (Fig. 4C). A− mice were hyperglycemic, responded more slowly to insulin injection, had higher levels of several carbohydrates, lower levels of lipid and amino acids than A+ mice.
3.4. Relationship between the gut microbiota and host metabolome in A− mice
To predict the functional pathways active in the microbial communities from the cecal contents of A+ versus A− mice, PICRUSt analysis of the 16S rRNA gene sequencing data was conducted and changes were identified by linear discriminate analysis (LDA; Fig. 5A). The results indicated that vitamin A had a significant effect on bacterial pathways involved in amino acid and carbohydrate metabolism. The bacterial communities from the A+ cecum were enriched for genes important in the biosynthesis of some amino acids including phenylalanine, tyrosine, tryptophan, and lysine (Fig. 5A). Conversely the A− bacterial communities had enhanced carbohydrate and amino acid metabolism (Fig. 5A). Together the data suggest that as a result of host vitamin A deficiency, the microbiota experience alterations in their ability to produce and metabolize amino acids and carbohydrates.
Fig. 5.

(A) Linear discriminant analysis (LDA) of metagenomic pathways expressed in the cecal bacteria. Pathway abundance data were applied to the LDA algorithm with a α = 0.05 threshold for Kruskal-Wallis and pairwise Wilcoxon tests combined with a 2.0 logarithmic LDA cut-off to identify pathway components which most significantly discriminate between the cecal bacterial genes expressed in A+ and A− mice. (B) Heat maps of the correlation between the gut microbiota and liver energy metabolites in the A+ and A− mice. Correlation values above 0.61 or below 0.61 were statistically significant. Values are from n = 4 mice per group.
To strengthen the PICRUSt results and further explore potential relationships between the gut microbiome changes and host metabolome, a correlation matrix was generated using Pearson’s correlation (SFig. 4A–B). Significant correlations were identified between the microbial genre and shifts in the metabolic profiles (r > 0.61 or r < −0.61). The heat maps indicated positive and negative correlations between the levels of host liver metabolites and the relative abundance of the genera present in the cecal microbiome of the A+ mice compared to A− mice. Here, the association between host energy metabolism and genera abundance was the focus of the analysis (Fig. 5B). Of particular note two butyrate producing genera, Clostridium_XVIII and Roseburia, were inversely correlated with the increased levels of glucose, glycogen, BCAAs, and TCA cycle metabolites, and positively correlated with the decreased levels of hepatic lipids and 3HB in A-mice (Fig. 5B). Collectively, the data suggest that alterations in the gut microbiota as a result of vitamin A deficiency contributed to the metabolic profiles in the liver of A+ versus A− mice.
4. Discussion
A− mice had reduced numbers of bacteria from the Bacteroidetes phyla that resulted in a higher Firmicutes/Bacteroidetes ratio compared to A+ mice. Higher Firmicutes/Bacteroidetes ratio have been identified in patients with obesity and diabetes [10, 43]. The effects of vitamin A on the microbiota are likely to be indirect effects of vitamin A on immunity since bacteria have not been reported to respond directly to vitamin A. Here, the shift in Firmicutes to Bacteroidetes ratio in A− mice is likely an effect of vitamin A that induces T reg cells and inhibits IL17 at the mucosal surface to shift bacterial populations [19, 44]. Other significant changes in the microbiota included reductions in Blautia in the A− mice. The Blautia genus are among the most abundant members of the GI tract, ranging from 2.5% to 16% of the total human microbiota and are associated with a healthy gut [45, 46]. Furthermore, alterations of urine microbial metabolites were also observed in A− mice in the present study, including higher hippurate and lower 4- hydroxyphenylacetate two metabolites of microbial origin, which are produced by Clostridia spp. [42, 47, 48]. Vitamin A deficiency resulted in changes in the microbiota like a shift in the Firmicutes/Bacteroidetes ratio that is associated with chronic disease.
A− mice were hyperglycemic and responded more slowly to insulin injection, which suggests that the A− mice may be pre-diabetic. Others have shown that A− mice had hyperglycemic [49], but it is yet unclear whether vitamin A status is associated with human diabetes [50]. Vitamin A deficiency is not common in populations at high risk of developing diabetes [1]. Even so experimentally vitamin A has been shown to affect glucose regulation suggesting a role for vitamin A in glycemic control [51, 52]. In the developing world, where vitamin A deficiency is common, an atypical form of diabetes occurs due to a loss of pancreatic function [50, 53]. Retinoic acid (RA) treatment of adult A− mice did not reverse the effect of vitamin A deficiency on glucose (unpublished data), suggesting that early life vitamin A deficiency may irreversibly affect glucose responsiveness. Elevated blood BCAAs have been reported to be associated with insulin resistance and metabolic disease associated with obesity [54]. The data presented here shows lower BCAA levels and reduced insulin sensitivity in Amice. The A− mice weighed less than the A+ mice and therefore it seems likely that the mechanisms resulting in insulin sensitivity in obesity are different than the insulin sensitivity that occurs in A− mice. Instead the decreased BCAA levels in A− mice suggest increased protein metabolism compared to A+ mice [55]. A− mice are hyperglycemic and the data suggests that even transient vitamin A deficiency may affect the ability of the host to respond to glucose.
A+ mice produced more butyrate than A− mice. Butyrate increased energy expenditure by improving mitochondrial function [56] and induced the differentiation of colonic regulatory T cells [57]. Like A− mice, A− children had fewer butyrate-producing bacteria than A+ children [21]. A+ mice had more butyrate producing bacteria from the genus Clostridium_XVIII, Roseburia, and species Clostridium ramosum than A− mice [33, 58, 59]. In addition, the bacteria from A+ mice expressed more but and buk than the bacteria from A− mice, which are two important genes in bacteria for butyrate synthesis [60]. A− mice had a reduced ability to produce butyrate that would impact host energy metabolism and immune function in the gut.
A− mice had alterations in bacterial metabolism with enhanced carbohydrate and amino acid metabolism associated with lower amino acid biosynthesis. Emerging studies suggested that the interactions between the liver and the gut (gut-liver axis) play a critical role in several chronic diseases [61]. There was a strong correlation between changes in the gut microbiota and changes in the metabolic pathways in the livers, suggesting that the shifts in the microbiota may be responsible in part for the shifts in liver metabolism. Clostridium_XVIII and Roseburia bacteria were lower in the A− cecum, and were negatively correlated with increased levels of glucose, amino acids, and nucleic acids and positively correlated with the decreased levels of hepatic lipids in A− versus A+ mice. The lower levels of butyrate-producing bacteria might be responsible for a less efficient intestinal absorption of calories and decreased lipid deposition in the A− mice [18].
Vitamin A regulates the composition and gene expression of the bacteria found in the gastrointestinal tract. The vitamin A mediated effects on the microbiota have consequences for host metabolism in the liver. Vitamin A deficiency resulted in changes in host metabolism indicative of hyperglycemia and liver dysfunction. In the developed world, frank vitamin A deficiency is uncommon but the current study suggests an important role for vitamin A in regulating host metabolism. Vitamin A status altered the composition and the functionality of the microbiota in the gut [19–21]. Vitamin A deficiency resulted in shifts in the Bacteriodes/Firmicutes ratio, and reduced frequencies of butyrate producing bacteria that have been shown to improve health and to protect against development of many different chronic diseases [10–12]. In addition, the changes in the microbiota caused by vitamin A deficiency were associated with changes in host liver metabolism; demonstrating that some of the effects of vitamin A on host metabolism occur because of shifts in bacterial metabolism. As a result energy metabolism in the vitamin A deficient host was altered. Overall there are profound effects of vitamin A deficiency on the gut microbiota and host metabolism that suggest a role for vitamin A in the maintenance of gastrointestinal homeostasis and the prevention of chronic diseases including diabetes.
Supplementary Material
Acknowledgments
We would like to thank Joselyn Allen, Veronika Weaver, Lindsay Snyder, Pratiti Roy, Wei Gui, and Anitha Vijay for technical help. This research was funded by the American Association of Immunologists fellowship (to Y.T.) and National Institutes of Health under the following awards R56AI114972
Footnotes
Conflict of interest
The authors declare that there is no conflict of interest to disclosure
Publisher's Disclaimer: This is a PDF file of an unedited manuscript that has been accepted for publication. As a service to our customers we are providing this early version of the manuscript. The manuscript will undergo copyediting, typesetting, and review of the resulting proof before it is published in its final citable form. Please note that during the production process errors may be discovered which could affect the content, and all legal disclaimers that apply to the journal pertain.
References
- 1.WHO. WHO Global Database on Vitamin A Deficiency. Geneva: World Health Organization; 2009. Global prevalence of vitamin A deficiency in populations at risk 1995–2005. [Google Scholar]
- 2.Maziya-Dixon BB, Akinyele IO, Sanusi RA, Oguntona TE, Nokoe SK, Harris EW. Vitamin A deficiency is prevalent in children less than 5 y of age in Nigeria. J Nutr. 2006;136:2255–61. doi: 10.1093/jn/136.8.2255. [DOI] [PubMed] [Google Scholar]
- 3.Kozakova H, Hanson LA, Stepankova R, Kahu H, Dahlgren UI, Wiedermann U. Vitamin A deficiency leads to severe functional disturbance of the intestinal epithelium enzymes associated with diarrhoea and increased bacterial translocation in gnotobiotic rats. Microbes Infect. 2003;5:405–11. doi: 10.1016/s1286-4579(03)00045-5. [DOI] [PubMed] [Google Scholar]
- 4.Villamor E, Fawzi WW. Effects of vitamin A supplementation on immune responses and correlation with clinical outcomes. Clin Microbiol Rev. 2005;18:446–64. doi: 10.1128/CMR.18.3.446-464.2005. [DOI] [PMC free article] [PubMed] [Google Scholar]
- 5.Backhed F, Ley RE, Sonnenburg JL, Peterson DA, Gordon JI. Host-bacterial mutualism in the human intestine. Science. 2005;307:1915–20. doi: 10.1126/science.1104816. [DOI] [PubMed] [Google Scholar]
- 6.Guarner F. Enteric flora in health and disease. Digestion. 2006;73(Suppl 1):5–12. doi: 10.1159/000089775. [DOI] [PubMed] [Google Scholar]
- 7.Tan J, McKenzie C, Potamitis M, Thorburn AN, Mackay CR, Macia L. The role of short-chain fatty acids in health and disease. In: Alt FW, editor. Advances in Immunology. 1212014. pp. 91–119. [DOI] [PubMed] [Google Scholar]
- 8.Hooper LV, Gordon JI. Commensal host-bacterial relationships in the gut. Science. 2001;292:1115–8. doi: 10.1126/science.1058709. [DOI] [PubMed] [Google Scholar]
- 9.Murphy EF, Cotter PD, Healy S, Marques TM, O’Sullivan O, Fouhy F, et al. Composition and energy harvesting capacity of the gut microbiota: relationship to diet, obesity and time in mouse models. Gut. 2010;59:1635–42. doi: 10.1136/gut.2010.215665. [DOI] [PubMed] [Google Scholar]
- 10.Ley RE, Turnbaugh PJ, Klein S, Gordon JI. Microbial ecology - human gut microbes associated with obesity. Nature. 2006;444:1022–3. doi: 10.1038/4441022a. [DOI] [PubMed] [Google Scholar]
- 11.Larsen N, Vogensen FK, van den Berg FWJ, Nielsen DS, Andreasen AS, Pedersen BK, et al. Gut microbiota in human adults with type 2 diabetes differs from non-diabetic adults. Plos One. 2010;5:e9085. doi: 10.1371/journal.pone.0009085. [DOI] [PMC free article] [PubMed] [Google Scholar]
- 12.Walters WA, Xu Z, Knight R. Meta-analyses of human gut microbes associated with obesity and IBD. Febs Lett. 2014;588:4223–33. doi: 10.1016/j.febslet.2014.09.039. [DOI] [PMC free article] [PubMed] [Google Scholar]
- 13.Arora T, Sharma R. Fermentation potential of the gut microbiome: implications for energy homeostasis and weight management. Nutr Rev. 2011;69:99–106. doi: 10.1111/j.1753-4887.2010.00365.x. [DOI] [PubMed] [Google Scholar]
- 14.Ley RE, Backhed F, Turnbaugh P, Lozupone CA, Knight RD, Gordon JI. Obesity alters gut microbial ecology. Proc Natl Acad Sci U S A. 2005;102:11070–5. doi: 10.1073/pnas.0504978102. [DOI] [PMC free article] [PubMed] [Google Scholar]
- 15.Claus SP, Ellero SL, Berger B, Krause L, Bruttin A, Molina J, et al. Colonization-induced host-gut microbial metabolic interaction. Mbio. 2011;2:e00271–10. doi: 10.1128/mBio.00271-10. [DOI] [PMC free article] [PubMed] [Google Scholar]
- 16.Zhang L, Xie C, Nichols RG, Chan SHJ, Jiang C, Hao R, et al. Farnesoid X receptor signaling shapes the gut microbiota and controls hepatic lipid metabolism. mSystems. 2016;1:e00070–16. doi: 10.1128/mSystems.00070-16. [DOI] [PMC free article] [PubMed] [Google Scholar]
- 17.Atarashi K, Tanoue T, Shima T, Imaoka A, Kuwahara T, Momose Y, et al. Induction of colonic regulatory T cells by indigenous Clostridium species. Science. 2011;331:337–41. doi: 10.1126/science.1198469. [DOI] [PMC free article] [PubMed] [Google Scholar]
- 18.Donohoe DR, Garge N, Zhang XX, Sun W, O’Connell TM, Bunger MK, et al. The microbiome and butyrate regulate energy metabolism and autophagy in the mammalian colon. Cell Metab. 2011;13:517–26. doi: 10.1016/j.cmet.2011.02.018. [DOI] [PMC free article] [PubMed] [Google Scholar]
- 19.Cha HR, Chang SY, Chang JH, Kim JO, Yang JY, Kim CH, et al. Downregulation of Th17 cells in the small intestine by disruption of gut flora in the absence of retinoic acid. J Immunol. 2010;184:6799–806. doi: 10.4049/jimmunol.0902944. [DOI] [PubMed] [Google Scholar]
- 20.Hibberd MC, Wu M, Rodionov DA, Li XQ, Cheng JY, Griffin NW, et al. The effects of micronutrient deficiencies on bacterial species from the human gut microbiota. Sci Transl Med. 2017;9:aal4069. doi: 10.1126/scitranslmed.aal4069. [DOI] [PMC free article] [PubMed] [Google Scholar]
- 21.Lv ZY, Wang YT, Yang T, Zhan X, Li ZY, Hu HJ, et al. Vitamin A deficiency impacts the structural segregation of gut microbiota in children with persistent diarrhea. J Clin Biochem Nutr. 2016;59:113–21. doi: 10.3164/jcbn.15-148. [DOI] [PMC free article] [PubMed] [Google Scholar]
- 22.Carman JA, Smith SM, Hayes CE. Characterization of a helper lymphocyte-T defect in vitamin-A-deficient mice. J Immunol. 1989;142:388–93. [PubMed] [Google Scholar]
- 23.Smith SM, Levy NS, Hayes CE. Impaired immunity in vitamin-A-deficient mice. J Nutr. 1987;117:857–65. doi: 10.1093/jn/117.5.857. [DOI] [PubMed] [Google Scholar]
- 24.Ayala JE, Samuel VT, Morton GJ, Obici S, Croniger CM, Shulman GI, et al. Standard operating procedures for describing and performing metabolic tests of glucose homeostasis in mice. Dis Mod Mech. 2010;3:525–34. doi: 10.1242/dmm.006239. [DOI] [PMC free article] [PubMed] [Google Scholar]
- 25.Shi XH, Xiao CN, Wang YL, Tang HR. Gallic acid intake induces alterations to systems metabolism in rats. J Proteome Res. 2013;12:991–1006. doi: 10.1021/pr301041k. [DOI] [PubMed] [Google Scholar]
- 26.Cai J, Zhang J, Tian Y, Zhang L, Hatzakis E, Krausz KW, et al. Orthogonal comparison of GC–MS and 1H NMR spectroscopy for short chain fatty acid quantitation. Anal Chem. 2017;89:7900–6. doi: 10.1021/acs.analchem.7b00848. [DOI] [PMC free article] [PubMed] [Google Scholar]
- 27.Tian Y, Zhang LM, Wang YL, Tang HR. Age-related topographical metabolic signatures for the rat gastrointestinal contents. J Proteome Res. 2012;11:1397–411. doi: 10.1021/pr2011507. [DOI] [PubMed] [Google Scholar]
- 28.Dong FC, Zhang LL, Hao FH, Tang HR, Wang YL. Systemic responses of mice to dextran sulfate sodium-induced acute ulcerative colitis using H-1 NMR spectroscopy. J Proteome Res. 2013;12:2958–66. doi: 10.1021/pr4002383. [DOI] [PubMed] [Google Scholar]
- 29.An YP, Xu WX, Li HH, Lei HH, Zhang LM, Hao FH, et al. High-fat diet induces dynamic metabolic alterations in multiple biological matrices of rats. J Proteome Res. 2013;12:3755–68. doi: 10.1021/pr400398b. [DOI] [PubMed] [Google Scholar]
- 30.Eriksson L, Trygg J, Wold S. CV-ANOVA for significance testing of PLS and OPLS (R) models. J Chemometr. 2008;22:594–600. [Google Scholar]
- 31.Fierer N, Jackson JA, Vilgalys R, Jackson RB. Assessment of soil microbial community structure by use of taxon-specific quantitative PCR assays. Appl Environ Microb. 2005;71:4117–20. doi: 10.1128/AEM.71.7.4117-4120.2005. [DOI] [PMC free article] [PubMed] [Google Scholar]
- 32.Muhling M, Woolven-Allen J, Murrell JC, Joint I. Improved group-specific PCR primers for denaturing gradient gel electrophoresis analysis of the genetic diversity of complex microbial communities. ISME J. 2008;2:379–92. doi: 10.1038/ismej.2007.97. [DOI] [PubMed] [Google Scholar]
- 33.Natalie Becker JK, Loh Gunnar, Blaut Michael. Human intestinal microbiota: Characterization of a simplified and stable gnotobiotic rat model. Gut Microbes. 2011;2:25–33. doi: 10.4161/gmic.2.1.14651. [DOI] [PubMed] [Google Scholar]
- 34.Vital M, Penton CR, Wang Q, Young VB, Antonopoulos DA, Sogin ML, et al. A gene-targeted approach to investigate the intestinal butyrate-producing bacterial community. Microbiome. 2013;1:8. doi: 10.1186/2049-2618-1-8. [DOI] [PMC free article] [PubMed] [Google Scholar]
- 35.Louis P, Flint HJ. Development of a semiquantitative degenerate real-time PCR-based assay for estimation of numbers of butyryl-coenzyme A (CoA) CoA transferase genes in complex bacterial samples. Appl Environ Microbiol. 2007;73:2009–12. doi: 10.1128/AEM.02561-06. [DOI] [PMC free article] [PubMed] [Google Scholar]
- 36.Dahllof I, Baillie H, Kjelleberg S. rpoB-based microbial community analysis avoids limitations inherent in 16S rRNA gene intraspecies heterogeneity. Appl Environ Microbiol. 2000;66:3376–80. doi: 10.1128/aem.66.8.3376-3380.2000. [DOI] [PMC free article] [PubMed] [Google Scholar]
- 37.Schloss PD, Westcott SL, Ryabin T, Hall JR, Hartmann M, Hollister EB, et al. Introducing mothur: open-source, platform-independent, community-supported software for describing and comparing microbial communities. Appl Environ Microbiol. 2009;75:7537–41. doi: 10.1128/AEM.01541-09. [DOI] [PMC free article] [PubMed] [Google Scholar]
- 38.Kozich JJ, Westcott SL, Baxter NT, Highlander SK, Schloss PD. Development of a dual-index sequencing strategy and curation pipeline for analyzing amplicon sequencedata on the MiSeq Illumina sequencing platform. Appl Environ Microbiol. 2013;79:5112–20. doi: 10.1128/AEM.01043-13. [DOI] [PMC free article] [PubMed] [Google Scholar]
- 39.Langille MGI, Zaneveld J, Caporaso JG, McDonald D, Knights D, Reyes JA, et al. Predictive functional profiling of microbial communities using 16S rRNA marker gene sequences. Nat Biotechnol. 2013;31:814–21. doi: 10.1038/nbt.2676. [DOI] [PMC free article] [PubMed] [Google Scholar]
- 40.Abubucker S, Segata N, Goll J, Schubert AM, Izard J, Cantarel BL, et al. Metabolic reconstruction for metagenomic data and its application to the human microbiome. Plos Comput Biol. 2012;8:e1002358. doi: 10.1371/journal.pcbi.1002358. [DOI] [PMC free article] [PubMed] [Google Scholar]
- 41.den Besten G, van Eunen K, Groen AK, Venema K, Reijngoud DJ, Bakker BM. The role of short-chain fatty acids in the interplay between diet, gut microbiota, and host energy metabolism. J Lipid Res. 2013;54:2325–40. doi: 10.1194/jlr.R036012. [DOI] [PMC free article] [PubMed] [Google Scholar]
- 42.Lord RS, Bralley JA. Clinical applications of urinary organic acids. part 2. dysbiosis markers. Altern Med Rev. 2008;13:292–306. [PubMed] [Google Scholar]
- 43.Kabeerdoss J, Jayakanthan P, Pugazhendhi S, Ramakrishna BS. Alterations of mucosal microbiota in the colon of patients with inflammatory bowel disease revealed by real time polymerase chain reaction amplification of 16S ribosomal ribonucleic acid. Indian J Med Res. 2015;142:23–32. doi: 10.4103/0971-5916.162091. [DOI] [PMC free article] [PubMed] [Google Scholar]
- 44.Elias KM, Laurence A, Davidson TS, Stephens G, Kanno Y, Shevach EM, et al. Retinoic acid inhibits Th17 polarization and enhances FoxP3 expression through a Stat-3/Stat-5 independent signaling pathway. Blood. 2008;111:1013–20. doi: 10.1182/blood-2007-06-096438. [DOI] [PMC free article] [PubMed] [Google Scholar]
- 45.Eren AM, Sogin ML, Morrison HG, Vineis JH, Fisher JC, Newton RJ, et al. A single genus in the gut microbiome reflects host preference and specificity. ISME J. 2015;9:90–100. doi: 10.1038/ismej.2014.97. [DOI] [PMC free article] [PubMed] [Google Scholar]
- 46.Rajilic-Stojanovic M, de Vos WM. The first 1000 cultured species of the human gastrointestinal microbiota. FEMS Microbiol Rev. 2014;38:996–1047. doi: 10.1111/1574-6976.12075. [DOI] [PMC free article] [PubMed] [Google Scholar]
- 47.Lees HJ, Swann JR, Wilson ID, Nicholson JK, Holmes E. Hippurate: the natural history of a mammalian-microbial cometabolite. J Proteome Res. 2013;12:1527–46. doi: 10.1021/pr300900b. [DOI] [PubMed] [Google Scholar]
- 48.Williams HRT, Cox IJ, Walker DG, Cobbold JFL, Taylor-Robinson SD, Marshall SE, et al. Differences in gut microbial metabolism are responsible for reduced hippurate synthesis in Crohn’s disease. BMC Gastroenterol. 2010;10:108. doi: 10.1186/1471-230X-10-108. [DOI] [PMC free article] [PubMed] [Google Scholar]
- 49.Trasino SE, Benoit YD, Gudas LJ. Vitamin A deficiency causes hyperglycemia and loss of pancreatic beta-cell mass. J Biol Chem. 2015;290:1456–73. doi: 10.1074/jbc.M114.616763. [DOI] [PMC free article] [PubMed] [Google Scholar]
- 50.Trasino SE, Gudas LJ. Vitamin A: a missing link in diabetes? Diabetes Manag (Lond) 2015;5:359–67. doi: 10.2217/dmt.15.30. [DOI] [PMC free article] [PubMed] [Google Scholar]
- 51.Micallef SJ, Janes ME, Knezevic K, Davis RP, Elefanty AG, Stanley EG. Retinoic acid induces Pdx1-positive endoderm in differentiating mouse embryonic stem cells. Diabetes. 2005;54:301–5. doi: 10.2337/diabetes.54.2.301. [DOI] [PubMed] [Google Scholar]
- 52.Perez RJ, Benoit YD, Gudas LJ. Deletion of retinoic acid receptor beta (RAR beta) impairs pancreatic endocrine differentiation. Exp Cell Res. 2013;319:2196–204. doi: 10.1016/j.yexcr.2013.05.032. [DOI] [PMC free article] [PubMed] [Google Scholar]
- 53.Takahashi N, Takasu S. A close relationship between type 1 diabetes and vitamin A-deficiency and matrix metalloproteinase and hyaluronidase activities in skin tissues. Exp Dermatol. 2011;20:899–904. doi: 10.1111/j.1600-0625.2011.01351.x. [DOI] [PubMed] [Google Scholar]
- 54.Lynch CJ, Adams SH. Branched-chain amino acids in metabolic signalling and insulin resistance. Nat Rev Endocrinol. 2014;10:723–36. doi: 10.1038/nrendo.2014.171. [DOI] [PMC free article] [PubMed] [Google Scholar]
- 55.Tom A, Nair KS. Assessment of branched-chain amino acid status and potential for biomarkers. J Nutr. 2006;136:324S–30S. doi: 10.1093/jn/136.1.324S. [DOI] [PubMed] [Google Scholar]
- 56.Gao ZG, Yin J, Zhang J, Ward RE, Martin RJ, Lefevre M, et al. Butyrate improves insulin sensitivity and increases energy expenditure in mice. Diabetes. 2009;58:1509–17. doi: 10.2337/db08-1637. [DOI] [PMC free article] [PubMed] [Google Scholar]
- 57.Furusawa Y, Obata Y, Fukuda S, Endo TA, Nakato G, Takahashi D, et al. Commensal microbe-derived butyrate induces the differentiation of colonic regulatory T cells. Nature. 2013;504:446–50. doi: 10.1038/nature12721. [DOI] [PubMed] [Google Scholar]
- 58.Atarashi K, Tanoue T, Oshima K, Suda W, Nagano Y, Nishikawa H, et al. T-reg induction by a rationally selected mixture of Clostridia strains from the human microbiota. Nature. 2013;500:232–6. doi: 10.1038/nature12331. [DOI] [PubMed] [Google Scholar]
- 59.Duncan SH, Lobley GE, Holtrop G, Ince J, Johnstone AM, Louis P, et al. Human colonic microbiota associated with diet, obesity and weight loss. Int J Obesity. 2008;32:1720–4. doi: 10.1038/ijo.2008.155. [DOI] [PubMed] [Google Scholar]
- 60.Vital M, Howe AC, Tiedje JM. Revealing the bacterial butyrate synthesis pathways by analyzing (Meta) genomic data. Mbio. 2014;5:00889–14. doi: 10.1128/mBio.00889-14. [DOI] [PMC free article] [PubMed] [Google Scholar]
- 61.Compare D, Coccoli P, Rocco A, Nardone OM, De Maria S, Carteni M, et al. Gut-liver axis: the impact of gut microbiota on non alcoholic fatty liver disease. Nutr Metab Carbiovasc Dis. 2012;22:471–6. doi: 10.1016/j.numecd.2012.02.007. [DOI] [PubMed] [Google Scholar]
Associated Data
This section collects any data citations, data availability statements, or supplementary materials included in this article.