

Abstract
Bacterial ribosomal protein S1 is the largest and highly flexible protein of the 30S subunit, and one of a few core ribosomal proteins for which a complete structure is lacking. S1 is thought to participate in transcription and translation. Best understood is the role of S1 in facilitating translation of mRNA with structured 5′ UTRs. Here, we present cryo-EM analyses of the 70S ribosome that reveal multiple conformations of S1. Based on comparison of several 3D maximum likelihood classification approaches in Frealign, we propose a streamlined strategy for visualizing a highly dynamic component of a large macromolecular assembly that itself exhibits high compositional and conformational heterogeneity. The resulting maps show how S1 docks at the ribosomal protein S2 near the mRNA exit channel. The globular OB-fold domains sample a wide area around the mRNA exit channel and interact with mobile tails of proteins S6 and S18. S1 also interacts with the mRNA entrance channel, where an OB-fold domain can be localized near S3 and S5. Our analyses suggest that S1 cooperates with other ribosomal proteins to form a dynamic mesh near the mRNA exit and entrance channels to modulate the binding, folding and movement of mRNA.
Keywords: Rps1, ribosome, electron cryo-microscopy, 3D maximum-likelihood classification
1. Introduction
Advances in electron cryo-microscopy (cryo-EM), including direct electron detectors and improved computational techniques (Scheres, 2012; Lyumkis et al., 2013; Cheng, 2015; Nogales and Scheres, 2015), allow structural ensembles of biological complexes to be visualized at high resolution. Unlike in X-ray crystallography where a macromolecular complex is usually found in one or two conformational states, computational separation using 3D maximum likelihood classification allows determination of numerous states in a sample studied by cryo-EM (Scheres et al., 2007; Scheres, 2012; Lyumkis et al., 2013). We have recently applied these techniques using Frealign 9 (Lyumkis et al., 2013; Grigorieff, 2016) to visualize several steps of tRNA selection by the ribosome (Loveland et al., 2017), activation of stringent factor RelA (Loveland et al., 2016), viral translation initiation by IRES-containing mRNA (Abeyrathne et al., 2016), ribosome rescue by ArfA (Demo et al., 2017b) and tRNA translocation (Brilot et al., 2013). In these studies, we separated classes of ribosomes based on global features, including composition (presence or absence of a protein or RNA cofactor) and conformational differences of the ribosome or cofactors, to yield a set of functionally related ribosome structures or “structural ensembles”. While cryo-EM data classification often allows interpretation of structural differences at nearly atomic resolution within the ribosome core (Fischer et al., 2015; Fischer et al., 2016; James et al., 2016; Liu et al., 2016; Desai et al., 2017), the low resolution of the ribosome surface usually prevents detailed interpretation of mobile peripheral components (Arenz et al., 2016; Brown et al., 2016; Loveland et al., 2016).
S1 is the largest and one of the least understood ribosomal protein due to its structural dynamics. In E. coli, the protein has a mass of 61 kDa and comprises six β-barrel-shaped domains that each resemble the oligonucleotide/oligosaccharide-binding (OB)-fold implicated in nucleic acid binding (Bycroft et al., 1997; Salah et al., 2009). Biochemical studies suggest that in solution and on the ribosome, S1 can have an elongated shape stretching over 200 Å long (Giri and Subramanian, 1977; Laughrea and Moore, 1977; Labischinski and Subramanian, 1979; Sillers and Moore, 1981). S1 interacts with the 30S subunit and 70S ribosomes (Draper and von Hippel, 1979), with E. coli RNA polymerase (Sukhodolets and Garges, 2003; Sukhodolets et al., 2006; Demo et al., 2017a), and is an integral part of the Q phage replisome (Takeshita et al., 2014). In translation, S1 may play multiple roles, including those in translation initiation (Khanh et al., 1979; Tedin et al., 1997; Sørensen et al., 1998; Delvillani et al., 2011; Duval et al., 2013), elongation (Khanh et al., 1979; Potapov and Subramanian, 1992; Sørensen et al., 1998), tmRNA-mediated ribosome rescue (McGinness and Sauer, 2004; Saguy et al., 2007) and possibly ribosome recycling (Delvillani et al., 2011). The best understood role for S1 is in translation initiation where S1 is required for translation of mRNAs with structured 5′ ends or with weak or no Shine-Dalgarno sequences (Duval et al., 2013). Unlike most other ribosomal proteins, S1 is thought to exchange off and on to the ribosome (McGinness and Sauer, 2004; Delvillani et al., 2011). Biochemical studies showed that S1 interacts with the ribosome using its N-terminal domains 1 and 2 (D1 and D2), while its C-terminal domains 3–6 interact with mRNA (Subramanian, 1983; Aliprandi et al., 2008; Salah et al., 2009; Byrgazov et al., 2012; Duval et al., 2013). Intermediate-resolution cryo-EM structures show the major binding site of S1 is near the mRNA exit channel and protein S2 (Sengupta et al., 2001; Park et al., 2014; Byrgazov et al., 2015; Ahmed et al., 2017; Desai et al., 2017). The N-terminal alpha helix and D1 have been crystallized as a fusion protein connected with ribosomal protein S2 (Byrgazov et al., 2015) suggesting specific interactions between these proteins. Whether the first domain is stably bound or loosely associated with S2 on the ribosome is unclear. Other than weak density likely representing D2 near the mRNA exit channel (Byrgazov et al., 2015), no visualization beyond the first domain is available on the ribosome. However, NMR structures of the individual domains 2, 4, and 6 have been reported (Salah et al., 2009; Giraud et al., 2015). Crosslinking suggests that both the N-terminal and C-terminal domains interact with the mRNA exit channel, while the C-terminal domains also extend to distant locations up to 200 Å apart (Kenner, 1973; Czernilofsky et al., 1975; Lauber et al., 2012).
Cryo-EM studies that employ ”focusing” on a large region of a macromolecular complex, such as a ribosome subunit or domains, have been successful in separating distinct ribosome conformations and improving the resolution of the region (Fernández et al., 2014; Grigorieff, 2016). S1 is only ~2.5% of the ribosome’s mass, binds at the poorly resolved (solvent) side of the ribosome (Byrgazov et al., 2012; Byrgazov et al., 2015) and contains 6 domains (Salah et al., 2009), which are similar to each other and have overlapping binding sites on the ribosome (Lauber et al., 2012). These factors make S1, the “mRNA catching arm” of the ribosome (Subramanian, 1983), a challenging subject for structural investigation. In this work, we employ deep classification in Frealign 9 (Lyumkis et al., 2013; Grigorieff, 2016) to study the dynamics of S1 bound to the ribosome. We propose a workflow for rapid assessment of the conformational variability of mobile components of a macromolecular complex.
2. Materials and methods
We have analyzed our recently described cryo-EM dataset of the decoding E. coli 70S ribosome in the presence of ternary complex EF-Tu•GPPCP•aminoacyl-tRNA, comprising 800,367 particles and yielding ribosome structures at up to 3.2 A resolution (Loveland et al., 2017). A brief description of the sample and cryo-EM conditions is followed by a detailed description of the classification and modeling. We compare four classification strategies, including unsupervised global and focus-based local approaches. We conclude that using a global classification followed by a “dual-mask”-focus classification results in the identification of most distinct classes of S1.
2.1 Preparation of E. coli 70S ribosome bound with the cognate ternary complex
The ribosome complex was assembled as described (Loveland et al., 2017) and contained the following concentrations of components in the final sample used for cryo-EM grid preparation: 250 nM 50S subunits; 250 nM 30S subunits; 1.25 μM mRNA; 500 nM fMet-tRNAfMet; 1 μM Phe-tRNAPhe; 1 μM EF-Tu and 500 μM GDPCP, in Reaction Buffer (20 mM HEPES•KOH, pH 7.5, 20 mM magnesium chloride, 150 mM ammonium chloride, 2 mM spermidine, 0.1 mM spermine, 6 mM -mercaptoethanol). The synthetic mRNA contained the Shine-Dalgarno sequence and a linker to place the AUG codon in the P site and the Phe codon (underlined) in the A site (IDT): GGC AAG GAG GUA AAA AUG UUC AAA AAA.
2.2 Grid preparation
Holey-carbon grids (C-flat 1.2–1.3, Protochips) were coated with a thin layer of carbon then glow discharged with 20 mA with negative polarity for 45 s in an EMITECH K100X unit. 2 ul of ribosome complex was applied and, after a 10-second incubation, the grids were blotted for 4 s at 4°C and ~95% humidity, then plunged into liquid ethane using a CP3 cryo plunger (Gatan Inc.).
2.3 Electron microscopy and image processing
A dataset of 3028 movies was collected automatically using SerialEM (Mastronarde, 2005) on a Titan Krios electron microscope (FEI) operating at 300 kV and equipped with K2 Summit direct electron detector (Gatan Inc.) using 0.5- to 2.2-μm underfocus. 50 frames per movie were collected at 1 e−/Å2 per frame for a total dose of 50 e−/Å2 on the sample. The super-resolution pixel size was 0.82 Å on the sample.
800,367 particles were automatically picked using a ribosome reference and extracted from aligned movie sums as previously described (Loveland et al., 2017).
2.4 Map refinement and reconstruction
Frealign (versions 9.07–9.11) was used for all steps of refinement and reconstruction (Lyumkis et al., 2013) on a 12-core desktop workstation (Dell Tower 7910 equipped with Dual E5-2670 processor and 128Gb of RAM). A 6×-binned image stack was initially aligned to a ribosome reference (EM databank map 1003, (Gabashvili et al., 2000)) using 10 rounds of mode 3 (global search) alignment, originally including data in the resolution range from 300 Å to 60 Å and gradually dropping to 30 Å. Next, the 2×-binned, and later the unbinned image stacks were successively aligned against the common reference using mode 1 (local refinement), gradually including data up to a high-resolution limit of 8 Å, whereupon the resolution of the “common reference” stopped improving. During the alignment’s reconstruction steps, thresh_reconst was limited to 0.6 so that only 60% of particles were used for reconstruction. Subsequently, the refined parameters were used for classification of 4×-binned image stack into 6 classes in 50 rounds using a spherical (60-Å radius) focus mask around EF-Tu and A/T tRNA, including resolutions from 300 to 8 Å during classification. This procedure yielded three EF-Tu-containing classes, a class with two tRNAs and the ribosome in classical state (Empty A), a class with three tRNAs and the ribosome in the classical state (Full A), and a class with 1 tRNA with the ribosome in the hybrid state. The particle alignment parameters reported in (Loveland et al., 2017) were used in this work without further refinement.
2.4.1 Global Classification
To identify areas of heterogeneity attributable to S1, we classified the full 4×-binned image stack into 8, 16 or 32 classes using a resolution range of 300 to 8 Å for classification without any masks. 50 rounds of classification were used. Maps of the final round of the classification were prepared from the unbinned image stack without further parameter refinement.
2.4.2 Classification with 3D mask around proteins known to crosslink to S1
To limit classification to parts of the ribosome known to interact with S1, we created a binary mask for classification around the 30S ribosomal subunit proteins: S2, S3, S6, S7, S9, S18, S19 and S21, which were previously shown to crosslink to S1 (Lauber et al., 2012) and their close neighbors: S4, S5, S10, S11, S14 and S15. To create the mask, the protein coordinates were extracted from PDB: 5UYM (Loveland et al., 2017) and a density volume was calculated using Bsoft (bgex command) (Heymann and Belnap, 2007) using the 6×-binned voxel size. The volume was low-pass filtered to 30 Å in EMAN2 (Tang et al., 2007). The low-pass filtered volume was viewed in UCSF Chimera (Pettersen et al., 2004) over PDB: 5UYM and a level was found such that the protein backbone of modeled proteins was ~15–20 Å away from the edge of the mask. The level was 0.1 and was slightly lower than the mean of the low-pass filtered volume (−0.07 sigma). EMAN2 (Tang et al., 2007) was used to create a binary mask at this level. Using the mask, we classified the full 6×-binned image stack into 8 or 48 classes using a resolution range of 300 to 10 Å for classification in Frealign 9.11 (Lyumkis et al., 2013). In Frealign, a 5-pixel cosine edge was added to the mask and the volume outside the mask was completely downweighted (value = 0.0). 50 rounds of classification were used. Maps of the final round of the classification were prepared from the unbinned image stack without further parameter refinement.
2.4.3 Focus (spherical) masking
To better separate heterogeneity at sites identified in approaches 2.4.1 and 2.4.2, we used the “focus mask” feature of Frealign 9.11. The coordinates of the mask were chosen in Pymol (DeLano, 2002) as follows. An atom was created and moved to the desired position on the “common reference” and its coordinates were noted. The radius of the focus mask was optimized by using sphere visualization in Pymol with setting sphere_scale set to desired radius in Å. Multiple focus masks were tested.
To further limit heterogeneity, we used substacks of the dataset including particles belonging either to the Empty A or Full A class described at the beginning of section 2.4 and in section 3.1. For the Empty A stack, 257,936 particles belonging to the class with the classical state ribosome with two tRNAs were extracted using merge_classes.exe, including particles with >50% occupancy and scores >0. For the Full A stack, 162,223 particles belong to the class with the classical state ribosome with three tRNAs were extracted using merge_classes.exe, including particles with >50% occupancy and scores >0.
Each substack was resampled to 6×-binning and was subjected to classification with the focus mask shown in Figure 1 into 8 or more classes using a resolution range of 300 to 10 Å for classification in Frealign 9.11 (Lyumkis et al., 2013). 50 rounds of classification were used. Maps of the final round of the classification were prepared from the unbinned substacks without further refinement.
Figure 1. Approaches to visualizing S1 on the ribosome.
A) Domain structure of E. coli S1. S1 domains 1 and 2 are implicated in ribosome binding while S1 domains 3–6 are required for interaction with mRNA.
B) S1 adopts a wide variety of conformations on the ribosome. The pre-classification cryo-EM map is shown low-pass filtered to 10 Å and at low contour to reveal low-resolution density for unmodeled proteins L9, L1, L7/L12 and S1 (gray). Modeled density is shown in the following colors: 50S subunit (blue) and 30S subunit (gold), E- and P- site tRNA (orange).
C) Global classification was used to separate particles into 4, 8, and 32 classes and revealed differences throughout the ribosome, including positions of the L1 stalk, L7/L12, L11 stalk, tRNA occupancy, intersubunit rotation (pink map), and 30S domain closure. 8 maps out of the 32-class classification are shown to highlight differences visible throughout the ribosome and the S1 binding site at S2.
D) The knowledge-based approach using classification with a structure-based mask. The mask (transparent blue) was created from models of proteins that crosslink to S1 (see Methods). Separation into 8 or 48 classes revealed differences in tRNA occupancy, 30S subunit conformation (intersubunit rotation, pink map, and 30S domain closure) and density attributable to S1 near S2. 8 maps out of the 48-class classification are shown to highlight differences visible throughout the ribosome and the S1-binding site at S2. The brown class had S1 most enriched.
E) The detailed classification using spherical “focus” masks (blue). A 50-Å mask was located on the 30S subunit. 8 maps out of the 16 class classifications are shown to highlight differences within the area of interest. The class lacking S1 is purple.
F) The dual-mask approach using classification with spherical “focus” mask (blue) combined with a negative mask obscuring modeled regions of the ribosome (gray). The focus mask was centered at the mRNA exit channel. 8 maps out of the 16 class classifications are shown to highlight differences within the area of interest.
For C–F, maps are shown filtered to 6 Å and shown at the same absolute level 0.01.
2.4.4 Negative masking combined with focus masking
Lastly, we combined 3D masking with focus masks. To limit classification to parts of the ribosome without known models, we created a binary mask that obscured the ribosome complex modeled in PDB: 5UYM (Loveland et al., 2017). A density volume from PDB: 5UYM was calculated using Bsoft (bgex command) (Heymann and Belnap, 2007) using the 6×bin voxel size and was low-pass filtered to 20 Å therein. The map was multiplied by a factor of −1 using EMAN2 (Tang et al., 2007). The negative mask was viewed in UCSF Chimera (Pettersen et al., 2004) over the PDB: 5UYM aligned with PDB: 4TOI (Byrgazov et al., 2015) of the S1:S2 chimeric protein. A level was found that covered the N-terminal helix of S1 in PDB:4TOI but not the ribosome. EMAN2 (Tang et al., 2007) was used to create a binary mask at level −22.9 essentially creating a negative mask cut closely around the ribosome. Using the negative mask together with the focus mask shown in Figure 1F, we classified the full 6×-binned image stack into 8 or 16 classes using a resolution range of 300 to 10 Å for classification in Frealign 9.11 (Lyumkis et al., 2013). In Frealign, a 5-pixel cosine edge was added to the mask and the volume outside the mask was downweighted to value = 0.1. 50 rounds of classification were used. Maps of the final round of the classification were prepared from the unbinned image stack without further refinement. The same strategy was applied to visualize differences at the mRNA entrance using the focus mask shown in Fig. S2.
The maps used for structure fitting were softened by applying an automatically determined B-factor at 6 Å using bfactor.exe (included with the FREALIGN distribution (Lyumkis et al., 2013)). FSC curves were calculated by FREALIGN for even and odd particle half-sets. frealign_calc_stats was used to derive the occupancy of particles in each class. Blocres was used to assess local resolution of unfiltered and unmasked volumes using a box size of 60 pixels, step size of 10 pixels, and resolution criterion of FSC value at 0.143 (Cardone et al., 2013).
2.5 Map interpretation
Our high-resolution cryo-EM structures of the 70S•tRNA•EF-Tu•GTP (Structure II or Structure III) were used as starting models for structure modeling. The structures of the N-terminal helix of S1, domain 1 (D1) and protein S2 were taken from PDB: 4TOI (Byrgazov et al., 2015). The structure of S1 domain 2 (D2) was taken from PDB: 2MFL, state 1 (Giraud et al., 2015). The structure of S1 domain 3 (D3) was built in I-TASSER (Yang et al., 2015). The structure of S1 domain 4 (D4) was taken from PDB: 2KHI, state 1 (Salah et al., 2009). The flexible regions of the domains are colored gray in the Figures to illustrate where apparent clashes with the ribosome or extensions outside the map contours might be tolerated. Regions of high mobility among NMR states (domain 2 PDB: 2MFL and domain 4 PDB:2KHI) were determined using MOBI, an internet applet for NMR mobility detection (Martin et al., 2010). Regions that were mobile in domain 4 were also applied to conserved elements in the I-TASSER structure of domain 3.
The S1 domains were docked into the maps using Pymol (DeLano, 2002). For the N-terminal helix and D1, the docking involved alignment of S2 from PDB: 4TOI (Byrgazov et al., 2015) to the S2 of Structure III (Loveland et al., 2017). The remaining domains were docked manually. Since the resolution of the maps is insufficient to distinguish among S1 domains and their relative orientations, connectivity between domains, crosslinking data (Lauber et al., 2012), and data suggesting RNA binding residues (Aliprandi et al., 2008) were used as additional restraints for domain docking.
The structural model for the ribosome including S1 domains visualized in Class 1 was refined as follows. The cryo-EM structure of the 70S•tRNA•EF-Tu•GDPCP complex (Structure III; PDB: 5UYM, (Loveland et al., 2017)), excluding EF-Tu, GDPCP, A/T-tRNA and ions, was used as a starting model for structure refinement. The starting structural model for tRNAPhe in the A site was adopted from the 70S•fMet-tRNAfMet•Phe-tRNAPhe crystal structure (PDB: 1VY4) (Polikanov et al., 2014). The starting model for S2 was adopted from PDB: 4TOI (Byrgazov et al., 2015). The coordinates for the ribosome excluding S1 domains 1 and 2 and the C-terminal tail of S6 in Class 1 were refined using real-space simulated-annealing refinement using RSRef (Chapman, 1995; Korostelev et al., 2002) against the cryo-EM map for Class 1 locally scaled with B-factors using Locscale (Jakobi et al., 2017). The models for S1 domains D1 and D2 and the C-terminal tail of S6 were separately and conservatively refined by real-space torsion-angle refinement (Chapman, 1995; Korostelev et al., 2002) against the cryo-EM map low-pass filtered to 6 Å. Refinement parameters, such as the relative weighting of stereochemical restraints and experimental energy term, were optimized to produce the optimal structure stereochemistry, real-space correlation coefficient and R-factor, which report on the fit of the model to the map (Zhou et al., 1998). Secondary-structure restraints, comprising hydrogen-bonding restraints for ribosomal proteins and base-pairing restraints for RNA molecules were employed as described (Laurberg et al., 2008). The coordinates for the ribosome excluding S1 domains 1 and 2 and the C-terminal tail of S6 were next refined using phenix.real_space_refine (Adams et al., 2011) to improve protein backbone geometry. Next, the coordinates for both the ribosome and S1 and S6 were jointly refined in RSRef against the Locscale-filtered map to release clashes, with harmonic restraints to preserve protein backbone geometry (Chapman, 1995; Korostelev et al., 2002). Phenix.real_space_refine was used to refine B-factors of the model against the Locscale-filtered map (Adams et al., 2011). The resulting structural model has good stereochemical parameters, characterized by low deviation from ideal bond lengths and angles and agrees closely with the cryo-EM map as indicated by high correlation coefficients and low real-space R factors (Table S3). Structure quality was validated using MolProbity (Chen et al., 2010).
Figures were prepared in Chimera and Pymol (DeLano, 2002; Pettersen et al., 2004).
3. Results and Discussion
In our recent study of mRNA decoding (Loveland et al., 2017), we noticed variable density around the mRNA exit channel and S2, whose location coincides with the putative binding site of S1 (Byrgazov et al., 2012; Park et al., 2014; Byrgazov et al., 2015). Taking advantage the large size of our dataset (800,367 particles) and improved classification in Frealign 9.11, we asked in this study whether we could visualize different conformational states of S1, a highly dynamic and flexible protein.
3.1 Strategies for visualizing S1
Because S1 crosslinks to a large surface of the 30S ribosomal subunit including proteins at the mRNA entrance and exit channels (Lauber et al., 2012) (Fig. 1A–B), we first asked whether it is possible to identify globular S1 domain densities using an unbiased classification, without focusing on a specific ribosome region. We used Frealign to separate the dataset into increasingly more 3D classes - 8, 16, and 32 - which we expected to reveal states differing in S1 presence or conformation (Fig. 1C). When eight classes were used, the classes varied in the presence or absence of tRNA and EF-Tu and their conformational states, in domain motions of the 30S ribosomal subunit (open, partial and closed states) and inter-subunit rotation. No continuous or globular density was identified beyond the well-resolved domains of the ribosome complex. Addition of extra classes (16 or 32 classes) revealed additional conformational changes in flexible regions of the ribosome, chiefly the L1 and L11 stalks. We also noted appearance and variability in the globular density around S2, coinciding with the main binding site for the N-terminus of S1, and the mRNA exit channel (Fig. 1C). However, continuous density was visible only in one or two classes and was not of sufficient quality to dock S1 domains. Overall, this unbiased global classification was useful in that it revealed S1 binding site, however the separation of classes occurred on too many different features of the 70S ribosome and the classes did not reveal domain distribution for S1.
Our next approach for visualizing S1 was informed by the initial global classification and reports from previous biochemical and structural studies. We created a 3D mask comprising nine different 30S ribosomal subunit proteins that were previously shown to crosslink to S1 (Lauber et al., 2012), and six of their close neighbors (see Methods). We then performed maximum likelihood classification into 8 or 48 classes using this 3D mask (Fig. 1D). The major differences between the classes accounted for global differences in the 30S subunit conformation, revealing the domain closure and intersubunit rotation. In addition, distinct densities were present that could be attributed to S1 (Fig. 1D). The differences clustered around S2 and the mRNA exit channel, while some had additional density near the mRNA entrance channel at proteins S3, S4 and S5. However, the low-resolution of these features prevented detailed interpretation of the maps.
In summary, fast classification of the complete dataset without using a mask or using a large mask comprising most of the 30S subunit did not reveal well-resolved conformations of S1 but suggested areas of interest. To minimize the global ribosome heterogeneity due to different ribosomal subunit conformations and/or tRNA occupancy, we selected two more uniform subsets of particles (Fig. 1E–F). We extracted the subsets of particles that had an empty A site (Empty A; 257,936 particles) or a filled A site (Full A; 162,223 particles). At this stage, we switched to using Frealign 9.11’s “focus” (spherical) masking feature, to allow class separation within a smaller region of the ribosome (Grigorieff, 2016) and tested two approaches.
The first focus mask was a sphere with a radius of 30 Å that encompassed the mRNA exit channel and was used to classify the Full A substack into 3 classes. One class revealed strong density for the N-terminal helix of S1, domain 1 (D1) and a large, low-resolution density that could be another S1 domain. A second class had weak density for D1 and extra density near S6 and S18. A third class had weak density for S1, but had strong density for the four nucleotides of mRNA outside of the mRNA exit channel. The low resolution of the features in the maps prompted us to continue adding classes and to change focus masks to different regions of the ribosome that exhibited local heterogeneity (Fig S2). We eventually tried using a focus mask with a radius of 50 Å that encompassed both the mRNA entrance and exit channels (Fig. 1E). Classification of the Empty A substack into 16 classes resulted in the first and only map without density attributable to S1 including the N-terminal helix of S1, accounting for ~7% of particles (Fig. S1). Despite the apparent high S1 occupancy in four other classes, evidenced by density for the N-terminal helix at S2, we were only able to fit one more S1 domain, D1, into weak globular density. Similar separation of the Full A substack did not yield a class lacking the N-terminal helix of S1, suggesting that S1 is bound in nearly all ribosomes that contain the A-site tRNA.
To improve the details of S1 at its main binding site, we tried a “dual-mask” approach that combined 3D and “focus” masking. The 3D mask was a “negative” mask that covered the modeled regions of the ribosome and was used to down-weight the dominating ribosome density to 10% during classification. The focus mask was a 30-Å sphere centered around the mRNA exit channel (Fig. 1F; Fig. 2A). They were used to separate the Full A substack into 16 classes. Of the over 450 different maps resulting from various classification strategies in the course of this work, these maps demonstrated the clearest features for D2 and the C-terminal domains of S1 as well as the tails of S6 and S18. The maps and docking from this final classification will be discussed below. This classification took ~11 hours on the desktop workstation, which concurrently performed other parallel classifications. The same strategy was used to separate particles based on extra density outside of the mRNA entrance channel into 8 classes.
Figure 2. The N-terminal domain of S1 binds to S2.
A) mRNA exit channel of the ribosome is shown with the focus mask used in the dual-mask approach. Colors are as in Fig. 1B.
B) Close-up view of the main binding site of S1. 16S rRNA (light yellow), 30S subunit proteins (dark yellow) and 5′ end of mRNA (blue) are shown.
C) Close-up view of the interaction of the N-terminal helix of S1 with S2. The cryo-EM map (Class 10) is shown at 2.5 σ after applying a B-factor of −50 Å2.
D) Position of D1 in Class 1, which matches the crystal structure of the N-terminus of S1 bound to S2 (PDB:4TOI; (Byrgazov et al., 2015)). Classes 2 and 3 were also compatible with this placement for D1.
E) Density for the N-terminal helix and D1 bound to S2 in Class 1. The cryo-EM map, low-pass filtered to 6 Å, is shown at 1 σ.
F) Loop 2 of D1 is a second anchor point for S1 on the ribosome. In Classes 4 and 5 (both transparent), D1 was bound at S2 via loop 2, but D1 positions differ from that in Class 1 (solid red).
G) D1 is detached from its main binding site at S2, while the N-terminal helix retains its position, in Classes 6–9. Classes 10 through 15 are not shown because D1 could not be placed.
In panels F and G, models of D2 and D3, mRNA nucleotides 1–4 and tails of S06 and S18 were omitted for clarity.
To rapidly assess which classification yielded better class separation and stronger S1 features, we compared the size and resolution of new features revealed within each class. To measure size, a difference map was calculated between each final class and the starting class binned to 6x pixel size (effectively low-pass-filtering the data to ~10 Å). The density volume (in Å3) of the difference map at 5 sigma was calculated using Chimera (Pettersen et al., 2004). We looked for the largest volume difference among the classes, as a mark of most differences in S1 occupancy. The dual-mask classification at the mRNA exit was superior to other classifications involving 16 classes (Table S1). The resolution of the 16 maps ranged from 3.7 to 4.3 Å (Fig. S3), however, the local resolution of the S1-binding region was ~4 Å for the N-terminal helix (Fig. 2C) and lower than 6 Å for S1 domains. 15 maps were used for structural interpretation of S1 dynamics.
3.2 S1 is anchored to S2 and cooperates with dynamic tails of S6 and S18
Consistent with previous reports, we find that S1 binds at the mRNA exit channel past the ribosomal E site, between the head and platform of the 30S subunit (Byrgazov et al., 2012; Park et al., 2014; Byrgazov et al., 2015). The mRNA exit channel comprises the 3′ end of 16S rRNA required to base-pair with the Shine-Dalgarno region of mRNA during translation initiation. The Shine-Dalgarno helix is surrounded by ribosomal proteins S18, S21, S2, and hairpin 26 (h26) of 16S rRNA (Fig. 2A–B). The mRNA in our complex contained the Shine-Dalgarno sequence preceded by four nucleotides that extend into the solvent and might be involved in interactions with S1.
Deep classification of cryo-EM data reveals that the N-terminal helix of S1 acts as an anchor (Fig. 2C), whereas the rest of S1 is extremely dynamic (Movie 1). Density of the N-terminal helix is present in all but one map out of the over 450 maps that we inspected (Fig. S1; see section 3.1 and Methods), indicating high occupancy and conformational stability of this part of S1. The helix binds S2 via hydrophobic interactions between Phe5 and Phe9 (S1) and Phe32, Arg35 and Ile40 (S2), consistent with previous findings (Byrgazov et al., 2015). Recent cryo-EM structures of the chloroplast ribosome from spinach (bS1c) and the mitochondrial ribosome from yeast include partially modeled S1 (Ahmed et al., 2017; Desai et al., 2017). The chloroplast and mitochondrial S1 interact with S2 at a similar position and utilize conserved hydrophobic residues, suggesting a similar mechanism for anchoring S1 to S2 in bacteria and eukaryotic organelles.
By contrast, domain 1 (D1), which is connected with the N-terminal helix via a 10-aa linker, is highly dynamic and adopts multiple positions, which differ by up to 50 Å. In Classes 1–3, the position of D1 is similar to that in the crystal structure of the S2-S1 chimera (Byrgazov et al., 2015), in which the β-sheet of S1 packs on α-helices of S2. Here, the tip of loop 2 of S1 (at Lys43) penetrates into the Zn2+-binding pocket of S2, comprised of aspartates 187, 203 and 204 (Byrgazov et al., 2015) (Fig. 2C–D). In Classes 4–5, D1 is found in different positions. Strong density for loop 2 contacting S2 shows that the loop acts as a hinge for D1 movement around S2 (Fig. 2E). In the yeast mitochondrial ribosome, domain 1 takes a different shape, however the sequence of this loop and its interaction with S2 is conserved (Desai et al., 2017), consistent with a key functional role. In Classes 6–9, D1 is displaced from its binding site at S2 and reaches helix 26 (h26) of 16S rRNA (Fig. 2F). Density for D1 is absent in Classes 10–15 (Fig. S3). The displacement of D1 from its main binding site at S2 was recently observed in the structure of the 30S bound with RNA polymerase (Demo et al., 2017a), in which a zinc finger from the polymerase binds S2 instead (Fig. S4).
Several cryo-EM maps reveal density suggesting the positions for the second domain of S1. While D2 shares a common β-strand-rich S1-fold with domains 3–6 (D3–6), it has a distinct helix at the N terminus (Giraud et al., 2015). Using this helix, protein chain connectivity and crosslinking data (Lauber et al., 2012), we tentatively assigned D2 to five Classes (Fig. 3). We find that D2 binds in close proximity to h26 and the 5′ end of the mRNA. In Class 10, D2 appears to interact with the 5′ end of mRNA. In Classes 1 and 7 it is in a similar location, but mRNA is not ordered. In Classes 2 and 11, D2 rotates to interact with h26. In addition, D2 interacts with the C-terminal tail of S6 and N-terminal tail of S18, as described below.
Figure 3. S1 domain 2 binds in the vicinity of h26 of 16S rRNA.
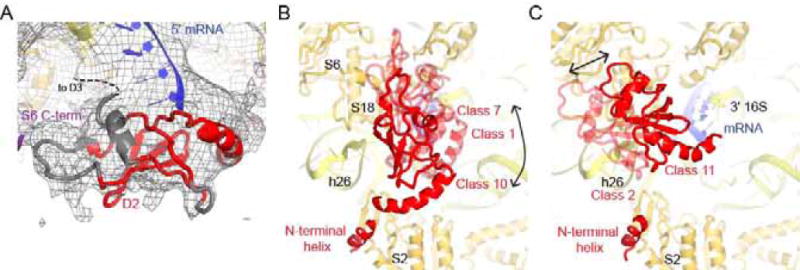
A) Density for D2 in the vicinity of h26 of the 16S rRNA and at the 5′ end of mRNA in Class 10. The cryo-EM map, low-pass filtered to 6 Å, is shown at 1 σ.
B) D2 dynamics. In Classes 1 and 7 (transparent red), D2 is shifted compared to Class 10 (solid red). The first four nucleotides of mRNA are only ordered in Class 10 and are omitted for clarity along with D1, D3, and the C-terminal tail of S06.
C) In Class 11 (solid red) and 2 (transparent red), D2 interacts with h26 by tilting relative to Class 10 (not shown). While the first four nucleotides of mRNA are ordered in Class 11, they do not contact D2 and are omitted for clarity along with D3 and the C-terminal tail of S6.
Seven cryo-EM maps also reveal smaller globular density at the mRNA exit channel consistent with one of the four C-terminal S1 domains known to interact with mRNA (Subramanian, 1983; Aliprandi et al., 2008; Salah et al., 2009; Duval et al., 2013). The resolution of our maps, however, does not allow assignment of domain identity or description of the molecular details of the interaction between the domain and mRNA (Fig. 4). It is possible that the density corresponds to the multiple, interchangeable domains, yielding poor resolution. We have placed D3 in the density on the basis of connectivity with D2, crosslinking of S1 with the 30S subunit (Lauber et al., 2012) and NMR studies that identified the face of S1 domains that interacts with RNA (Aliprandi et al., 2008). One prominent position is near the mRNA tail (Fig. 4A–C). Our finding of one rather than multiple S1 domain bound to the four 5′ mRNA residues is consistent with the observation that S1 domains bind on average 2.5 nucleotides of RNA (Qu et al., 2012). A second prominent position is near the 3′ end of 16S rRNA (Fig. 4D). This position is supported by crosslinking between S1 and the 3′ end of 16S rRNA (Kenner, 1973; Czernilofsky et al., 1975).
Figure 4. C-terminal domains of S1 are located near mRNA and the 3.
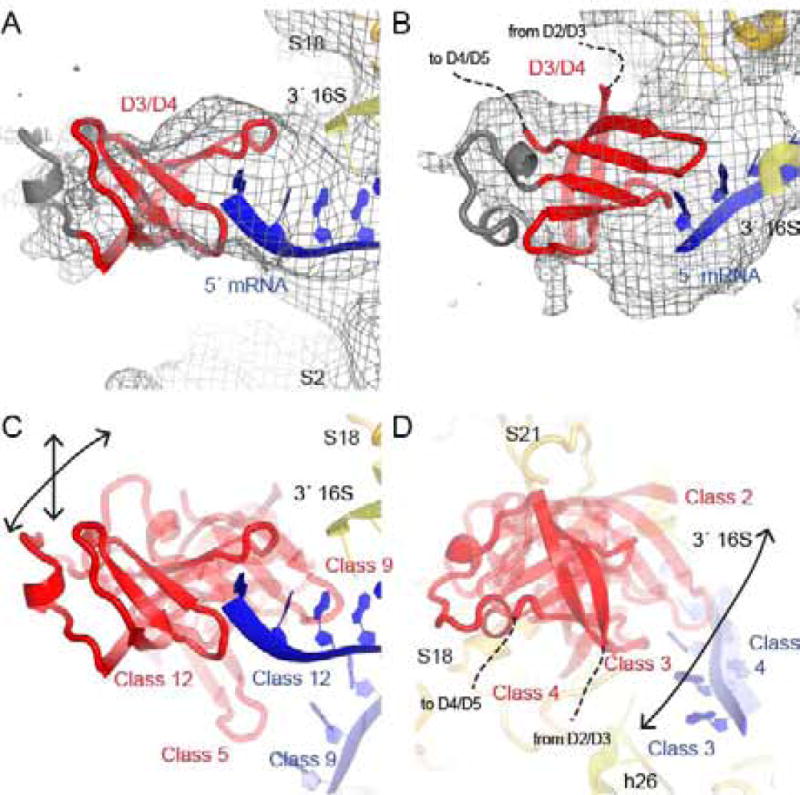
′ end of 16S rRNA.
A) An S1 domain (D3 or D4) interacts with the single-stranded 5′ nucleotides of mRNA in Class 12. The cryo-EM map, low-pass filtered to 6 Å, is shown at 1 σ.
B) An alternate view of D3/D4 in Class 12.
C) Like in Class 12 (solid red), D3/D4 binds near the 5′ end of mRNA in Class 9 and Class 5. The mRNA is ordered in Class 9, and not in Class 5.
D) D3/D4 is located near the 3′ end of the 16S rRNA, S18 and S21 in Classes 3 (solid red), 2 and 4 (transparent red).
Our classification also revealed densities for the dynamic tails of S6 and S18. These proteins bind next to each other at the intersubunit interface of the 30S platform (Fig. 2A–B). The C-terminus of S6 in E. coli including amino acids 101–131 is rarely modeled in ribosome structures except (Agirrezabala et al., 2011; Agirrezabala et al., 2012), where it was modeled as two helices of varying lengths separated by a flexible loop. The tail can be split into a N-terminal basic half and a C-terminal acidic half. The acidic part of the tail is modified by addition of 1–4 glutamic acids by the enzyme RimK (Hitz et al., 1977; Kang et al., 1989; Nesterchuk et al., 2011) and is conserved among a number of bacterial species but not Thermus thermophilus (Zhao et al., 2013). The function of this modification is poorly understood, but recent work suggests it is involved in bacterial adaptation and pathogenesis in Pseudomonas bacteria (Little et al., 2016). Our cryo-EM maps reveal dynamic positions of the N-terminal half of the S6 tail (Fig. 5A–B, Fig. S3). The C-terminal part of the tail is in close proximity to D2 and D3/4 modeled in our maps, but modeling of the tail was not possible due to low resolution. Crosslinking supports the positioning of S6 C-terminal tail (residue 106) next to D2 (residue 150) (Lauber et al., 2012) (Fig. 5A). We speculate that the modifications of S6 may facilitate or alter its interaction with S1 leading to altered translation regulation.
Figure 5. mRNA and S1 interact with the mobile C-terminal tail of S6 and N-terminal tail of S18.
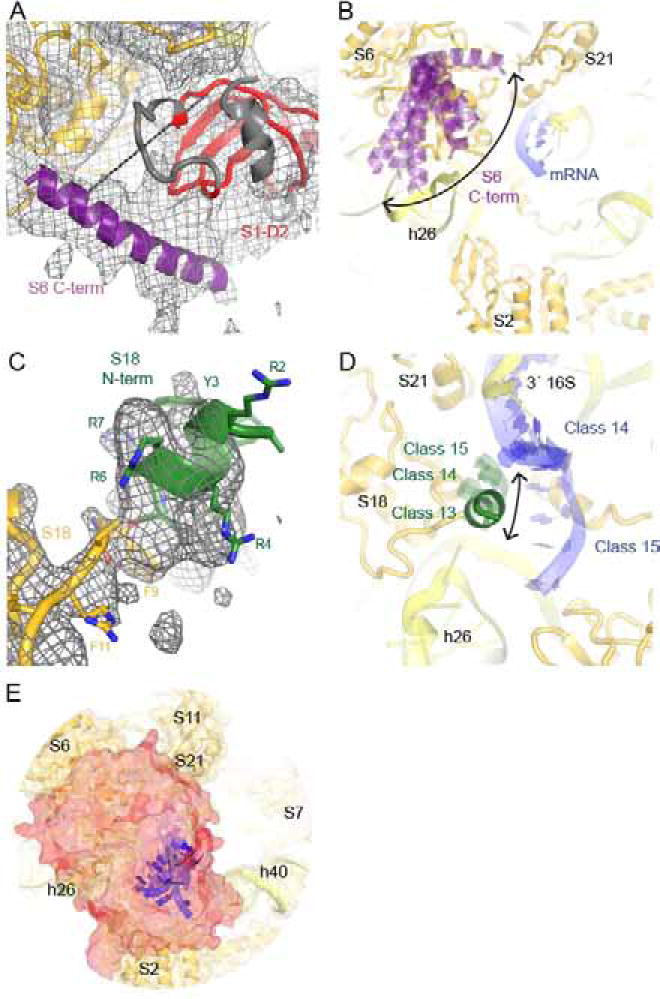
A) The C-terminal tail of S6 interacts with D2 in Class 1, consistent with crosslinking ((Lauber et al., 2012); shown by cyan dashed line). The cryo-EM map, low-pass filtered to 6 Å, is shown at 1 σ.
B) Low-resolution ordered density for the C-terminal tail of S6 appears in nine Classes: 1, 3, 5, 6, 7, 8, 10, 12 and 15.
C) Density for the N-terminal helix of S18 interacting with h26. The cryo-EM map (Class 13) is shown at 5 σ after applying a B-factor of −50 Å2.
D) Ordered density for the N-terminal tail of S18 is also present in Classes 14 and 15, albeit at lower resolution. The tail extends towards mRNA in Classes 14 and 15 or helix 26 in Class 13.
E) Superposition of S1, S6, S18 models from Classes 1 through 15 shows solid surface (red), which covers the mRNA exit channel and single-stranded mRNA positions (nucleotides 1–4 are shown). The view is as in Fig. 2A–B.
The N-terminus of S18 (first 8 amino acids) is not modeled in available ribosome structures except in the ~8 Å cryo-EM structure of the 70S ribosome (Agirrezabala et al., 2011). In E. coli, the tail contains several basic residues and two aromatic residues and is post-translationally modified via acetylation of the N-terminal residue (Nesterchuk et al., 2011). The tail contains a similar number of basic and/or aromatic residues in distant bacteria, such as T. thermophilus, and in chloroplasts. Our cryo-EM maps suggest that the N-terminus forms a short helix, which changes its position to interact with the 5′ end of mRNA or h26 of 16S rRNA (Fig. 5C–D, Fig. S3). Density for the N-terminus of S18 is strongest when it interacts with h26 or when the 5′ mRNA residues are ordered in vicinity of S18. Density is weak when the mRNA is shifted away from S18 towards S21 (Fig. S3). In summary, both S6 and S18 tails stochastically interact with S1 domains, either directly or via ordered mRNA.
To visualize the region that the dynamic domains of S1 sample, we superimposed all the modeled domains from 15 classes (Fig. 5E). This superposition revealed that S1 excursions completely cover the 5′ tail of the mRNA upstream of the Shine-Dalgarno helix, rather than adopting preferred conformations that would leave a well-defined path for mRNA exit. Thus, S1 dynamics likely increases the probability of interactions with various mRNA structures near the mRNA exit, allowing S1 to facilitate mRNA association with the 30S subunit during initiation.
3.3 S1 domains at the mRNA entrance channel
At the mRNA entrance channel, formed by proteins S3, S4 and S5, we found conformational variability of the C-terminal tail of ribosomal protein S3, which extends toward S2. In the vicinity of S3, six classes have local densities consistent with an S1 domain (Fig. 6). Two representative examples are shown in Fig. 6C–D. Binding of S1 at the mRNA entry is consistent with observed crosslinks between the S1 C-terminal domain 4 and ribosomal protein S3 (Lauber et al., 2012). The low resolution of the observed densities (Fig. 6C–D), however, precludes accurate placement and identification of the S1 domain(s). It is noteworthy that there is no co-variation between the densities at the mRNA entrance channel and the mRNA exit channel (Fig. S2). Placement of domain 4 at the entrance channel is unlikely if domains 1 through 3 interact with the exit channel more than 50 Å away. It is possible that the densities belong to S1 proteins bound to adjacent ribosomes on the cryo-EM grid (trans interaction). This suggests an intriguing possibility that S1 may contribute to mRNA dynamics and chemical stability during elongation on polysomes. Here, S1 could cover the ~70 Å of mRNA exposed between two neighboring ribosomes (Brandt et al., 2009), and thus protect mRNA from endonucleolytic cleavage.
Figure 6. Density for S1 domains at the mRNA entrance channel.
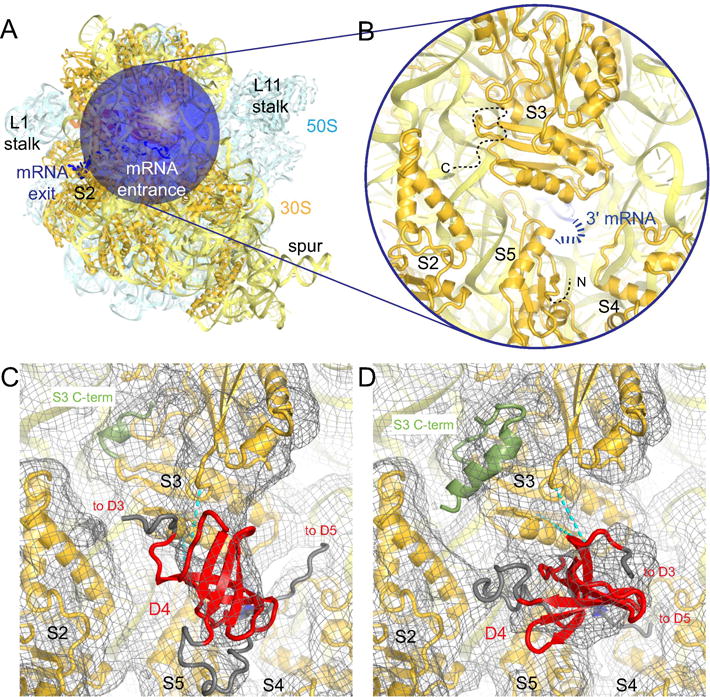
A) mRNA entrance channel of the ribosome is shown with the focus mask used in the dual-mask approach. Colors are as in Fig. 1B.
B) Close-up view of the mRNA entrance channel. 16S rRNA (light yellow), 30S subunit proteins (dark yellow) and 3′ end of mRNA (blue) are shown. The flexible N- and C-terminal tails of S5 and S3, respectively, are indicated by dashed black lines.
C) Density to fit an S1 domain is present at the mRNA entrance in the vicinity of the 3′ end of mRNA in Class A. The cryo-EM map, low-pass filtered to 6 Å, is shown at 0.5 σ. Cyan dashed lines indicate crosslinks observed between S3 and D4 by Lauber et. al. (Lauber et al., 2012).
D) In Class B, an alternative fit of an S1 domain is possible (relative to that shown in panel C). The cryo-EM map and crosslinks are shown as in C.
4. Conclusions
We compared four approaches for deep classification of a ribosome dataset to identify conformational states of a highly dynamic protein S1. We show that unbiased global classification into more than 8 classes (e.g. 16 or 32) enables locating the mobile protein within a compositionally and conformationally heterogeneous ribosome complex. In the next step, a spherical mask around the region of interest, while masking out the large macromolecule using a 3D mask (negative masking), identifies different classes of the mobile protein in the region of interest. Each step of classification took only ~6–12 hours on a 12-core desktop workstation, making the dual-mask classification a fast and affordable strategy. We note that the “negative masking” was also used for identification and improvement of density for RNAP bound to the 30S subunit in our recent work, whereas spherical focus masking was less successful (Demo et al., 2017a). Aided by other biochemical techniques, such as crosslinking analyses, this classification work flow offers an attractive strategy for identifying the conformations of highly mobile elements in the ribosome and other macromolecular complexes, such as spliceosome, where resolving some peripheral components remains a challenge (Shi, 2017).
This work highlights that while critical mechanistic insights can be gleaned at the ribosome core of an ensemble of high-resolution structures (Loveland et al., 2017), the same data set does not provide high resolution for a flexible peripheral protein even after exhaustive classification into up to 48 classes. Our complex contained a short 5′ region of mRNA, which extended 4 nucleotides upstream the Shine-Dalgarno sequence. Stabilization of S1 by interactions with a longer or structured mRNA upstream of the Shine-Dalgarno sequence may result in higher resolution, similar to stabilization of two S1 domains by the extended 15S mitochondrial rRNA (Desai et al., 2017) and by interactions with RNA polymerase (Demo et al., 2017a). Our work is consistent with S1 sampling a continuum of conformational states. Recently, a method termed “manifold embedding” was reported that may better describe this type of structural variation in cryo-EM data (Dashti et al., 2014; Chen and Frank, 2016; Frank and Ourmazd, 2016). So far, manifold embedding has been used to study large-scale changes of the entire ribosome, but it may be applicable to smaller and more mobile parts of the ribosome as well.
Our work shows that the main binding determinant of S1 for the ribosome is the short N-terminal helix, which binds S2 via hydrophobic interactions, in perfect agreement with previous findings (Byrgazov et al., 2015; Desai et al., 2017). While the N-terminal helix is relatively static, the rest of domain 1 is highly dynamic and interacts with S2 in many, but not all, classes. The dynamics of D1 at the S2 binding site is consistent with the recently observed displacement of D1 by the zinc finger of β′ subunit of RNA polymerase (Demo et al., 2017a). D2 of S1 is found in the vicinity of h26 and the 5′ end of the mRNA, and interacts with two highly flexible tails of ribosomal proteins S6 and S18. Our cryo-EM maps are also consistent with binding of the C-terminal domains of S1 to the 5′ end of the mRNA and the 3′ end of 16S rRNA at the mRNA exit channel. The OB domains also appear to sample the 3′ end of the mRNA at the mRNA entrance channel. As such, protein S1 cooperates with other mobile ribosomal protein tails to form proteinaceous mesh, which likely modulates mRNA folding and binding during initiation, as well as dynamics and possibly chemical stability within a polysome during elongation.
Supplementary Material
Figure S1. Close-up view of the only map without the N-terminal helix. The cryo-EM map, low-pass filtered to 6 Å, is shown at 1 σ.
Figure S2. Different “focus” masks (top row) were applied to separate the Empty A or Full A image stacks into 8 classes. For each classification, all 8 classes are shown to highlight differences within the focus area.
Figure S3. Overview of the 15 Classes used for structural interpretation of S1 at the mRNA exit channel. The view is as in Fig. 2B. Class number, particle occupancy and overall resolution in Å are indicated.
Figure S4. Overlapping binding sites of S1 and RNA polymerase on S2.
A) Interaction of loop 2 of D1 (red) with S2 (gold) in Class 1. Residue numbers for S2 are shown in black.
B) Interaction of the zinc finger of RNA polymerase (cyan) with S2 (gold) from PDB: 6AWB is shown in the same view as in A after superposition of S2 from PDB: 6AWB to S2 in Class 1. S2 residues are numbered as in Class 1.
Movie 1: Dynamics of S1 and tails of S6 and S18 at the mRNA exit channel.
Scene 1: Overview of the 70S ribosome from mRNA exit side.
Scene 2: The blue sphere indicates the focus mask used during maximum likelihood classification.
Scene 3: The mRNA exit channel is shown, with S6, S18, mRNA, and the static N-terminal helix of S1 labeled.
Scene 4: Unclassified map from the Full A dataset is shown at 1 σ after filtering to 6 Å.
Scene 5: Difference maps resulting from the dual-mask classification (red). The difference maps were calculated between the Class maps filtered to 6 Å and the Unclassified map. The difference maps are shown at 5 σ.
Scene 6: Models of S1, S6 and S18 fitted to different Classes are shown superimposed. The resulting surface (transparent red) covers the path of mRNA (blue) from the mRNA exit channel.
Highlights.
Deep classification of a large dataset using Frealign 9.11 reveals multiple positions of S1 domains
N-terminal domain of S1 binds S2 via a single short helix
S1 cooperates with mobile tails of S6 and S18
S1 forms a dynamic mesh around the mRNA exit channel
Acknowledgments
We thank members of the Korostelev laboratory for helpful discussions. This study was supported by NIH Grants R01 GM106105 and GM107465 (to A.A.K.) A.B.L. performed this work as a Howard Hughes Medical Institute Fellow of the Helen Hay Whitney Foundation.
Footnotes
Publisher's Disclaimer: This is a PDF file of an unedited manuscript that has been accepted for publication. As a service to our customers we are providing this early version of the manuscript. The manuscript will undergo copyediting, typesetting, and review of the resulting proof before it is published in its final citable form. Please note that during the production process errors may be discovered which could affect the content, and all legal disclaimers that apply to the journal pertain.
Competing interests
The authors declare that there are no conflicts of interest.
Author Contributions
ABL and AAK designed the project; ABL analyzed cryo-EM data; ABL and AAK docked structural models; ABL and AAK wrote the manuscript.
Accession Codes
Cryo-EM maps have been deposited with the Electron Microscopy Database: EMBD-7289. The PDB structural models have been deposited with the RCSB Protein Data Bank: PDB ID 6BU8.
Literature Cited
- Abeyrathne PD, Koh CS, Grant T, Grigorieff N, Korostelev AA. Ensemble cryo-EM uncovers inchworm-like translocation of a viral IRES through the ribosome. eLife. 2016;5:e14874. doi: 10.7554/eLife.14874. [DOI] [PMC free article] [PubMed] [Google Scholar]
- Adams PD, Afonine PV, Bunkóczi G, Chen VB, Echols N, Headd JJ, Hung LW, Jain S, Kapral GJ, Grosse Kunstleve RW, et al. The Phenix software for automated determination of macromolecular structures. Methods (San Diego, Calif) 2011;55:94–106. doi: 10.1016/j.ymeth.2011.07.005. [DOI] [PMC free article] [PubMed] [Google Scholar]
- Agirrezabala X, Liao HY, Schreiner E, Fu J, Ortiz-Meoz RF, Schulten K, Green R, Frank J. Structural Characterization of mRNA-tRNA Translocation Intermediates. PNAS. 2012;109:6094–6099. doi: 10.1073/pnas.1201288109. [DOI] [PMC free article] [PubMed] [Google Scholar]
- Agirrezabala X, Schreiner E, Trabuco LG, Lei J, Ortiz-Meoz RF, Schulten K, Green R, Frank J. Structural insights into cognate versus near-cognate discrimination during decoding: Unique ribosome binding of near-cognate species. The EMBO Journal. 2011;30:1497–1507. doi: 10.1038/emboj.2011.58. [DOI] [PMC free article] [PubMed] [Google Scholar]
- Ahmed T, Shi J, Bhushan S. Unique localization of the plastid-specific ribosomal proteins in the chloroplast ribosome small subunit provides mechanistic insights into the chloroplastic translation. Nucleic Acids Research. 2017 doi: 10.1093/nar/gkx499. [DOI] [PMC free article] [PubMed] [Google Scholar]
- Aliprandi P, Sizun C, Perez J, Mareuil F, Caputo S, Leroy JL, Odaert B, Laalami S, Uzan M, Bontems F. S1 Ribosomal Protein Functions in Translation Initiation and Ribonuclease RegB Activation Are Mediated by Similar RNA-Protein Interactions AN NMR AND SAXS ANALYSIS. J Biol Chem. 2008;283:13289–13301. doi: 10.1074/jbc.M707111200. [DOI] [PubMed] [Google Scholar]
- Arenz S, Abdelshahid M, Sohmen D, Payoe R, Starosta AL, Berninghausen O, Hauryliuk V, Beckmann R, Wilson DN. The stringent factor RelA adopts an open conformation on the ribosome to stimulate ppGpp synthesis. Nucleic Acids Research. 2016 doi: 10.1093/nar/gkw470. gkw470. [DOI] [PMC free article] [PubMed] [Google Scholar]
- Brandt F, Etchells SA, Ortiz JO, Elcock AH, Hartl FU, Baumeister W. The native 3D organization of bacterial polysomes. Cell. 2009;136:261–271. doi: 10.1016/j.cell.2008.11.016. [DOI] [PubMed] [Google Scholar]
- Brilot AF, Korostelev AA, Ermolenko DN, Grigorieff N. Structure of the ribosome with elongation factor G trapped in the pretranslocation state. PNAS. 2013;110:20994–20999. doi: 10.1073/pnas.1311423110. [DOI] [PMC free article] [PubMed] [Google Scholar]
- Brown A, Fernández IS, Gordiyenko Y, Ramakrishnan V. Ribosome-dependent activation of stringent control. Nature. 2016;534:277–280. doi: 10.1038/nature17675. [DOI] [PMC free article] [PubMed] [Google Scholar]
- Bycroft M, Hubbard TJP, Proctor M, Freund SMV, Murzin AG. The Solution Structure of the S1 RNA Binding Domain: A Member of an Ancient Nucleic Acid–Binding Fold. Cell. 1997;88:235–242. doi: 10.1016/s0092-8674(00)81844-9. [DOI] [PubMed] [Google Scholar]
- Byrgazov K, Grishkovskaya I, Arenz S, Coudevylle N, Temmel H, Wilson DN, Djinovic-Carugo K, Moll I. Structural basis for the interaction of protein S1 with the Escherichia coli ribosome. Nucleic Acids Research. 2015;43:661–673. doi: 10.1093/nar/gku1314. [DOI] [PMC free article] [PubMed] [Google Scholar]
- Byrgazov K, Manoharadas S, Kaberdina AC, Vesper O, Moll I. Direct interaction of the N-terminal domain of ribosomal protein S1 with protein S2 in Escherichia coli. PloS One. 2012;7:e32702. doi: 10.1371/journal.pone.0032702. [DOI] [PMC free article] [PubMed] [Google Scholar]
- Cardone G, Heymann JB, Steven AC. One number does not fit all: Mapping local variations in resolution in cryo-EM reconstructions. J Struct Biol. 2013;184:226–236. doi: 10.1016/j.jsb.2013.08.002. [DOI] [PMC free article] [PubMed] [Google Scholar]
- Chapman MS. Restrained real-space macromolecular atomic refinement using a new resolution-dependent electron-density function. Acta Crystallographica Section A. 1995;51:69–80. [Google Scholar]
- Chen B, Frank J. Two promising future developments of cryo-EM: capturing short-lived states and mapping a continuum of states of a macromolecule. Microscopy (Oxford, England) 2016;65:69–79. doi: 10.1093/jmicro/dfv344. [DOI] [PMC free article] [PubMed] [Google Scholar]
- Chen VB, Arendall WB, Headd JJ, Keedy DA, Immormino RM, Kapral GJ, Murray LW, Richardson JS, Richardson DC. MolProbity: all-atom structure validation for macromolecular crystallography. Acta Crystallographica Section D: Biological Crystallography. 2010;66:12–21. doi: 10.1107/S0907444909042073. [DOI] [PMC free article] [PubMed] [Google Scholar]
- Cheng Y. Single-Particle Cryo-EM at Crystallographic Resolution. Cell. 2015;161:450–457. doi: 10.1016/j.cell.2015.03.049. [DOI] [PMC free article] [PubMed] [Google Scholar]
- Czernilofsky AP, Kurland CG, Stöffler G. 30S ribosomal proteins associated with the 3′-terminus of 16S RNA. FEBS letters. 1975;58:281–284. doi: 10.1016/0014-5793(75)80279-1. [DOI] [PubMed] [Google Scholar]
- Dashti A, Schwander P, Langlois R, Fung R, Li W, Hosseinizadeh A, Liao HY, Pallesen J, Sharma G, Stupina VA, et al. Trajectories of the ribosome as a Brownian nanomachine. PNAS. 2014;111:17492–17497. doi: 10.1073/pnas.1419276111. [DOI] [PMC free article] [PubMed] [Google Scholar]
- DeLano WL. The PyMOL Molecular Graphics System. Palo Alto, CA, USA: DeLano Scientific; 2002. [Google Scholar]
- Delvillani F, Papiani G, Dehò G, Briani F. S1 ribosomal protein and the interplay between translation and mRNA decay. Nucleic Acids Research. 2011;39:7702–7715. doi: 10.1093/nar/gkr417. [DOI] [PMC free article] [PubMed] [Google Scholar]
- Demo G, Rasouly A, Vasilyev N, Svetlov V, Loveland AB, Diaz-Avalos R, Grigorieff N, Nudler E, Korostelev AA. Structure of RNA polymerase bound to ribosomal 30S subunit. eLife. 2017a;6:e28560. doi: 10.7554/eLife.28560. [DOI] [PMC free article] [PubMed] [Google Scholar]
- Demo G, Svidritskiy E, Madireddy R, Diaz-Avalos R, Grant T, Grigorieff N, Sousa D, Korostelev AA. Mechanism of ribosome rescue by ArfA and RF2. eLife. 2017b;6:e23687. doi: 10.7554/eLife.23687. [DOI] [PMC free article] [PubMed] [Google Scholar]
- Desai N, Brown A, Amunts A, Ramakrishnan V. The structure of the yeast mitochondrial ribosome. Science (New York, NY) 2017;355:528–531. doi: 10.1126/science.aal2415. [DOI] [PMC free article] [PubMed] [Google Scholar]
- Draper DE, von Hippel PH. Interaction of Escherichia coli ribosomal protein S1 with ribosomes. PNAS. 1979;76:1040–1044. doi: 10.1073/pnas.76.3.1040. [DOI] [PMC free article] [PubMed] [Google Scholar]
- Duval M, Korepanov A, Fuchsbauer O, Fechter P, Haller A, Fabbretti A, Choulier L, Micura R, Klaholz BP, Romby P, et al. Escherichia coli ribosomal protein S1 unfolds structured mRNAs onto the ribosome for active translation initiation. PLoS biology. 2013;11:e1001731. doi: 10.1371/journal.pbio.1001731. [DOI] [PMC free article] [PubMed] [Google Scholar]
- Fernández IS, Bai XC, Murshudov G, Scheres SHW, Ramakrishnan V. Initiation of translation by cricket paralysis virus IRES requires its translocation in the ribosome. Cell. 2014;157:823–831. doi: 10.1016/j.cell.2014.04.015. [DOI] [PMC free article] [PubMed] [Google Scholar]
- Fischer N, Neumann P, Bock LV, Maracci C, Wang Z, Paleskava A, Konevega AL, Schröder GF, Grubmüller H, Ficner R, et al. The pathway to GTPase activation of elongation factor SelB on the ribosome. Nature. 2016;540:80–85. doi: 10.1038/nature20560. [DOI] [PubMed] [Google Scholar]
- Fischer N, Neumann P, Konevega AL, Bock LV, Ficner R, Rodnina MV, Stark H. Structure of the E. coli ribosome-EF-Tu complex at <3 A resolution by Cs-corrected cryo-EM. Nature. 2015;520:567–570. doi: 10.1038/nature14275. [DOI] [PubMed] [Google Scholar]
- Frank J, Ourmazd A. Continuous changes in structure mapped by manifold embedding of single-particle data in cryo-EM. Methods (San Diego, Calif) 2016;100:61–67. doi: 10.1016/j.ymeth.2016.02.007. [DOI] [PMC free article] [PubMed] [Google Scholar]
- Gabashvili IS, Agrawal RK, Spahn CMT, Grassucci RA, Svergun DI, Frank J, Penczek P. Solution Structure of the E. coli 70S Ribosome at 11.5 Å Resolution. Cell. 2000;100:537–549. doi: 10.1016/s0092-8674(00)80690-x. [DOI] [PubMed] [Google Scholar]
- Giraud P, Créchet JB, Uzan M, Bontems F, Sizun C. Resonance assignment of the ribosome binding domain of E. coli ribosomal protein S1. Biomolecular NMR Assignments. 2015;9:107–111. doi: 10.1007/s12104-014-9554-2. [DOI] [PubMed] [Google Scholar]
- Giri L, Subramanian AR. Hydrodynamic properties of protein S1 from Escherichia coli ribosome. FEBS letters. 1977;81:199–203. doi: 10.1016/0014-5793(77)80958-7. [DOI] [PubMed] [Google Scholar]
- Grigorieff N. In: Frealign: An Exploratory Tool for Single-Particle Cryo-EM. Enzymology B-Mi., editor. Academic Press; 2016. [DOI] [PMC free article] [PubMed] [Google Scholar]
- Heymann JB, Belnap DM. Bsoft: Image processing and molecular modeling for electron microscopy. J Struct Biol. 2007;157:3–18. doi: 10.1016/j.jsb.2006.06.006. [DOI] [PubMed] [Google Scholar]
- Hitz H, Schäfer D, Wittmann-Liebold B. Determination of the complete amino-acid sequence of protein S6 from the wild-type and a mutant of Escherichia coli. European Journal of Biochemistry. 1977;75:497–512. doi: 10.1111/j.1432-1033.1977.tb11551.x. [DOI] [PubMed] [Google Scholar]
- Jakobi AJ, Wilmanns M, Sachse C. Model-based local density sharpening of cryo-EM maps. eLife. 2017;6:e27131. doi: 10.7554/eLife.27131. [DOI] [PMC free article] [PubMed] [Google Scholar]
- James NR, Brown A, Gordiyenko Y, Ramakrishnan V. Translational termination without a stop codon. Science (New York, NY) 2016;354:1437–1440. doi: 10.1126/science.aai9127. [DOI] [PMC free article] [PubMed] [Google Scholar]
- Kang WK, Icho T, Isono S, Kitakawa M, Isono K. Characterization of the gene rimK responsible for the addition of glutamic acid residues to the C-terminus of ribosomal protein S6 in Escherichia coli K12. Molecular & general genetics: MGG. 1989;217:281–288. doi: 10.1007/BF02464894. [DOI] [PubMed] [Google Scholar]
- Kenner RA. A protein-nucleic acid crosslink in 30s ribosomes. Biochemical and Biophysical Research Communications. 1973;51:932–938. doi: 10.1016/0006-291x(73)90016-8. [DOI] [PubMed] [Google Scholar]
- Khanh NQ, Linde R, Manderschied U, Gassen HG. Function of the ribosomal protein S1 in initiation and elongation of bacterial protein synthesis. Methods in Enzymology. 1979;60:426–436. doi: 10.1016/s0076-6879(79)60041-1. [DOI] [PubMed] [Google Scholar]
- Korostelev A, Bertram R, Chapman MS. Simulated-annealing real-space refinement as a tool in model building. Acta Crystallogr D Biol Crystallogr. 2002;58:761–767. doi: 10.1107/s0907444902003402. [DOI] [PubMed] [Google Scholar]
- Labischinski H, Subramanian AR. Protein S1 from Escherichia coli ribosomes: an improved isolation procedure and shape determination by small-angle X-ray scattering. European Journal of Biochemistry. 1979;95:359–366. doi: 10.1111/j.1432-1033.1979.tb12973.x. [DOI] [PubMed] [Google Scholar]
- Lauber MA, Rappsilber J, Reilly JP. Dynamics of ribosomal protein S1 on a bacterial ribosome with cross-linking and mass spectrometry. Molecular & cellular proteomics: MCP. 2012;11:1965–1976. doi: 10.1074/mcp.M112.019562. [DOI] [PMC free article] [PubMed] [Google Scholar]
- Laughrea M, Moore PB. Physical properties of ribosomal protein S1 and its interaction with the 30 S ribosomal subunit of Escherichia coli. Journal of Molecular Biology. 1977;112:399–421. doi: 10.1016/s0022-2836(77)80189-7. [DOI] [PubMed] [Google Scholar]
- Laurberg M, Asahara H, Korostelev A, Zhu J, Trakhanov S, Noller HF. Structural basis for translation termination on the 70S ribosome. Nature. 2008;454:852–857. doi: 10.1038/nature07115. [DOI] [PubMed] [Google Scholar]
- Little RH, Grenga L, Saalbach G, Howat AM, Pfeilmeier S, Trampari E, Malone JG. Adaptive Remodeling of the Bacterial Proteome by Specific Ribosomal Modification Regulates Pseudomonas Infection and Niche Colonisation. PLoS genetics. 2016;12:e1005837. doi: 10.1371/journal.pgen.1005837. [DOI] [PMC free article] [PubMed] [Google Scholar]
- Liu Z, Gutierrez-Vargas C, Wei J, Grassucci RA, Ramesh M, Espina N, Sun M, Tutuncuoglu B, Madison-Antenucci S, Woolford JL, et al. Structure and assembly model for the Trypanosoma cruzi 60S ribosomal subunit. PNAS. 2016;113:12174–12179. doi: 10.1073/pnas.1614594113. [DOI] [PMC free article] [PubMed] [Google Scholar]
- Loveland AB, Bah E, Madireddy R, Zhang Y, Brilot AF, Grigorieff N, Korostelev AA. Ribosome•RelA structures reveal the mechanism of stringent response activation. eLife. 2016;5:e17029. doi: 10.7554/eLife.17029. [DOI] [PMC free article] [PubMed] [Google Scholar]
- Loveland AB, Demo G, Grigorieff N, Korostelev AA. Ensemble cryo-EM elucidates the mechanism of translation fidelity. Nature. 2017;546:113–117. doi: 10.1038/nature22397. [DOI] [PMC free article] [PubMed] [Google Scholar]
- Lyumkis D, Brilot AF, Theobald DL, Grigorieff N. Likelihood-based classification of cryo-EM images using FREALIGN. J Struct Biol. 2013;183:377–388. doi: 10.1016/j.jsb.2013.07.005. [DOI] [PMC free article] [PubMed] [Google Scholar]
- Martin AJM, Walsh I, Tosatto SCE. MOBI: a web server to define and visualize structural mobility in NMR protein ensembles. Bioinformatics (Oxford, England) 2010;26:2916–2917. doi: 10.1093/bioinformatics/btq537. [DOI] [PubMed] [Google Scholar]
- Mastronarde DN. Automated electron microscope tomography using robust prediction of specimen movements. J Struct Biol. 2005;152:36–51. doi: 10.1016/j.jsb.2005.07.007. [DOI] [PubMed] [Google Scholar]
- McGinness KE, Sauer RT. Ribosomal protein S1 binds mRNA and tmRNA similarly but plays distinct roles in translation of these molecules. PNAS. 2004;101:13454–13459. doi: 10.1073/pnas.0405521101. [DOI] [PMC free article] [PubMed] [Google Scholar]
- Nesterchuk MV, Sergiev PV, Dontsova OA. Posttranslational Modifications of Ribosomal Proteins in Escherichia coli. Acta Naturae. 2011;3:22–33. [PMC free article] [PubMed] [Google Scholar]
- Nogales E, Scheres, Sjors HW. Cryo-EM: A Unique Tool for the Visualization of Macromolecular Complexity. Mol Cell. 2015;58:677–689. doi: 10.1016/j.molcel.2015.02.019. [DOI] [PMC free article] [PubMed] [Google Scholar]
- Park E, Ménétret JF, Gumbart JC, Ludtke SJ, Li W, Whynot A, Rapoport TA, Akey CW. Structure of the SecY channel during initiation of protein translocation. Nature. 2014;506:102–106. doi: 10.1038/nature12720. [DOI] [PMC free article] [PubMed] [Google Scholar]
- Pettersen EF, Goddard TD, Huang CC, Couch GS, Greenblatt DM, Meng EC, Ferrin TE. UCSF Chimera—A visualization system for exploratory research and analysis. Journal of Computational Chemistry. 2004;25:1605–1612. doi: 10.1002/jcc.20084. [DOI] [PubMed] [Google Scholar]
- Polikanov YS, Steitz TA, Innis CA. A proton wire to couple aminoacyl-tRNA accommodation and peptide-bond formation on the ribosome. Nature Structural & Molecular Biology. 2014;21:787–793. doi: 10.1038/nsmb.2871. [DOI] [PMC free article] [PubMed] [Google Scholar]
- Potapov AP, Subramanian AR. Effect of E. coli ribosomal protein S1 on the fidelity of the translational elongation step: reading and misreading of poly(U) and poly(dT) Biochemistry International. 1992;27:745–753. [PubMed] [Google Scholar]
- Qu X, Lancaster L, Noller HF, Bustamante C, Tinoco I. Ribosomal protein S1 unwinds double-stranded RNA in multiple steps. PNAS. 2012;109:14458–14463. doi: 10.1073/pnas.1208950109. [DOI] [PMC free article] [PubMed] [Google Scholar]
- Saguy M, Gillet R, Skorski P, Hermann-Le Denmat S, Felden B. Ribosomal protein S1 influences trans-translation in vitro and in vivo. Nucleic Acids Research. 2007;35:2368–2376. doi: 10.1093/nar/gkm100. [DOI] [PMC free article] [PubMed] [Google Scholar]
- Salah P, Bisaglia M, Aliprandi P, Uzan M, Sizun C, Bontems F. Probing the relationship between Gram-negative and Gram-positive S1 proteins by sequence analysis. Nucleic Acids Research. 2009;37:5578–5588. doi: 10.1093/nar/gkp547. [DOI] [PMC free article] [PubMed] [Google Scholar]
- Scheres SHW. RELION: Implementation of a Bayesian approach to cryo-EM structure determination. J Struct Biol. 2012;180:519–530. doi: 10.1016/j.jsb.2012.09.006. [DOI] [PMC free article] [PubMed] [Google Scholar]
- Scheres SHW, Gao H, Valle M, Herman GT, Eggermont PPB, Frank J, Carazo JM. Disentangling conformational states of macromolecules in 3D-EM through likelihood optimization. Nat Meth. 2007;4:27–29. doi: 10.1038/nmeth992. [DOI] [PubMed] [Google Scholar]
- Sengupta J, Agrawal RK, Frank J. Visualization of protein S1 within the 30S ribosomal subunit and its interaction with messenger RNA. PNAS. 2001;98:11991–11996. doi: 10.1073/pnas.211266898. [DOI] [PMC free article] [PubMed] [Google Scholar]
- Shi Y. The Spliceosome: A Protein-Directed Metalloribozyme. Journal of Molecular Biology. 2017;429:2640–2653. doi: 10.1016/j.jmb.2017.07.010. [DOI] [PubMed] [Google Scholar]
- Sillers IY, Moore PB. Position of protein S1 in the 30 S ribosomal subunit of Escherichia coli. Journal of Molecular Biology. 1981;153:761–780. doi: 10.1016/0022-2836(81)90417-4. [DOI] [PubMed] [Google Scholar]
- Sørensen MA, Fricke J, Pedersen S. Ribosomal protein S1 is required for translation of most, if not all, natural mRNAs in Escherichia coli in vivo. Journal of Molecular Biology. 1998;280:561–569. doi: 10.1006/jmbi.1998.1909. [DOI] [PubMed] [Google Scholar]
- Subramanian AR. Structure and functions of ribosomal protein S1. Progress in Nucleic Acid Research and Molecular Biology. 1983;28:101–142. doi: 10.1016/s0079-6603(08)60085-9. [DOI] [PubMed] [Google Scholar]
- Sukhodolets MV, Garges S. Interaction of Escherichia coli RNA Polymerase with the Ribosomal Protein S1 and the Sm-like ATPase Hfq. Biochemistry. 2003;42:8022–8034. doi: 10.1021/bi020638i. [DOI] [PubMed] [Google Scholar]
- Sukhodolets MV, Garges S, Adhya S. Ribosomal protein S1 promotes transcriptional cycling. RNA. 2006;12:1505–1513. doi: 10.1261/rna.2321606. [DOI] [PMC free article] [PubMed] [Google Scholar]
- Takeshita D, Yamashita S, Tomita K. Molecular insights into replication initiation by Qβ replicase using ribosomal protein S1. Nucleic Acids Research. 2014;42:10809–10822. doi: 10.1093/nar/gku745. [DOI] [PMC free article] [PubMed] [Google Scholar]
- Tang G, Peng L, Baldwin PR, Mann DS, Jiang W, Rees I, Ludtke SJ. EMAN2: an extensible image processing suite for electron microscopy. J Struct Biol. 2007;157:38–46. doi: 10.1016/j.jsb.2006.05.009. [DOI] [PubMed] [Google Scholar]
- Tedin K, Resch A, Bläsi U. Requirements for ribosomal protein S1 for translation initiation of mRNAs with and without a 5′ leader sequence. Molecular Microbiology. 1997;25:189–199. doi: 10.1046/j.1365-2958.1997.4421810.x. [DOI] [PubMed] [Google Scholar]
- Yang J, Yan R, Roy A, Xu D, Poisson J, Zhang Y. The I-TASSER Suite: protein structure and function prediction. Nat Meth. 2015;12:7–8. doi: 10.1038/nmeth.3213. [DOI] [PMC free article] [PubMed] [Google Scholar]
- Zhao G, Jin Z, Wang Y, Allewell NM, Tuchman M, Shi D. Structure and function of Escherichia coli RimK, an ATP-grasp fold, L-glutamyl ligase enzyme. Proteins. 2013;81:1847–1854. doi: 10.1002/prot.24311. [DOI] [PubMed] [Google Scholar]
- Zhou G, Wang J, Blanc E, Chapman MS. Determination of the relative precision of atoms in a macromolecular structure. Acta Crystallographica Section D, Biological Crystallography. 1998;54:391–399. doi: 10.1107/s0907444997011530. [DOI] [PubMed] [Google Scholar]
Associated Data
This section collects any data citations, data availability statements, or supplementary materials included in this article.
Supplementary Materials
Figure S1. Close-up view of the only map without the N-terminal helix. The cryo-EM map, low-pass filtered to 6 Å, is shown at 1 σ.
Figure S2. Different “focus” masks (top row) were applied to separate the Empty A or Full A image stacks into 8 classes. For each classification, all 8 classes are shown to highlight differences within the focus area.
Figure S3. Overview of the 15 Classes used for structural interpretation of S1 at the mRNA exit channel. The view is as in Fig. 2B. Class number, particle occupancy and overall resolution in Å are indicated.
Figure S4. Overlapping binding sites of S1 and RNA polymerase on S2.
A) Interaction of loop 2 of D1 (red) with S2 (gold) in Class 1. Residue numbers for S2 are shown in black.
B) Interaction of the zinc finger of RNA polymerase (cyan) with S2 (gold) from PDB: 6AWB is shown in the same view as in A after superposition of S2 from PDB: 6AWB to S2 in Class 1. S2 residues are numbered as in Class 1.
Movie 1: Dynamics of S1 and tails of S6 and S18 at the mRNA exit channel.
Scene 1: Overview of the 70S ribosome from mRNA exit side.
Scene 2: The blue sphere indicates the focus mask used during maximum likelihood classification.
Scene 3: The mRNA exit channel is shown, with S6, S18, mRNA, and the static N-terminal helix of S1 labeled.
Scene 4: Unclassified map from the Full A dataset is shown at 1 σ after filtering to 6 Å.
Scene 5: Difference maps resulting from the dual-mask classification (red). The difference maps were calculated between the Class maps filtered to 6 Å and the Unclassified map. The difference maps are shown at 5 σ.
Scene 6: Models of S1, S6 and S18 fitted to different Classes are shown superimposed. The resulting surface (transparent red) covers the path of mRNA (blue) from the mRNA exit channel.