

Abstract
Introduction
Maintaining stability, especially in the mediolateral direction, is important for successful walking. Navigating in the community, however, may require people to reduce stability to make quick lateral transitions, creating a tradeoff between stability and maneuverability. Walking slower can improve stability during steady state walking, but there remains a need to better understand how walking speed influences maneuverability. This study investigated how walking at different speeds influenced how individuals modulate both stability and maneuverability in a virtual obstacle course.
Methods
Fifteen healthy adults walked on a treadmill in a virtual environment for 6 trials each at typical and slower speed. Participants made repeated transitions between virtual sets of arches displayed in any of 4 lanes. Participants were instructed to walk under the arches and hit as few arches as possible. To quantify stability, mean step width and mean lateral margin of stability (Mean MOS) were calculated and averaged for ipsilateral and contralateral steps. To quantify maneuverability, the number of arches hit when entering or exiting each arch set was calculated and averaged for each condition.
Results
Participants exhibited high levels of variability in their stepping patterns. Mean MOS and mean step width were significantly greater for the typical speed than slower speed for the ipsilateral steps (p < 0.001). Participants hit more arches during the typical speed than during the slow speed (p = 0.039).
Conclusion
When walking at the slower speed, healthy individuals exhibited decreased stability of ipsilateral steps, but increased maneuverability and better transition performance.
Keywords: maneuverability, walking speed, margin of stability, lateral transitions
Introduction
When walking, it is important to maintain stability, particularly in the mediolateral direction [1, 2]. Having greater stability means reducing the effects of perturbing forces on one’s center of mass (COM), thereby resisting movement [3, 4]. When navigating through crowded areas however, people often must make quick lateral transitions that require controlled, rapid movement. These maneuvers might be anticipated (e.g., around some fixed object) or unanticipated (e.g., in reaction to a person or object suddenly coming into one’s path). These tasks are performed by shifting one’s COM towards a new direction, which effectively reduces one’s resistance to perturbations applied in that direction. This reduced stability can help facilitate completing such lateral maneuvers, but also creates a tradeoff between stability and maneuverability. This tradeoff has been studied in animals [5–9], but only a few studies have applied this important paradigm to humans [10, 11]. For people to successfully navigate in the community, they must be able to quickly and effectively shift between strategies that favor stability and those that favor maneuverability.
Margin of stability in the mediolateral direction (MOSML) can quantify lateral stability during locomotor tasks [12–14]. MOSML is proportional to the amount of force needed to move the COM outside of the base of support (BOS) [15]. Strategies that favor stability then, as defined by MOSML, involve resisting perturbations and keeping COM within one’s BOS. MOSML may also elucidate aspects of maneuverability. Reducing resistance to perturbations by changing COM position in a controlled and efficient manner helps facilitate maneuvers. By narrowing step width and decreasing the BOS, people can more easily shift their COM to make lateral transitions. According to Wu et al. [10], people decrease their MOSML in the direction of the movement in preparation of making a lateral maneuver. A decrease in MOSML on a given side when walking indicates less resistance to perturbations which facilitates making maneuvers in that direction. Therefore, a larger MOSML reflects greater stability, while a smaller MOSML suggests greater maneuverability.
Slower walking speeds are generally considered to be more stable as determined by step kinematics [16] and dynamic stability measures [17–20]. This is especially seen in older and impaired populations, where slow walking is a nearly universal characteristic of cautious gait [21]. Few studies have examined how MOSML changes with walking speed, or how people prioritize stability and maneuverability at different walking speeds. Gates et al. [22] found that when young, healthy individuals walked at faster speeds, they did so with larger MOSML. Thus at faster speeds, individuals may be more stable but less maneuverable. However, those individuals did not perform a task that required them to execute lateral maneuvers. Therefore, we cannot determine how walking speed might have influenced their maneuverability.
Previous studies largely focused on steady state walking, a task that does not require rapid, lateral movements. It is unknown how people at a typical or slower walking speed shift their MOSML when making lateral transitions. Thus, there is a need to better understand how lateral transitions and walking speed each influence stability and maneuverability. This study determined how healthy individuals modulate their maneuverability and stability while navigating a virtual reality obstacle course at different speeds. We hypothesized that at slower speeds, individuals would be more maneuverable as indicated by a smaller MOSML and would exhibit better lateral transition performance.
Methods
Participants
Fifteen young, healthy adults (Table 1) participated. All participants were screened to ensure they had no medical or psychological conditions that would alter normal gait, uncorrected visual impairment, or pregnancy. All data were collected within a single assessment. All procedures were approved by the Brooke Army Medical Center Institutional Review Board and all participants completed written informed consent prior to participation.
Table 1.
Participant characteristics. All values except Sex are given as Mean ± Standard Deviation.
| Characteristic: | Value: |
|---|---|
| Sex | 11 M/4 F |
| Age (years) | 25.93 ± 5.25 |
| Body Height (m) | 1.72 ± 0.09 |
| Body Mass (kg) | 74.41± 14.57 |
Protocol
All participants walked in a virtual reality environment (Computer Assisted Rehabilitation ENvironment; Motekforce Link, Amsterdam, Netherlands) which included a 1.8 × 2.8 m treadmill within a 7 m dome allowing 300 degrees of virtual reality display. The virtual reality scene included a walking path divided into four distinct lanes that equated to 27 cm wide each in the real-world (Fig. 1). Each trial contained a total of 17 projected arch sets, requiring 16 transitions. The 16 transitions were made up of a random presentation of 1 or 2 lane transitions to the left or the right with a total of 4 of each combination (Fig. 1B). A virtual avatar whose diameter was 35% of the width of a lane was projected onto the screen, representing the lateral position of the centroid of two markers attached to the participant’s pelvis. Participants were instructed to navigate the avatar through the arch sets hitting as few arches as possible. The movement of the participant was scaled to 75% within the virtual environment to account for the amount of excursion and visual distortion. To maintain ecologic validity, we did not constrain the execution of the transitions. Thus, participants were able to choose whatever stepping pattern they wanted to make each maneuver. See video files in Supplementary Material for examples of a participant performing this task.
Figure 1.
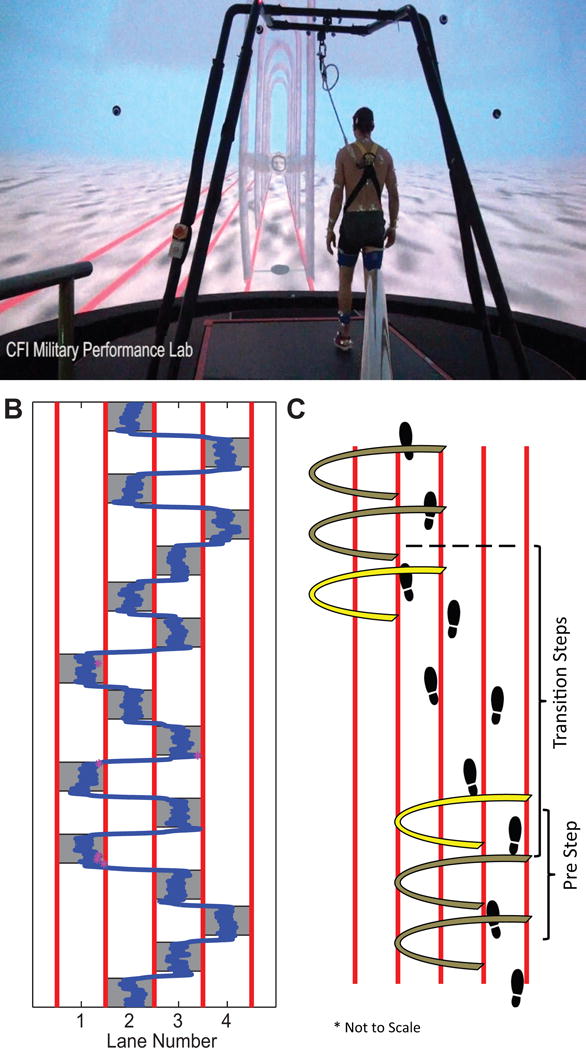
The virtual obstacle course task. A) Screenshot of a typical participant completing the virtual obstacle course. B) Example of the avatar path through the arch sets during a trial. Direction of travel is from bottom to top. The avatar trajectory is marked in blue and the arch sets are indicated by the gray boxes. C) Schematic (not to scale) of a possible stepping pattern during a transition. The yellow arches indicate the beginning and end of the transition zone. A collision of the avatar with either of these arches constituted an unsuccessful transition. The transition variables were analyzed across all transition steps from the last step originating in the initial arch set to the first step terminating in the new arch set.
All participants walked on the treadmill at two different speeds: 0.9 m/s reflecting a slower speed and 1.2 m/s reflecting a typical walking speed [23]. Because the transition zones at both speeds were the same fixed distance (1.78 m), participants had less time to make each transition at the typical speed. Arch sets were long enough to allow participants more than ample time to reestablish balance after each transition. To represent different types of real-world scenarios that require lateral transitions, we presented participants with 2 types of transitions: “anticipation” where each upcoming arch set was visible ahead of time and “reaction” where each upcoming arch was not visible until the participant exited the current arch set.
To account for differences in the placement of the pelvis markers, we aligned the virtual scene by centering it to the participant while they stood in the middle of the treadmill. Participants completed two 3-minute practice trials at 0.9 m/s to familiarize themselves with the task. They then completed 3 trials of each condition, walking for 6 trials at 0.9 m/s then repeating the same 6 trials at 1.2 m/s with rest between the slow and typical speeds. The presentation of the reaction and anticipation conditions was randomized and counter-balanced across participants.
For all trials, full body kinematic data were collected at 120 Hz using a 27-camera Vicon motion capture system (Vicon Motion Systems, Oxford, UK). The cameras tracked the trajectories of 57 markers affixed to the participant’s body segments [24]. The marker positions and digitized locations of joint centers were combined to create a 13-segment model using Visual 3D (C-Motion Inc., Germantown, MD).
Data Processing and Analysis
Marker position data were filtered with a 4th order low-pass Butterworth filter with a 6 Hz cut-off frequency. Relevant metrics were extracted and further analyzed using Visual 3D and Matlab 2012b (Mathworks Inc., Natick, MA). The transition zone was defined as the area between the end of one arch set and the beginning of the next (Fig. 1C). Steps were divided into ipsilateral steps (taken in the same direction as the transition), and contralateral steps (taken in the opposite direction of the transition).
MOSML was calculated as the minimum lateral distance between the extrapolated center of mass and the edge of the BOS during the stance phase of each step [10, 12, 22]. The extrapolated center of mass was determined using the velocity of the center of mass, and the base of support was defined as the lateral boundary estimated by the position of the 5th metatarsal marker. Step width was defined as the mediolateral distance between the heel markers at heel strike. For each trial, MOSML and step widths were averaged separately for contralateral and ipsilateral steps across all steps taken in the transition zones.
To quantify transition performance, Response Time was defined as the time elapsed between the participant exiting the last arch of a set and exiting their current lane. We also determined the total number of unsuccessful transitions across all trials. A transition was deemed unsuccessful if the avatar collided with the last arch when exiting a lane or collided with the first arch when entering a new lane. The total number of steps during the transition was also quantified.
Statistical Analyses
As no significant asymmetries were observed for the young, healthy population, we pooled the data from transitions to both left and right directions. To simplify analyses, we also only analyzed the more difficult 2-lane transitions. All statistical analyses were run on this reduced dataset. For Mean MOSML and step width, 2 factor (Speed × Side (ipsilateral vs. contralateral)) ANOVAs with repeated measures were run separately for the anticipation and reaction conditions. Post-hoc analysis with Bonferroni Holm’s corrections were conducted when applicable, with alpha=0.05. For the performance variables, Response Time, unsuccessful transitions, and number of steps, single-factor (Speed) ANOVAs with repeated measures were run separately for the anticipation and reaction conditions.
Results
Because we purposefully did not constrain how participants could execute each transition, they exhibited high levels of variability in their stepping patterns (Fig. 2) within and across subjects as well as throughout the transitions. This included variability in the phase of the gait cycle that the participant was in when exiting the last arch of each set and in subsequent foot placements throughout each transition. Despite this variability, specific trends did emerge.
Figure 2.
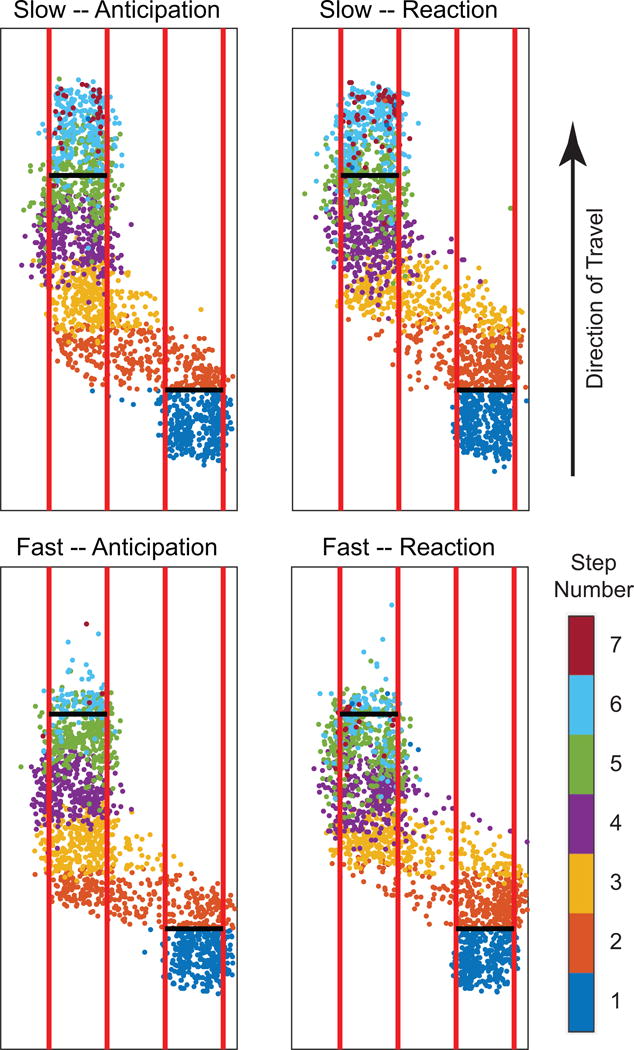
Footfall locations for all 2-lane transitions for all participants for each of the 4 conditions tested. Step 1 indicates the last step taken within the arch set being exited. Participants completed transitions in typically ~5–7 steps. The figure illustrates the high level of within and between subject variability in the stepping patterns used during the transitions.
During both conditions, ipsilateral and contralateral limbs executed different steps to complete each transition (Fig. 3). Contralateral limbs generally took steps with small-to-negative MOSML and very narrow step widths, while ipsilateral limbs generally took steps with increased MOSML and much wider step widths (Fig. 3).
Figure 3.
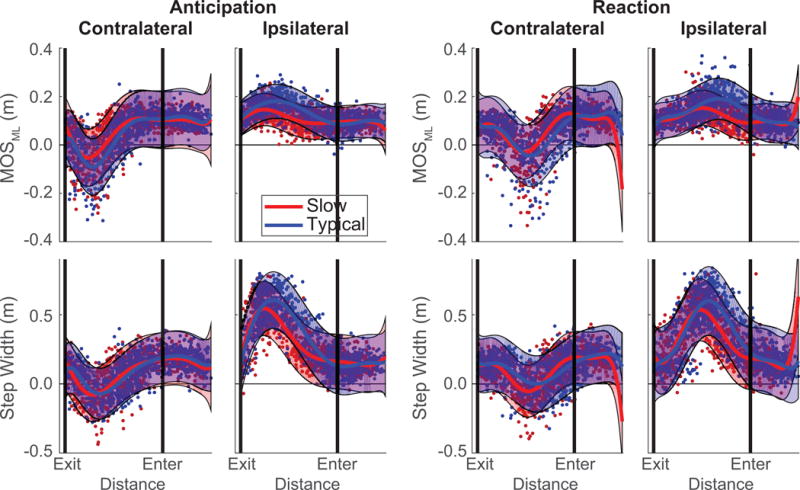
Trends in stepping variables (MOSML and Step Width) both across observations and throughout the transition execution. In each plot, the horizontal axis indicates distance traveled (forward progression is from left to right). The vertical black lines define the transition zone: participants Exit one arch set at the first line and then Enter the next arch set (1.78 m later) at the second line. Individual points indicate values of either MOSML and Step Width for each step for all participants plotted at the time point in the transition that the step occurred. Solid lines represent 7th order polynomial fits to the stepping data, each shown with a 95% confidence band reflecting the general pattern across the transition. The Slow steps are plotted in red and the Typical are plotted in blue.
For both anticipation and reaction conditions, ipsilateral steps exhibited significantly greater Mean MOSML than contralateral steps (p < 0.001) (Fig. 4A). The main effect for Speed was not significant for the anticipation condition (p = 0.121), but neared significance for the reaction condition (p = 0.053). However, there were also significant Speed × Limb interaction effects for Mean MOSML for both conditions (p ≤ 0.002). Pairwise comparisons revealed significantly larger Mean MOSML at typical compared to slow speeds for ipsilateral steps (p < 0.001), but no differences for contralateral steps (p ≥ 0.775).
Figure 4.
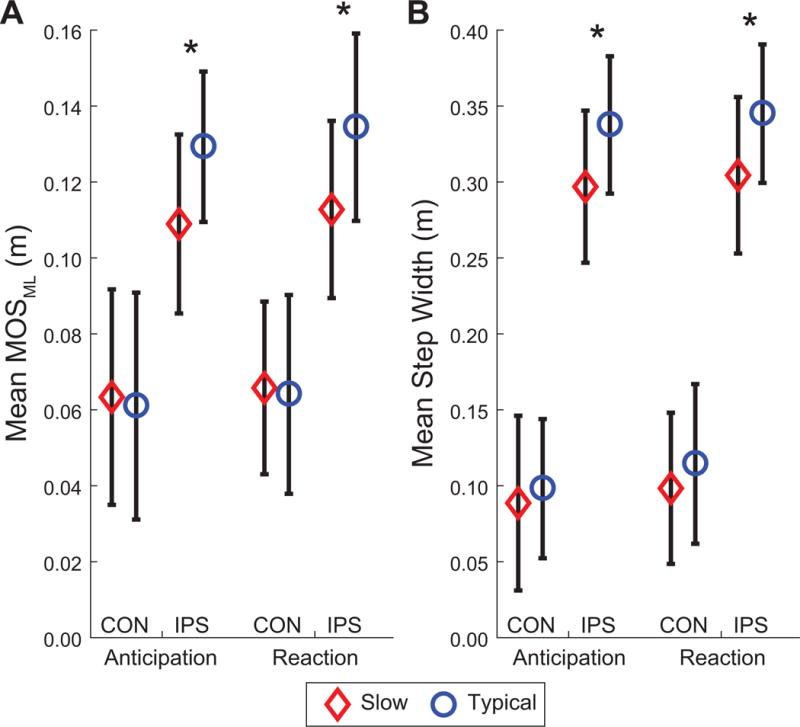
Group mean ± SD for variables calculated across all steps of the transition. (A) Average mediolateral margin of stability (Mean MOSML) and (B) mean Step Width. Slow speed is indicated by red diamonds and Typical speed is indicated by blue circles. Main effects differences for Side (Contralateral (CON) vs. Ipsilateral (IPS)) were highly significant (p < 0.001) for all comparisons. Main effects differences for Speed (Slow vs. Typical) were not significant for Mean MOSML for Anticipation trials (p = 0.121), approached significance for Mean MOSML for Reaction trials (p = 0.053) and were significant for Mean Step Width for Reaction trials (p = 0.020). Speed × Side interaction effects were significant (p ≤ 0.002) for all comparisons. Pairwise comparisons revealed significant (p ≤ 0.026) Speed differences for all Ipsilateral (IPS) steps (indicated by stars: *).
For both anticipation and reaction conditions, ipsilateral steps also exhibited significantly greater mean step widths than contralateral steps (p < 0.001) (Fig. 4B). Main effects for Speed neared significance for the anticipation condition (p = 0.072) and were significant for the reaction condition (p = 0.020). However, there were also significant Speed × Limb interaction effects for both conditions (p ≤ 0.001). Pairwise comparisons revealed significantly larger mean step widths at typical compared to slow speeds for ipsilateral steps (p ≤ 0.026), but no differences for contralateral steps (p ≥ 0.380).
Participants exited their lane faster at the typical speed than at the slow speed in both the reaction (p < 0.001) and anticipation (p = 0.002) conditions (Fig. 5A). In the reaction condition, participants were more unsuccessful when walking at the faster typical speed (p = 0.039; Fig. 5B). In both conditions, participants took fewer steps at the faster typical speed than at the slow speed (p < 0.001; Fig. 5C).
Figure 5.
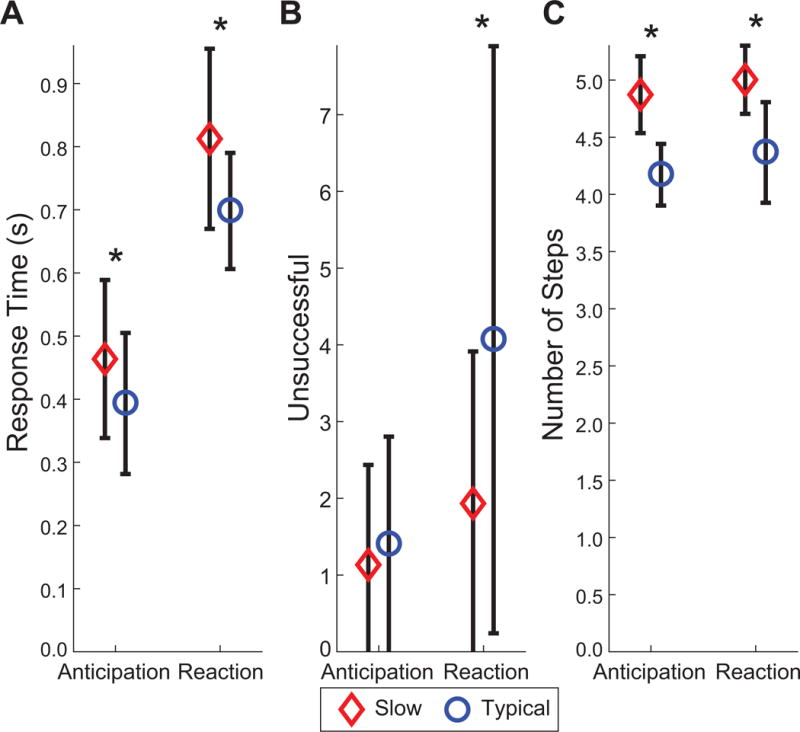
Group mean ± SD for transition performance variables. (A) Response Times were quantified as the amount of time between exiting the last arch in a set and exiting their current lane. (B) Total number of unsuccessful transitions where the participant collided with the first or last arch defining the transition zone. (C) Total number of steps taken across each transition zone. Slow speed is indicated by red diamonds and Typical speed is indicated by blue circles. Stars (*) indicate significant differences. Slow speeds led to slower response times (p ≤ 0.002) for both conditions, more unsuccessful trials (p = 0.039) for Reaction trials, and more steps taken (p < 0.001) for both conditions.
Discussion
The results support our hypothesis that individuals would be more maneuverable at the slower speed. During the reaction condition at the slow speed, individuals adopted strategies on the ipsilateral side that were more conducive to maneuverability than to stability, as indicated by a lower mean MOSML, narrower step width, and fewer unsuccessful transitions. When walking at the slow speed, individuals appeared to better control their COM motion and step width to successfully transition.
During both anticipation and reaction transitions, when walking at the slower speed, participants exhibited smaller mean MOSML on the ipsilateral side, supporting our hypothesis. This suggests that for the ipsilateral steps, participants decreased their BOS when walking at the slow speed as indicated by a decreased step width, which can decrease MOSML [15, 25]. However, lateral COM velocity also contributes to MOSML. Past studies found that trunk sway and COM motion decreased at slower speeds [26, 27] which would potentially increase MOSML. It is likely the changes in BOS on the ipsilateral side were large relative to the changes in COM motion, thus reducing the overall MOSML at the slow speed. An overall decrease in MOSML suggests that at slower speeds, individuals’ walking patterns were more unstable, but also more conducive to maneuverability during both conditions.
Individuals also took significantly narrower steps at the slow speed during both anticipation and reaction conditions at the ipsilateral side. These narrower steps suggest individuals were less stable at the slower speed, further supporting our hypothesis. A wider step width is associated with greater stability [28], and people tend to adopt wider steps in response to destabilizing environments [25]. The slower speed may have been less challenging, and therefore individuals were more comfortable taking narrower steps. Slower walking is usually associated with greater mean step width in injured or older populations [23], but may not be adopted in young, healthy individuals. Additionally, this pattern was seen in steady state walking and not during transitioning tasks. Participants also took more steps at the slow speed, likely a result of the longer transition time. Since participants covered the same lateral distance at both speeds, it is plausible the smaller step width at the ipsilateral side was due to the greater number of steps taken. The narrower step width and smaller MOSML together suggest these individuals were less stable but more maneuverable when transitioning at the slower speed. Furthermore, maneuverability at the slow speed appears to be driven by the ipsilateral steps.
While individuals were more maneuverable at the slow speed than at the typical speed, this was only seen for the ipsilateral steps. Participants appeared to take larger steps towards the direction of the transition, followed by smaller contralateral steps. This may explain the differences in MOSML and step width for the ipsilateral steps but little differences in the contralateral steps. Furthermore, despite how large steps were taken on the ipsilateral side, step width and MOSML remained almost consistent on the contralateral side between speeds. The steps on the ipsilateral side thus drove differences in stepping strategies that contributed to greater maneuverability at the slow speed.
During the reaction condition, individuals at the slow speed were more maneuverable compared to the typical speed as evidenced by the fewer number of unsuccessful transitions. However, the fewer unsuccessful transitions at the slow speed may also reflect the greater amount of time participants had to execute the transitions, as indicated by the longer Response Time at the slow speed. It is plausible that individuals adopted their strategies based on the demands of the task. For instance, given more time at the slow speed, individuals took longer time and adjusted their stepping strategies to complete the transitions.
We investigated two transition conditions that reflect different real-world scenarios. The anticipation conditions emulated navigating around known obstacles in a known direction, thereby allowing transition maneuvers to be planned prior to execution. Conversely, the reaction conditions emulated a situation similar to having a person or object suddenly come into your path requiring you to rapidly identify and execute a maneuver in an unplanned direction. In the anticipation condition, there were no differences between walking speeds in the number of unsuccessful transitions (Fig. 5B). While the time to make the transition was shorter at the typical speed in both conditions, the additional visual and motor delays during the reaction condition associated with identifying and responding to the new arch set location further reduced the amount of time available to execute the transition. As a result, the effect of walking speed on transition strategies and its impact on stability and maneuverability became more apparent when individuals were more sufficiently challenged during the reaction condition.
The virtual environment consisted of only four lanes. Depending on which lane a participant was in, there was a slightly higher probability the next transition would be in one direction than the other. Thus, of necessity, the reaction condition was not entirely without some level of “anticipation”. However, this is a minor a limitation. First, there was a high cost for guessing wrong and initiating a movement in the wrong direction. Second, since the same trials and presentation of transitions were used for both anticipation and reaction trials, any effect due to the configuration of the lanes would have both conditions equally. Thus, while the reaction condition was not completely unpredictable, we were able to identify the effects of walking speed during the execution of transitions in both of these simulated real-world contexts.
We purposefully designed the task so as to not constrain what transition strategies participants could use. Consequently, participants exhibited high degrees of both between- and within-subject variability (Figs. 2–3), particularly in the side of the step relative to the direction of the transition. This high variability reflects a fundamental feature of how people negotiate real-world tasks that offer redundancy in the options available. In such contexts, healthy humans readily exploit the available redundancy, using a wide range of movements to achieve the same task result [29]. This ability to exploit such redundancies is also a paramount feature that allows humans the necessary flexibility to trad-off stability and maneuverability in the real world.
Although maneuverability was previously quantified and studied in animals [5–9], only a few efforts have quantified maneuverability in humans [10, 11]. In addition, there are only a few proposed measures to quantify maneuverability. These are primarily task dependent and there is no general consensus on which to use. Further, the animal studies analyzed turning, dodging, or swerving [8, 9, 30] whereas our task focused on lateral transitions. Thus, the measures of maneuverability used in those studies, such as turning radius, were not applicable here. While MOSML is effective at measuring resistance to perturbations and COM motion, it is only associated with one aspect of maneuverability and does not necessarily fully quantify it. Because “maneuverability” is thus difficult to quantify more generally, we opted to use task performance (number of unsuccessful transitions), as our task-specific measure.
Slower walking speeds may be more stable during level, steady state walking [17–20], but when making rapid, lateral transitions in the community, walking slower may afford people more time to identify, plan and initiate movements that allow for better maneuverability that is executed by steps ipsilateral to the transition direction. Therefore, when navigating in the community, it is important to be able to switch both walking speeds and strategies depending on the specific task. For example, when negotiating obstacles, when possible, people should slow their walking speed and plan the direction of their transitions to improve maneuverability. Or if individuals plan a rapid movement, slowing down and the associated stepping strategies, particularly the ipsilateral steps, can facilitate making such maneuvers. The combination of these walking strategies and switching between tasks will likely improve how individuals modulate between stability and maneuverability when navigating in the community.
Supplementary Material
Research Highlights.
Healthy individuals are more maneuverable at slow walking speeds
Those at the slow speed had a lower margin of stability during transitions
People should switch walking speeds and strategies when navigating in the community
Acknowledgments
Study supported by NIH grant 1-R01-HD059844 and DoD/CDMRP/BADER Consortium W81XWH-11-2-0222 (both to JBD and JMW). The authors thank Michael Vernon for his help designing and operating the virtual obstacle course, Jonathan Rylander for help with study design and implementation, and Mitchell Ruble, Audrey Westbrook, and Chad Lyons for help with data collection and processing.
Footnotes
Publisher's Disclaimer: This is a PDF file of an unedited manuscript that has been accepted for publication. As a service to our customers we are providing this early version of the manuscript. The manuscript will undergo copyediting, typesetting, and review of the resulting proof before it is published in its final citable form. Please note that during the production process errors may be discovered which could affect the content, and all legal disclaimers that apply to the journal pertain.
Disclaimer: The view(s) expressed herein are those of the author(s) and do not reflect the official policy or position of Brooke Army Medical Center, the U.S. Army Medical Department, the U.S. Army Office of the Surgeon General, the Department of the Army and Department of Defense or the U.S. Government.
Conflict of Interest Statement:
The authors declare there are no conflicts of interest associated with this work. The study sponsors (NIH, DOD) were not involved in the final study design, data collection, analysis, or interpretation, or in the writing of the manuscript or the decision to submit the manuscript for publication.
References
- 1.Donelan JM, Shipman DW, Kram R, Kuo AD. Mechanical and metabolic requirements for active lateral stabilization in human walking. Journal of Biomechanics. 2004;37:827–35. doi: 10.1016/j.jbiomech.2003.06.002. [DOI] [PubMed] [Google Scholar]
- 2.Kuo AD. Stabilization of lateral motion in passive dynamic walking. The International Journal of Robotics Research. 1999;18:14. [Google Scholar]
- 3.Lee DV, Walter RM, Deban SM, Carrier DR. Influence of increased rotational inertia on the turning performance of humans. J Exp Biol. 2001;204:3927–34. doi: 10.1242/jeb.204.22.3927. [DOI] [PubMed] [Google Scholar]
- 4.Qiao M, Brown B, Jindrich DL. Compensations for increased rotational inertia during human cutting turns. J Exp Biol. 2014;217:432–43. doi: 10.1242/jeb.087569. [DOI] [PMC free article] [PubMed] [Google Scholar]
- 5.Webb PW, Weihs D. Stability versus Maneuvering: Challenges for Stability during Swimming by Fishes. Integr Comp Biol. 2015;55:753–64. doi: 10.1093/icb/icv053. [DOI] [PubMed] [Google Scholar]
- 6.Weihs D. Stability versus maneuverability in aquatic locomotion. Integr Comp Biol. 2002;42:127–34. doi: 10.1093/icb/42.1.127. [DOI] [PubMed] [Google Scholar]
- 7.Fish FE. Balancing requirements for stability and maneuverability in cetaceans. Integr Comp Biol. 2002;42:85–93. doi: 10.1093/icb/42.1.85. [DOI] [PubMed] [Google Scholar]
- 8.Wynn ML, Clemente C, Nasir AFAA, Wilson RS. Running faster causes disaster: trade-offs between speed, manoeuvrability and motor control when running around corners in northern quolls. The Journal of Experimental Biology. 2015;218:433–9. doi: 10.1242/jeb.111682. [DOI] [PubMed] [Google Scholar]
- 9.Jindrich DL, Qiao M. Maneuvers during legged locomotion. Chaos. 2009;19:026105. doi: 10.1063/1.3143031. [DOI] [PubMed] [Google Scholar]
- 10.Wu M, Matsubara JH, Gordon KE. General and Specific Strategies Used to Facilitate Locomotor Maneuvers. PLoS One. 2015;10:e0132707. doi: 10.1371/journal.pone.0132707. [DOI] [PMC free article] [PubMed] [Google Scholar]
- 11.Hak L, Houdijk H, Steenbrink F, Mert A, van der Wurff P, Beek PJ, et al. Stepping strategies for regulating gait adaptability and stability. J Biomech. 2013;46:905–11. doi: 10.1016/j.jbiomech.2012.12.017. [DOI] [PubMed] [Google Scholar]
- 12.Beltran EJ, Dingwell JB, Wilken JM. Margins of stability in young adults with traumatic transtibial amputation walking in destabilizing environments. J Biomech. 2014;47:1138–43. doi: 10.1016/j.jbiomech.2013.12.011. [DOI] [PMC free article] [PubMed] [Google Scholar]
- 13.McAndrew Young PM, Wilken JM, Dingwell JB. Dynamic margins of stability during human walking in destabilizing environments. J Biomech. 2012;45:1053–9. doi: 10.1016/j.jbiomech.2011.12.027. [DOI] [PMC free article] [PubMed] [Google Scholar]
- 14.Sheehan RC, Rabago CA, Rylander JH, Dingwell JB, Wilken JM. Use of Perturbation-Based Gait Training in a Virtual Environment to Address Mediolateral Instability in an Individual With Unilateral Transfemoral Amputation. Phys Ther. 2016 doi: 10.2522/ptj.20150566. [DOI] [PMC free article] [PubMed] [Google Scholar]
- 15.Hof AL, Gazendam MGJ, Sinke WE. The condition for dynamic stability. J Biomech. 2005;38:1–8. doi: 10.1016/j.jbiomech.2004.03.025. [DOI] [PubMed] [Google Scholar]
- 16.Owings TM, Grabiner MD. Variability of step kinematics in young and older adults. Gait Posture. 2004;20:26–9. doi: 10.1016/S0966-6362(03)00088-2. [DOI] [PubMed] [Google Scholar]
- 17.England SA, Granata KP. The influence of gait speed on local dynamic stability of walking. Gait Posture. 2007;25:172–8. doi: 10.1016/j.gaitpost.2006.03.003. [DOI] [PMC free article] [PubMed] [Google Scholar]
- 18.Kang HG, Dingwell JB. Effects of walking speed, strength and range of motion on gait stability in healthy older adults. Journal of Biomechanics. 2008;41:2899–905. doi: 10.1016/j.jbiomech.2008.08.002. [DOI] [PMC free article] [PubMed] [Google Scholar]
- 19.Roos PE, Dingwell JB. Influence of neuromuscular noise and walking speed on fall risk and dynamic stability in a 3D dynamic walking model. J Biomech. 2013;46:1722–8. doi: 10.1016/j.jbiomech.2013.03.032. [DOI] [PMC free article] [PubMed] [Google Scholar]
- 20.Dingwell JB, Marin LC. Kinematic variability and local dynamic stability of upper body motions when walking at different speeds. Journal of Biomechanics. 2006;39:444–52. doi: 10.1016/j.jbiomech.2004.12.014. [DOI] [PubMed] [Google Scholar]
- 21.Tsai Y-J, Lin S-I. Older adults adopted more cautious gait patterns when walking in socks than barefoot. Gait Posture. 2013;37:88–92. doi: 10.1016/j.gaitpost.2012.06.034. [DOI] [PubMed] [Google Scholar]
- 22.Gates DH, Scott SJ, Wilken JM, Dingwell JB. Frontal plane dynamic margins of stability in individuals with and without transtibial amputation walking on a loose rock surface. Gait Posture. 2013;38:570–5. doi: 10.1016/j.gaitpost.2013.01.024. [DOI] [PMC free article] [PubMed] [Google Scholar]
- 23.Knoblauch R, Pietrucha M, Nitzburg M. Field studies of pedestrian walking speed and start-up time. Transportation Research Record: Journal of the Transportation Research Board. 1996:27–38. [Google Scholar]
- 24.Wilken JM, Rodriguez KM, Brawner M, Darter BJ. Reliability and minimal detectible change values for gait kinematics and kinetics in healthy adults. Gait Posture. 2012;35:301–7. doi: 10.1016/j.gaitpost.2011.09.105. [DOI] [PubMed] [Google Scholar]
- 25.McAndrew PM, Dingwell JB, Wilken JM. Walking variability during continuous pseudo-random oscillations of the support surface and visual field. J Biomech. 2010;43:1470–5. doi: 10.1016/j.jbiomech.2010.02.003. [DOI] [PMC free article] [PubMed] [Google Scholar]
- 26.Gard SA, Miff SC, Kuo AD. Comparison of kinematic and kinetic methods for computing the vertical motion of the body center of mass during walking. Hum Mov Sci. 2004;22:597–610. doi: 10.1016/j.humov.2003.11.002. [DOI] [PubMed] [Google Scholar]
- 27.Goutier KM, Jansen SL, Horlings CG, Kung UM, Allum JH. The influence of walking speed and gender on trunk sway for the healthy young and older adults. Age Ageing. 2010;39:647–50. doi: 10.1093/ageing/afq066. [DOI] [PubMed] [Google Scholar]
- 28.Hof AL, van Bockel RM, Schoppen T, Postema K. Control of lateral balance in walking. Experimental findings in normal subjects and above-knee amputees. Gait Posture. 2007;25:250–8. doi: 10.1016/j.gaitpost.2006.04.013. [DOI] [PubMed] [Google Scholar]
- 29.Dingwell JB, John J, Cusumano JP. Do Humans Optimally Exploit Redundancy to Control Step Variability in Walking? PLoS Comput Biol. 2010;6:e1000856. doi: 10.1371/journal.pcbi.1000856. [DOI] [PMC free article] [PubMed] [Google Scholar]
- 30.Full RJ, Kubow T, Schmitt J, Holmes P, Koditschek D. Quantifying dynamic stability and maneuverability in legged locomotion. Integr Comp Biol. 2002;42:149–57. doi: 10.1093/icb/42.1.149. [DOI] [PubMed] [Google Scholar]
Associated Data
This section collects any data citations, data availability statements, or supplementary materials included in this article.