

INTRODUCTION
Pharmacogenomics has revealed compelling genetic signals associated with variability in drug response. Gene expression studies represent an additional approach to identify candidate genes accounting for drug response variability. This review focuses on insights that might be gained through analysis of the transcriptome to reveal the influence of gene expression on variable drug response. We provide a basic overview of RNA‐Sequencing (RNA‐Seq) and its applications, and outline advances in pharmacogenomics achievable with RNA‐Seq data.
POTENTIAL FOR SCIENTIFIC DISCOVERIES THROUGH RNA‐SEQUENCING
Every human cell in the body arises from the same set of genetic information, yet only a fraction of genes is expressed in any given cell at any given time.1 This carefully controlled pattern of gene expression differentiates liver cells from muscle cells, for instance, and healthy from diseased status. Therefore, enhanced understanding of gene expression patterns can lead to molecular pathways that underlie disease susceptibility or drug response.
The complete transcriptome consists of protein coding and long and short noncoding RNAs. We will focus here on protein coding RNAs (mRNAs). The expression level of RNAs represents the most immediate phenotype that can be associated with cellular conditions (such as drug exposure or disease state), and regulatory variants in the gene locus itself (cis‐acting) or in trans‐acting regulatory factors. Sequence variation in regulatory regions that govern gene expression is a main mediator of overall phenotypic diversity.2, 3 On the other hand, genetic variants in the transcribed region of a gene can influence multiple RNA functions, such as splicing, turnover, and translation.4 Therefore, RNA levels reflect the combined influence of genetic factors, cellular conditions, and environmental factors. We propose that regulatory variants are key factors and frequently represent causal mutations in disease genetics5 and pharmacogenomics.6
High‐throughput DNA sequencing tools have provided a new, comprehensive method for both mapping and quantifying transcriptomes.7 RNA‐Seq has emerged as an innovative method for both mapping and quantifying transcriptome signatures associated with diseases and traits.8, 9, 10 When compared with other transcriptomic techniques, such as microarrays, RNA‐Seq has the ability to quantify expression levels of all RNAs at a given gene locus, including RNA isoforms generated through alternative transcription and translation start sites, 3’UTR poly‐adenylation sites, splicing, RNA editing, and more. As a result, RNA‐Seq characterizes the complete transcriptome and facilitates discovery of differentially expressed genes and RNA isoforms that are not otherwise accessible. The power of sequencing RNA vs. using oligonucleotides to assess gene expression with microarrays lies in the fact that both transcript discovery and quantification can be incorporated in one high‐throughput sequencing assay with RNA‐Seq. Thus RNA‐Seq enables dynamic assessment of mechanisms associated with disease and drug response to bridge the gap between genomics and phenotype,11, 12 providing a powerful tool germane to precision medicine.
OVERVIEW OF THE RNA‐Seq TECHNOLOGY
Until recently, microarrays have served as the most cost‐effective, reliable, and rapid technology for high‐throughput profiling of gene expression. However, microarrays require a priori knowledge of sequences to be investigated, limiting discovery of de novo splicing isoforms or novel exons, transcripts, and genes (Table 1).7 In addition, hybridization‐based methods used in microarrays can also limit the dynamic range of gene expression quantification (Table 1), casting doubt on measurements of transcripts with high or very low abundance.13
Table 1.
Advantages of RNA‐Seq compared with microarrays
| Microarrays | RNA‐Seq | |
|---|---|---|
| Principle | Hybridization | High‐throughput sequencing |
| Resolution | >100 bp | Single base |
| Reliance on genomic sequence | Yes | Not necessarily |
| Background noise | High | Low |
| Dynamic range for gene expression quantification | Few 100‐fold | >8,000‐fold |
| Ability to distinguish isoforms | Limited | Yes |
| Ability to distinguish allelic expression | Limited | Yes |
| Required amount of RNA | High (μg) | Low (ng) |
With widespread adoption of Next Generation Sequencing (NGS) platforms, RNA‐Seq, a methodology for RNA profiling, using millions of short reads (sequence strings), enables the investigation of all the RNA in a sample, theoretically.14 In practice, the input population of RNA, either total RNA or fractioned (such as poly(A) selected, capturing most mRNAs and many noncoding RNAs), is converted to a library of fragmented cDNA.14 Then, each fragment receives adaptors attached to one or both ends.14 These fragments are amplified and sequenced in a high‐throughput manner, generating millions of short reads14 (Figure 1). Current RNA‐Seq methods target RNAs with at least 200 base pairs, whereas short noncoding RNAs, including microRNAs, require separate isolation and protocols.15, 16
Figure 1.
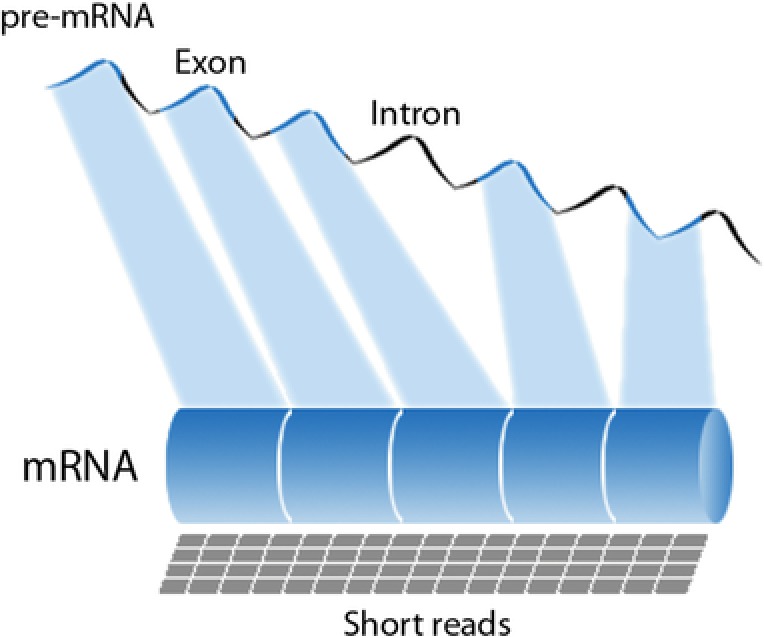
Schematic representation of the pre‐messenger RNA (mRNA), with exons and introns, and the RNA‐Sequencing (RNA‐Seq) short reads mapped to the final m(RNA).
Depending on the sequencing platform (Illumina, Roche 454, Solid, Ion Torrent), read lengths typically range between 30–500 base pairs.17 Sequence length is an important criterion since longer reads improve mappability for identification of transcript and transcript isoforms.18 Another important factor is the library size or read depth, which is the number of sequence reads for a given sample. The deeper the sequencing level, the more sensitive and precise transcript identification and quantitation will be.18 While some studies advocate that read counts as low 5 million reads can accurately quantify moderate to highly expressed genes,19 the ENCODE best practices protocol recommends library sizes with more than 25 million reads for a typical RNA‐Seq protocol for investigating mRNA expression using poly‐A selected RNAs.20
Once high‐quality reads are obtained, RNA‐Seq reads are computationally mapped to the human reference genome, revealing a transcriptional map.7, 21 Owing to extensive alternative splicing that occurs in the human transcriptome, the alignment process is more challenging to map reads that span splice junctions.17 Also, RNA‐Seq read alignment is complicated by the fact that short reads may be assigned to multiple regions of the human genome.17 The most widely used RNA‐Seq alignment software programs use gene annotation to achieve better placement of spliced reads and correctly handle multiple short read assignment in the vast majority of occurrences.22
Next, overlapping reads that were mapped to a particular exon are clustered into gene or isoform levels for quantification.18 Raw read counts per gene locus alone are insufficient to compare expression levels among samples.18 The most frequently reported measure of gene expression from RNA‐Seq analysis is R/FPKM (reads or fragments per kilobase of exon model per million), a within‐sample normalization method that considers transcript length and total number of mapped reads.18 The data analysis then allows the characterization of gene expression levels that can be applied to investigate distinct features of the transcriptome diversity. As with all large‐scale analyses, the resulting RNA levels are subject to error, so that important findings need to be replicated with alternative methods, such as quantitative real time‐polymerase chain reaction (qRT‐PCR).
RNA‐Seq APPLICATIONS
The beauty of the RNA‐Seq tool lies in the fact that previously distinct core activities of discovery and transcript quantification now can be combined in a single high‐throughput assay. This approach provides a significant qualitative and quantitative improvement to study the transcriptome, enabling detection of genes with low expression (given enough read counts per sample), sense and antisense transcripts, RNA edits, and novel isoforms, all at base pair resolution.7
mRNA expression profiling
One of the most biologically relevant applications of RNA‐Seq is the comparison of mRNA transcriptomes across distinct developmental stages, across samples from diseased vs. normal individuals, or other specific experimental conditions.23 For this type of analysis, it is crucial to accurately construct the isoform structure to assess transcript abundances when comparing multiple samples (Figure 2).17 This powerful approach is essential for the interpretation of functional genomic elements and discovery of transcripts key to molecular mechanisms underlying disease susceptibility or drug response.
Figure 2.
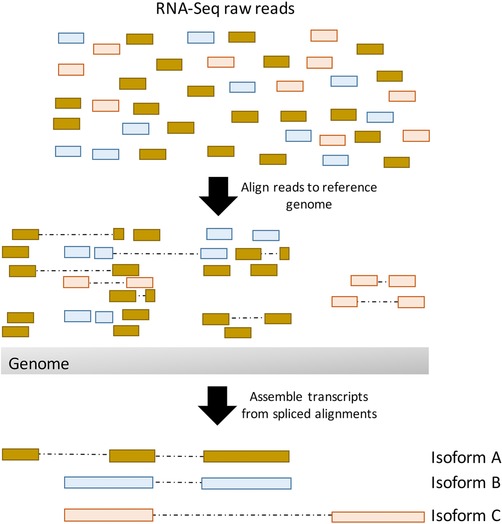
Genome‐based assembly strategy for reconstructing transcripts from RNA‐Seq reads. First, short RNA‐Seq reads are aligned to the reference genome, accounting for possible splicing events. Then transcripts are reconstructed from the spliced alignments. The colors of the RNA‐Seq reads represent the transcript isoform from which they are derived.
Alternative splicing
Alternative splicing events play a key role in shaping biological complexity and genomic diversity.24 The term alternative splicing refers to distinct inclusion/exclusion of exons in the processed RNA product when compared with constitutive splicing events.25 Multiple proteins regulate this RNA processing step, called splicing factors, aggregated into tissue‐specific spliceosomes.25 Given the complexity of this regulatory activity, it is not surprising that RNA splicing is exceptionally susceptible to hereditary and somatic mutations associated with a broad range of diseases.24, 26, 27
The RNA‐Seq technology enables the exploration of transcriptome structure, investigating different patterns of splice junctions with more accuracy than microarrays.28 Once sufficient RNA‐Seq reads (tens to hundreds of millions) are mapped to the genome, exons, and exon–exon junctions, RNA‐Seq assays allow annotation of new exon–intron structures and detection of the relative isoform abundance of individual alternative splicing events.28, 29 Unlike microarrays, RNA‐Seq does not rely on prior knowledge of transcriptome structure and splicing events, and has nucleotide resolution level.30 Deep surveying of alternative splicing with RNA‐Seq data has revealed unprecedented diversity of splice junctions, tissue‐specific RNA‐binding motifs, and splicing regulatory elements.31 The relevance of alternative splicing is further highlighted by distinct functions conveyed by splice variants that can contribute to tissue‐specific pathology.5
Gene expression regulation
Most of the single‐nucleotide polymorphisms (SNPs) identified through genome‐wide association studies (GWAS) reside in noncoding or intergenic regions of the genome,32 suggesting that many causal variants influence traits/phenotypes by impacting gene expression.33, 34, 35 Genetic polymorphisms associated with variation in gene expression levels, termed expression quantitative trait loci (eQTLs), have been extensively studied over the years and are known to be widespread over human populations.35, 36 These regulatory variants contribute to phenotype diversity by interfering with the steps across the flow of genetic information in a cell, from DNA to protein, and are cataloged now on GTEx37 for up to 60 different tissues in up to 1,000 subjects.
RNA‐Seq enables further investigation of the regulatory role of specific sequences to gene expression by taking advantage of the single‐nucleotide level resolution. Heterozygous individuals for a particular genome locus present two allelic forms, which allows one to investigate whether one of the alleles has greater expression than the other. This event is called allele‐specific expression (ASE), and detection of ASE imbalance with RNA‐Seq (unequal expression of one allele over the other) signals the presence of genetic and/or epigenetic determinants that govern allelic transcriptional activity (Figure 3).38, 39 Often, ASE is evidence of a disruption of a highly regulated process leading to disease susceptibility38, 39 or potential variability in drug response.40
Figure 3.
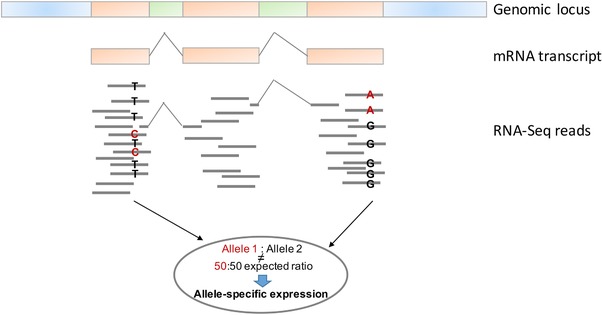
RNA‐Seq can also be used to interrogate allelic effects, in sites with a polymorphism confirmed by dense coverage of reads. Based on the reads aligned to a specific genome locus, it is possible to calculate the ratio of reads from each allele (allele 1: allele 2). Allele‐specific expression (ASE) is determined if the calculated ratio deviates from the expected 50:50.
Predominantly, the largest effect sizes or the strongest genetic effects in the expression of individual genes are observed locally within the respective target gene locus.36, 41 These are called cis‐regulatory regions, composed of cis‐regulatory elements, with target sites for transcription factors and other regulatory proteins, acting as promoters and enhancers, or as repressors defining transcriptionally inactive regions.36 Transcription factor binding sites are the central elements of cis‐regulatory regions, which in the presence of transcription factors and epigenetic modifications can determine whether transcription is turned on/off, and the rate of the transcription process.36, 42 Enhancer regions can reside at large distances up‐ or downstream of the gene locus per se, often confounding the assignment of GWAS hits to a candidate gene.43
Trans‐acting variants, polymorphic variants that regulate gene expression via an intermediate factor, can be anywhere in the human genome, and typically convey a smaller‐effect size than cis‐acting variants.33, 36, 42 One of the reasons may be that expression levels of a particular gene are usually under the effect of multiple trans‐acting regulators, such as different transcription factors, coactivator proteins, proteins that help stabilize transcription factors, etc. Consequently, the effect size of each one of these trans‐acting regulators is diminished.42, 44 To date, several trans‐acting regulatory regions have been identified as “hot spots” but only a few of these regions have been determined to account for the underlying regulatory mechanism.44, 45, 46, 47, 48, 49, 50
Network analysis
RNA‐Seq data can be further explored to infer gene function, gene–disease or gene–drug exposure associations and gene–gene interaction with coexpression network analysis, an approach that constructs networks of coregulated genes.51 Going beyond the identification of singular genes or regulatory variants associated with disease or drug exposure, building coexpression networks can be used for candidate gene prioritization as a function of their position in network hubs, and functional gene annotation.52 Guidance and further details about the various methods developed for this approach are available in recent reviews.52, 53
Because RNA‐Seq also quantifies the expression of up to 70,000 noncoding RNAs,54 not usually measured with microarrays, it permits a better understanding of regulatory networks driving biological processes including noncoding RNAs. Numerous noncoding RNAs are thought to have regulatory roles55 and to play a role in disease processes.56, 57 With sufficient read depth, RNA‐Seq also increases accuracy for low abundance transcripts18 and has the requisite resolution that allows to distinguish between the expression of different splice variants.58 Thus, coexpression analysis on RNA‐Seq data can detect previously hidden networks and thereby assign putative functions to noncoding RNAs and splice variants.
BREAKTHROUGH DISCOVERIES WITH RNA‐Seq
In the past decade, GWAS have been the most widely employed tool to investigate the link between genetic polymorphisms and common diseases, due to the application of agnostic approaches in which genetic variation across the human genome is tested, allowing discovery of novel genes and pathways. Although this approach has successfully revealed a multitude of genetics signals associated with complex diseases and phenotypes, revealing new biological insights, often gene expression studies applying RNA‐Seq identify signature genes that explain a greater fraction of interindividual variability than large GWAS.
Recently, a sequential series of large‐scale GWAS in hypertension (HTN) has been published. Data from two meta‐analysis studies, each with greater than 30,000 individuals, identified three replicated loci in association with HTN.59, 60 A few years later, a study with an even larger sample size (200,000 individuals) identified 29 loci with significant associations with BP. Of those, 6 loci had been previously associated with HTN/BP.61 These results were met with enthusiasm in the HTN genetics field, yielding new mechanistic insights into the biology of BP regulation. However, each SNP conveys only small effect sizes, averaging about 1 mmHg per allele for SBP and 0.5 mmHg per allele for DBP, which in aggregate accounts for less than 3% of interindividual variability in BP.62 Therefore, these studies have not provided clinically actionable signals for defining risk of HTN, and further exploration of the mechanisms highlighted by these genetics findings is necessary.
Hypertension. RNA‐Seq approaches have also been used to enhance understanding of HTN. A large‐scale, unbiased investigation of BP/HTN gene expression signature using whole blood RNA revealed 34 genes that in aggregate explain up to 9% of interindividual variability in BP.50 These results, based on exploration of differential expression in HTN, contrast to merely 3% of variability in BP explained by the GWAS findings collectively. Further, integration of the BP signature genes, eQTLs, and GWAS results revealed that six SNPs associated with BP (P < 5 × 10⁻⁸ in the ICBP GWAS61) are also trans regulators of several top BP signature genes.50 Therefore, this study provides important avenues for future investigation on the impact of these transcriptomic markers to predict antihypertensive drug response, and serves as an example of the insights to be gained from RNA Seq data—insights that are valuable alone, and amplified when coupled with GWAS data.
Additionally, the application of RNA‐Seq in HTN mouse models for transcriptome profiling revealed novel potential mechanisms involved in the pathophysiology of HTN and its complications. Cowley et al.63 identified genes and biological pathways associated with a protective effect on Dahl salt‐sensitive rats. Tain et al 64 identified genes of importance for programmed HTN, through transcriptome characterization of the offspring of pregnant mouse models under suboptimal conditions (high fructose and dexamethasone administration). Differential expression and pathway analysis revealed genes involved in arachidonic acid metabolism as a potential gatekeeper involved in programmed hypertension.64
Obesity. Multiple recent studies have also bridged the causality gap between human regulatory variants, gene expression, and phenotypes.65, 66, 67, 68 One example is the insight gained on the FTO (encoding fat mass and obesity‐associated protein) variants associated with obesity.69 This intronic region was found to serve as an enhancer, making physical contact with the IRX3 gene promoter, which is more than 500 kb apart from the obesity‐associated variants, regulating its gene expression in both cerebellum and human adipocytes.70 Through IRX3 knockout models, a causal link was established between FTO SNPs, IRX3 expression, and obesity.70
Additionally, a large‐scale study with RNA‐Seq data from the TwinsUK cohort (n = 856) conducted a genome‐wide search for gene‐by‐body mass index (BMI) interactions on the regulation of gene expression in multiple tissues (adipose, skin, whole blood, and lymphoblastoid cell lines).71 This study identified 16 cis‐acting regulatory variants and one trans‐acting variant, rs3851570, regulating the expression of 53 genes in adipose tissue.71This demonstrates the importance of investigating the role of eQTLs in influencing downstream traits. Applying the RNA‐Seq technology, Glastonbury et al.71 characterized cis and trans‐regulatory effects that BMI showed on peripheral tissue and identified robust examples of BMI‐dependent gene expression regulation. Identifying genes/regulatory variants that could predispose to BMI‐specific outcomes holds the potential for new targeted interventions, and could provide a better assessment of individuals at risk for obesity.
Another study of gene expression with RNA‐Seq showed that transcriptome profiling improved breast cancer prediction when compared with GWAS data. With a modeling framework that allows data integration from multiple omics layers, and contemplates different structural effects between these layers, a recent study analyzed data from the Cancer Genome Atlas for prediction of survival after diagnosis of breast cancer. Comparing predictors based on gene expression profiling with those based on clinical covariates commonly used for the assessment of breast cancer patients, the authors report that gene expression data provide more predictive power than any clinical assessment included in the model, and the combination of gene expression and clinical measures provided a significant gain in predictive accuracy. These results support the predictive power of gene expression studies to differentiate breast cancer subtypes or stages, and demonstrate how clinical information can be integrated with RNA‐Seq data.
Heart failure. In recent years, multiple studies have investigated the transcriptome signature of heart failure (HF). Differential expression analysis was conducted comparing whole transcriptome profiles between explanted human HF right ventricles (RV) and five unused donor human heart RVs.72 STEAP4, SPARCL1, and VSIG4 were identified as potential RV myocardial biomarkers in human HF.72 The same group also identified long noncoding RNA differentially expressed between normal vs. HF RVs.73 Another study used transcriptomics data, generated by RNA‐Seq and microarrays, to identify novel myocardial gene expression signatures of HF.74 Although these findings are not ready yet for clinical implementation, they provide a comprehensive characterization of the transcriptome in human HF, and represent an inventory of key players in HF for further investigation with mechanistic studies.
Cardiovascular diseases. Large existing transcriptome databases can serve to search for key genes involved in pathophysiology, for example RNA‐Seq data for thousands of subjects in the Framingham75 and CATHGEN76 studies. These public databases were used to address the question whether dynamic interactions between genes detectable at the gene or transcript levels can serve to identify key factors in disease pathophysiology. This approach led to the discovery of several small interacting networks showing strong association with coronary artery disease,12 suggesting that single genes and transcripts alone are insufficient to account for disease risk, but rather dynamic interactions need to be considered, accessible via analysis of RNA‐Seq data.
The examples provided here from the literature in disease genomics are not an extensive collection of each study available with RNA‐Seq data in the field, but the results provided by these studies set the framework for successful studies in pharmacogenomics research, and highlight some of the potential opportunities for discovery presented by RNA‐Seq data. They have shown that gene expression studies, with RNA‐Seq, account for greater variability in disease susceptibility, and that predictive models including gene expression data have improved the accuracy of disease models.
The application of RNA‐Seq in pharmacogenomics research
Pharmacogenomics holds the promise to provide personalized treatments strategies, taking into consideration the patient's genetic makeup. Gene expression variation and the diversity of splicing events occurring in drug‐metabolizing enzymes, drug transporters, and drug targets have been associated with heterogeneity in drug response and adverse drug events.77, 78 Therefore, a comprehensive study of the potential variability on transcriptome profiling associated with pharmacogenomics phenotypes can provide relevant insights into the molecular basis of heterogeneity in drug response. In this section we provide some examples of pharmacogenomics studies that have applied RNA‐Seq technology for identification of biomarkers.
Community‐wide efforts have facilitated transcriptome sequencing for the investigation of disease genetics (GTEX,37 the Cancer Genome Atlas79). However, the use of NGS technology for pharmacogenomics research has been limited. Given the potential of a systematic study of the transcriptome to elucidate drug response mechanisms, the National Institutes of Health‐supported Pharmacogenomics Research Network (PGRN) capitalized the required resources for a comprehensive transcriptome sequencing project that has cataloged variation in gene expression and splicing events of 389 pharmacogenes involved in drug disposition, across liver, kidney, heart, adipose tissue, and lymphoblastoid cell lines.80 Gene expression and splicing data are available for download (http://pharmacogenetics.ucsf.edu/expression/rnaseqdata.html).
Large‐scale data generation from cancer cell lines enables pharmacogenomics oncology research to characterize clinical models, gain mechanistic and therapeutic insights, and to identify predictors of drug response/sensitivity. The Cancer Cell Line Encyclopedia (CCLE) leverages RNA‐Seq and genetic (copy number and genotype) data from 1,000 cell lines coupled with pharmacological profiles for 24 anticancer drugs.81 Barretina et al.81 strove to integrate CCLE data and revealed genetic, lineage, and gene‐expression‐based biomarkers of drug sensitivity. They highlighted a few cases: plasma cell lineage for IGF1 receptor inhibitors, AHR expression for MEK inhibitors, and SLFN11 expression for topoisomerase inhibitors. Applying a systems biology framework to the CCLE data, Liu et al.82 investigated drug–response‐associated gene expression profiles. Functional enrichment analysis of the top candidate genes associated with drug response identified TSPO, TP53, and other immune or cell cycle‐related genes as key functional drivers for the association with drug response to the anticancer drugs studied.82 The study also revealed distinct coexpression patterns of drug response between gender and age.82 These results provide new molecular markers and networks related to cancer therapy. Quantified CCLE RNA‐Seq data are available for download (https://ocg.cancer.gov/ctd2-data-project/translational-genomics-research-institute-quantified-cancer-cell-line-encyclopedia).
Transcriptome profiling in tumor tissues has also achieved success in the identification of drug response predictors in oncology. Coexpression of seven genes was associated with molecular subtype‐selective vulnerabilities in nonsmall‐cell lung cancer.83 The presence of this gene expression signature indicates potential optimal therapy selection with a synthetic indolotriazine.83 The same work characterized other molecular signatures to guide therapy selection based on an extensive functional and genomics exploration.83 This work illustrates the opportunities for therapy guidance that can arise from gene expression investigation with RNA‐Seq data.
Trastuzumab for patients with HER2‐positive breast cancer is an example of a number of existing drugs that have proved efficacy only for a group of patients with specific molecular features.84 Using RNA‐Seq for an integrative transcriptomic approach from trastuzumab‐sensitive and trastuzumab‐resistant HER2+ tumors, a small set of coding and noncoding (lincRNAs) associated with trastuzumab‐resistance, following validation with cancer cell lines.85 From functional investigation of top candidate genes, they demonstrated that inhibition of S100P results in reversing trastuzumab resistance.85 Through an unbiased gene expression investigation with RNA‐Seq, this study revealed clinically relevant mechanism of trastuzumab‐resistance, and outlined potential targets for novel therapeutic strategies.
Transcriptomic analysis was performed in lymphoblastoid cell lines derived from 150 participants of the Cholesterol and Pharmacogenetics (CAP) simvastatin clinical trial, aiming to identify genes that may have a role in triglyceride statin response.86 Among the 23 genes correlated with triglyceride statin response, insulin induced gene 1 (INSIG1) was the most relevant biological candidate, consistent with extensive literature that links this gene to the regulation of cholesterol homeostasis.86 The authors also report a sex‐specific correlation of INSIG1 with triglyceride statin response (interaction P = 0.0055), and that INSIG1 expression levels and splicing changes accounted for about 30% of the variation on statin‐induced triglyceride response in men (P = 5.6 × 10⁻⁶).86
Similarly, Himes et al.87 applied RNA‐Seq to investigate a pharmacogenomic phenotype: antiinflammatory effects of glucocorticoids for the treatment of asthma. Airway smooth muscle cells were treated with dexamethasone for 18 h, followed by mRNA extraction, and high‐throughput sequencing.87 This approach identified 316 genes differentially expressed relative to dexamethasone treatment, and highlighted CRISPLD2 as an asthma pharmacogenetics candidate gene that regulates antiinflammatory effects of glucocorticoids.87
Studies of transcriptome and anti‐HTN drug response are under way in our laboratory. Resources from the PGRN RNA‐Seq group allowed the first transcriptome‐wide study of gene expression impacting thiazide BP response. In order to identify novel molecular markers of BP response to thiazide diuretics, 150 participants from the Pharmacogenomics Evaluation of Antihypertensive Responses (PEAR) and PEAR‐2 studies with extremes of BP response (responders and nonresponders) to thiazide diuretics (50 whites from PEAR; 50 whites and 50 blacks from PEAR‐2) were selected for RNA‐sequencing. Using this RNA‐Seq data set to assess the gene expression levels of 34 genes previously associated with differential expression relative to BP/HTN50 revealed that FOS, PPP1R15A, and DUSP1 were differentially expressed in all three cohorts.88 These findings suggest that select genes identified through BP/HTN transcriptome profiling are also relevant determinants of BP response to thiazide diuretics.
In addition, the PEAR RNA‐Seq data provided further biological insights when integrated with the GWAS results.88 The rs10995 G‐allele was associated with better BP response to thiazide diuretics (HCTZ and chlorthalidone), and with increased expression of the nearby VASP gene.88 RNA‐Seq data analysis revealed that baseline expression of VASP was higher in participants classified as responders to thiazide diuretics when compared with nonresponders (HCTZ: P = 0.01 and chlorthalidone: P = 0.04).88 The allele‐specific expression analysis also revealed a modest expression imbalance at rs10995, which could impact the observed genetic effects through expression and/or translational modifications.88 Further studies are ongoing to identify the potential utility of RNA‐Seq data in understanding variable responses to antihypertensive drugs.
We can anticipate substantial additions to the literature in the near term of data arising from transcriptome analyses, likely enhancing our understanding of mechanisms and causes of interindividual differences in drug response. The application of RNA‐Seq may lead not only to the discovery of signature genes of response to drugs, but it may also enable the characterization of isoform diversity, cis/trans‐acting regulatory variants, and gene expression networks impacting heterogeneity in drug response. This powerful tool represents an alternative approach for the identification of target genes, allowing a global perspective of RNA transcripts or transcript regulation involved in the mechanisms underlying drug response.
CONCLUSION
Sequencing technologies have rapidly advanced in the past years, allowing the application of RNA‐Seq to systematically investigate the transcriptome with accuracy and high data resolution to expand the knowledge on the influence of regulatory mechanisms on gene expression affecting variability in drug response. In this review we describe this new technology and discuss multiple applications for RNA‐Seq, with examples of scientific discoveries in disease genomics and pharmacogenomics. Additional studies are still needed to advance the pharmacogenomics field to the level of knowledge enabling clinical recommendations. Despite the promising findings from novel genetic variants associated with variability in drug response, transcriptomics studies have potential to refine treatment strategies. While the use of transcriptomics in pharmacogenomics is currently scarce, recent advances in NGS technologies allow accurate transcript quantitation for differential expression between biological conditions, identification of splicing events, and the assessment of regulatory mechanisms of gene expression. These are prominent processes generating diversity in protein/metabolite function with proven consequences in drug disposition, mechanism of action, and clinical consequences.
Precision medicine has recently moved into the spotlight of health care, challenging us to develop the necessary methodology for optimizing personalized therapy selection. With the availability of new powerful methods, the study of the transcriptome, over the coming years, is likely to yield biomarkers predictive of disease susceptibility and guiding drug therapy.
Conflict of Interest
The authors declared no conflict of interest.
Acknowledgment
This work was supported in part by grants from the National Institutes of Health Pharmacogenomics Research Network (U01 GM092655 WS and U01 GM074492 JAJ).
Author Contributions
A.C.C.S., W.S., and J.A.J. conceived, wrote, and reviewed the article.
References
- 1. Consortium, E.P. An integrated encyclopedia of DNA elements in the human genome. Nature. 489, 57–74 (2012). [DOI] [PMC free article] [PubMed] [Google Scholar]
- 2. Wray, G.A. et al. The evolution of transcriptional regulation in eukaryotes. Mol. Biol. Evol. 20, 1377–1419 (2003). [DOI] [PubMed] [Google Scholar]
- 3. Carroll, S.B. From DNA to Diversity: Molecular Genetics and the Evolution of Animal Design 2nd edn (Blackwell Pub, Malden, MA, 2005. [Google Scholar]
- 4. Sadee, W. et al. Pharmacogenomics of the RNA world: structural RNA polymorphisms in drug therapy. Clin. Pharmacol. Ther. 89, 355–365 (2011). [DOI] [PMC free article] [PubMed] [Google Scholar]
- 5. Nica, A.C. & Dermitzakis, E.T. Expression quantitative trait loci: present and future. Philos. Trans. R Soc. Lond. B Biol. Sci. 368, 20120362 (2013). [DOI] [PMC free article] [PubMed] [Google Scholar]
- 6. Sadee, W. , Hartmann, K. , Seweryn, M. , Pietrzak, M. , Handelman, S.K. & Rempala, G.A. Missing heritability of common diseases and treatments outside the protein‐coding exome. Hum. Genet. 133, 1199–1215 (2014). [DOI] [PMC free article] [PubMed] [Google Scholar]
- 7. Wang, Z. , Gerstein, M. & Snyder, M. RNA‐Seq: a revolutionary tool for transcriptomics. Nat. Rev. Genet. 10, 57–63 (2009). [DOI] [PMC free article] [PubMed] [Google Scholar]
- 8. Ellsworth, D.L. et al. Intensive cardiovascular risk reduction induces sustainable changes in expression of genes and pathways important to vascular function. Circ. Cardiovasc. Genet. 7, 151–160 (2014). [DOI] [PubMed] [Google Scholar]
- 9. Sitras, V. , Fenton, C. & Acharya, G. Gene expression profile in cardiovascular disease and preeclampsia: a meta‐analysis of the transcriptome based on raw data from human studies deposited in Gene Expression Omnibus. Placenta. 36, 170–178 (2015). [DOI] [PubMed] [Google Scholar]
- 10. Marshall, A. , Lukk, M. , Kutter, C. , Davies, S. , Alexander, G. & Odom, D.T. Global gene expression profiling reveals SPINK1 as a potential hepatocellular carcinoma marker. PLoS One. 8, e59459 (2013). [DOI] [PMC free article] [PubMed] [Google Scholar]
- 11. Barrie, E.S. , Smith, R.M. , Sanford, J.C. & Sadee, W. mRNA transcript diversity creates new opportunities for pharmacological intervention. Mol. Pharmacol. 81, 620–630 (2012). [DOI] [PMC free article] [PubMed] [Google Scholar]
- 12. Hartmann, K. , Seweryn, M. , Handleman, S.K. , Rempala, G. A. & Sadee, W. Non‐linear interactions between candidate genes of myocardial infarction revealed in mRNA expression profiles. BMC Genomics. 17, 738 (2016). [DOI] [PMC free article] [PubMed] [Google Scholar]
- 13. Shendure, J. The beginning of the end for microarrays? Nat. Methods. 5, 585–587 (2008). [DOI] [PubMed] [Google Scholar]
- 14. Nagalakshmi, U. et al. The transcriptional landscape of the yeast genome defined by RNA sequencing. Science. 320, 1344–1349 (2008). [DOI] [PMC free article] [PubMed] [Google Scholar]
- 15. Moret, I. et al. Assessing an improved protocol for plasma microRNA extraction. PLoS One. 8, e82753 (2013). [DOI] [PMC free article] [PubMed] [Google Scholar]
- 16. Mascarenhas, R. et al. Allele‐Selective Transcriptome Recruitment to Polysomes Primed for Translation: Protein‐Coding and Noncoding RNAs, and RNA Isoforms. PLoS One. 10, e0136798 (2015). [DOI] [PMC free article] [PubMed] [Google Scholar]
- 17. Han, Y. , Gao, S. , Muegge, K. , Zhang, W. & Zhou, B. Advanced applications of RNA sequencing and challenges. Bioinform Biol. Insights. 9(Suppl 1), 29–46 (2015). [DOI] [PMC free article] [PubMed] [Google Scholar]
- 18. Conesa, A. et al. A survey of best practices for RNA‐seq data analysis. Genome Biol. 17,13 (2016). [DOI] [PMC free article] [PubMed] [Google Scholar]
- 19. Sims, D. , Sudbery, I. , Ilott, N. E. , Heger, A. & Ponting, C. P. Sequencing depth and coverage: key considerations in genomic analyses. Nat. Rev. Genet. 15, 121–132 (2014). [DOI] [PubMed] [Google Scholar]
- 20. The ENCODE Consortium . Standards, Guidelines and Best Practices for RNA‐Seq <https://genome.ucsc.edu/ENCODE/protocols/dataStandards/ENCODE_RNAseq_Standards_V1.0.pdf>(2011) Accessed 2016 September.
- 21. Martin, J.A. & Wang, Z. Next‐generation transcriptome assembly. Nat. Rev. Genet. 12, 671–682 (2011). [DOI] [PubMed] [Google Scholar]
- 22. Engstrom, P.G. et al. Systematic evaluation of spliced alignment programs for RNA‐seq data. Nat. Methods. 10, 1185–1191 (2013). [DOI] [PMC free article] [PubMed] [Google Scholar]
- 23. Costa, V. , Aprile, M. , Esposito, R. & Ciccodicola, A. RNA‐Seq and human complex diseases: recent accomplishments and future perspectives. Eur. J. Hum. Genet. 21, 134–142 (2013). [DOI] [PMC free article] [PubMed] [Google Scholar]
- 24. Caceres, J.F. & Kornblihtt, A.R. Alternative splicing: multiple control mechanisms and involvement in human disease. Trends Genet. 18, 186–193 (2002). [DOI] [PubMed] [Google Scholar]
- 25. Scotti, M.M. & Swanson, M.S. RNA mis‐splicing in disease. Nat. Rev. Genet. 17, 19–32 (2016). [DOI] [PMC free article] [PubMed] [Google Scholar]
- 26. Wang, G.S. & Cooper, T.A. Splicing in disease: disruption of the splicing code and the decoding machinery. Nat. Rev. Genet. 8, 749–761 (2007). [DOI] [PubMed] [Google Scholar]
- 27. Singh, R.K. & Cooper, T.A. Pre‐mRNA splicing in disease and therapeutics. Trends Mol. Med. 18, 472–482 (2012). [DOI] [PMC free article] [PubMed] [Google Scholar]
- 28. Pan, Q. , Shai, O. , Lee, L.J. , Frey, B.J. & Blencowe, B.J. Deep surveying of alternative splicing complexity in the human transcriptome by high‐throughput sequencing. Nat. Genet. 40, 1413–1415 (2008). [DOI] [PubMed] [Google Scholar]
- 29. Wang, E.T. et al. Alternative isoform regulation in human tissue transcriptomes. Nature. 456, 470–476 (2008). [DOI] [PMC free article] [PubMed] [Google Scholar]
- 30. Lu, Z.X. , Jiang, P. & Xing, Y. Genetic variation of pre‐mRNA alternative splicing in human populations. Wiley Interdiscip. Rev. RNA. 3, 581–592 (2012). [DOI] [PMC free article] [PubMed] [Google Scholar]
- 31. Tress, M.L. et al. The implications of alternative splicing in the ENCODE protein complement. Proc. Natl. Acad. Sci. USA. 104, 5495–5500 (2007). [DOI] [PMC free article] [PubMed] [Google Scholar]
- 32. Hindorff, L.A. et al. Potential etiologic and functional implications of genome‐wide association loci for human diseases and traits. Proc. Natl. Acad. Sci. USA. 106, 9362–9367 (2009). [DOI] [PMC free article] [PubMed] [Google Scholar]
- 33. Cheung, V.G. , Spielman, R.S. , Ewens, K.G. , Weber, T.M. , Morley, M. & Burdick, J.T. Mapping determinants of human gene expression by regional and genome‐wide association. Nature. 437, 1365–1369 (2005). [DOI] [PMC free article] [PubMed] [Google Scholar]
- 34. Stranger, B.E. et al. Relative impact of nucleotide and copy number variation on gene expression phenotypes. Science. 315, 848–853 (2007). [DOI] [PMC free article] [PubMed] [Google Scholar]
- 35. Rockman, M.V. & Kruglyak, L. Genetics of global gene expression. Nat. Rev. Genet. 7, 862–872 (2006). [DOI] [PubMed] [Google Scholar]
- 36. Majewski, J. & Pastinen, T. The study of eQTL variations by RNA‐seq: from SNPs to phenotypes. Trends Genet. 27,72–79 (2011). [DOI] [PubMed] [Google Scholar]
- 37. Consortium, G.T. The Genotype‐Tissue Expression (GTEx) project. Nat. Genet. 45,580–585 (2013). [DOI] [PMC free article] [PubMed] [Google Scholar]
- 38. Pastinen, T. Genome‐wide allele‐specific analysis: insights into regulatory variation. Nat. Rev. Genet. 11, 533–538 (2010). [DOI] [PubMed] [Google Scholar]
- 39. Chuang, L.C. , Kao, C.F. , Shih, W.L. & Kuo, P.H. Pathway analysis using information from allele‐specific gene methylation in genome‐wide association studies for bipolar disorder. PLoS One. 8,e53092 (2013). [DOI] [PMC free article] [PubMed] [Google Scholar]
- 40. Johnson, A.D. et al. Polymorphisms affecting gene transcription and mRNA processing in pharmacogenetic candidate genes: detection through allelic expression imbalance in human target tissues. Pharmacogenet. Genomics. 18,781–791 (2008). [DOI] [PMC free article] [PubMed] [Google Scholar]
- 41. Bryois, J. et al. Cis and trans effects of human genomic variants on gene expression. PLoS Genet. 10, e1004461 (2014). [DOI] [PMC free article] [PubMed] [Google Scholar]
- 42. Albert, F.W. & Kruglyak, L. The role of regulatory variation in complex traits and disease. Nat. Rev. Genet. 16, 197–212 (2015). [DOI] [PubMed] [Google Scholar]
- 43. Wang, D. , Poi, M.J. , Sun, X. , Gaedigk, A. , Leeder, J.S. & Sadee, W. Common CYP2D6 polymorphisms affecting alternative splicing and transcription: long‐range haplotypes with two regulatory variants modulate CYP2D6 activity. Hum. Mol. Genet. 23, 268–278 (2014). [DOI] [PMC free article] [PubMed] [Google Scholar]
- 44. Petretto, E. et al. Heritability and tissue specificity of expression quantitative trait loci. PLoS Genet. 2, e172 (2006). [DOI] [PMC free article] [PubMed] [Google Scholar]
- 45. Zhu, J. et al. Integrating large‐scale functional genomic data to dissect the complexity of yeast regulatory networks. Nat. Genet. 40, 854–861 (2008). [DOI] [PMC free article] [PubMed] [Google Scholar]
- 46. Brem, R.B. , Storey, J.D. , Whittle, J. & Kruglyak, L. Genetic interactions between polymorphisms that affect gene expression in yeast. Nature. 436, 701–703 (2005). [DOI] [PMC free article] [PubMed] [Google Scholar]
- 47. Orozco, L.D. et al. Unraveling inflammatory responses using systems genetics and gene‐environment interactions in macrophages. Cell. 151, 658–670 (2012). [DOI] [PMC free article] [PubMed] [Google Scholar]
- 48. Ghazalpour, A. et al. Comparative analysis of proteome and transcriptome variation in mouse. PLoS Genet. 7, e1001393 (2011). [DOI] [PMC free article] [PubMed] [Google Scholar]
- 49. Morley, M. et al. Genetic analysis of genome‐wide variation in human gene expression. Nature. 430, 743–747 (2004). [DOI] [PMC free article] [PubMed] [Google Scholar]
- 50. Huan, T. et al. A meta‐analysis of gene expression signatures of blood pressure and hypertension. PLoS Genet. 11, e1005035 (2015). [DOI] [PMC free article] [PubMed] [Google Scholar]
- 51. Carpenter, A.E. & Sabatini, D.M. Systematic genome‐wide screens of gene function. Nat. Rev. Genet. 5, 11–22 (2004). [DOI] [PubMed] [Google Scholar]
- 52. van Dam, S. , Vosa, U. , van der Graaf, A. , Franke, L. & de Magalhaes, J.P. Gene co‐expression analysis for functional classification and gene‐disease predictions. Brief Bioinform. (2017). [DOI] [PMC free article] [PubMed] [Google Scholar]
- 53. Ballouz, S. , Verleyen, W. & Gillis, J. Guidance for RNA‐seq co‐expression network construction and analysis: safety in numbers. Bioinformatics. 31, 2123–2130 (2015). [DOI] [PubMed] [Google Scholar]
- 54. Zhao, Y. et al. NONCODE 2016: an informative and valuable data source of long non‐coding RNAs. Nucleic Acids Res. 44(D1), D203–208 (2016). [DOI] [PMC free article] [PubMed] [Google Scholar]
- 55. Khalil, A.M. et al. Many human large intergenic noncoding RNAs associate with chromatin‐modifying complexes and affect gene expression. Proc. Natl. Acad. Sci. USA. 106, 11667–11672 (2009). [DOI] [PMC free article] [PubMed] [Google Scholar]
- 56. Jin, G. et al. Human polymorphisms at long non‐coding RNAs (lncRNAs) and association with prostate cancer risk. Carcinogenesis. 32, 1655–1659 (2011). [DOI] [PMC free article] [PubMed] [Google Scholar]
- 57. Yuan, J.H. et al. The MBNL3 splicing factor promotes hepatocellular carcinoma by increasing PXN expression through the alternative splicing of lncRNA‐PXN‐AS1. Nat. Cell Biol. (2017). [DOI] [PubMed] [Google Scholar]
- 58. Richard, H. et al. Prediction of alternative isoforms from exon expression levels in RNA‐Seq experiments. Nucleic Acids Res. 38, e112 (2010). [DOI] [PMC free article] [PubMed] [Google Scholar]
- 59. Newton‐Cheh, C. et al. Genome‐wide association study identifies eight loci associated with blood pressure. Nat. Genet. 41, 666–676 (2009). [DOI] [PMC free article] [PubMed] [Google Scholar]
- 60. Levy, D. et al. Genome‐wide association study of blood pressure and hypertension. Nat. Genet. 41, 677–687 (2009). [DOI] [PMC free article] [PubMed] [Google Scholar]
- 61. International Consortium for Blood Pressure Genome‐Wide Association S et al. Genetic variants in novel pathways influence blood pressure and cardiovascular disease risk. Nature. 478, 103–109 (2011). [DOI] [PMC free article] [PubMed] [Google Scholar]
- 62. Munroe, P.B. , Barnes, M.R. & Caulfield, M.J. Advances in blood pressure genomics. Circ. Res. 112, 1365–1379 (2013). [DOI] [PubMed] [Google Scholar]
- 63. Cowley, A.W., Jr. et al. Characterization of biological pathways associated with a 1.37 Mbp genomic region protective of hypertension in Dahl S rats. Physiol Genomics. 46, 398–410 (2014). [DOI] [PMC free article] [PubMed] [Google Scholar]
- 64. Tain, Y.L. , Huang, L.T. , Chan, J.Y. & Lee, C.T. Transcriptome analysis in rat kidneys: importance of genes involved in programmed hypertension. Int. J. Mol. Sci. 16, 4744–4758 (2015). [DOI] [PMC free article] [PubMed] [Google Scholar]
- 65. Harismendy, O. et al. 9p21 DNA variants associated with coronary artery disease impair interferon‐gamma signalling response. Nature. 470, 264–268 (2011). [DOI] [PMC free article] [PubMed] [Google Scholar]
- 66. Small, K.S. et al. Identification of an imprinted master trans regulator at the KLF14 locus related to multiple metabolic phenotypes. Nat. Genet. 43, 561–564 (2011). [DOI] [PMC free article] [PubMed] [Google Scholar]
- 67. Musunuru, K. et al. From noncoding variant to phenotype via SORT1 at the 1p13 cholesterol locus. Nature. 466, 714–719 (2010). [DOI] [PMC free article] [PubMed] [Google Scholar]
- 68. Kapoor, A. et al. An enhancer polymorphism at the cardiomyocyte intercalated disc protein NOS1AP locus is a major regulator of the QT interval. Am. J. Hum. Genet. 94, 854–869 (2014). [DOI] [PMC free article] [PubMed] [Google Scholar]
- 69. Frayling, T.M. et al. A common variant in the FTO gene is associated with body mass index and predisposes to childhood and adult obesity. Science. 316, 889–894 (2007). [DOI] [PMC free article] [PubMed] [Google Scholar]
- 70. Claussnitzer, M. et al. FTO obesity variant circuitry and adipocyte browning in humans. N. Engl. J. Med. 373, 895–907 (2015). [DOI] [PMC free article] [PubMed] [Google Scholar]
- 71. Glastonbury, C.A. et al. Adiposity‐dependent regulatory effects on multi‐tissue transcriptomes. Am. J. Hum. Genet. 99, 567–579 (2016). [DOI] [PMC free article] [PubMed] [Google Scholar]
- 72. di Salvo, T.G. , Yang, K.C. , Brittain, E. , Absi, T. , Maltais, S. & Hemnes, A. Right ventricular myocardial biomarkers in human heart failure. J. Card. Fail. 21, 398–411 (2015). [DOI] [PMC free article] [PubMed] [Google Scholar]
- 73. Di Salvo, T. G. et al. Right ventricular long noncoding RNA expression in human heart failure. Pulm. Circ. 5, 135–161 (2015). [DOI] [PMC free article] [PubMed] [Google Scholar]
- 74. Liu, Y. et al. RNA‐Seq identifies novel myocardial gene expression signatures of heart failure. Genomics. 105, 83–89 (2015). [DOI] [PMC free article] [PubMed] [Google Scholar]
- 75. Mahmood, S.S. , Levy, D. , Vasan, R.S. & Wang, T.J. The Framingham Heart Study and the epidemiology of cardiovascular disease: a historical perspective. Lancet. 383, 999–1008 (2014). [DOI] [PMC free article] [PubMed] [Google Scholar]
- 76. Kraus, W.E. et al. A guide for a cardiovascular genomics biorepository: The CATHGEN experience. J. Cardiovasc. Transl. Res. 8, 449–457 (2015). [DOI] [PMC free article] [PubMed] [Google Scholar]
- 77. Wang, L. & McLeod, H.L. , Weinshilboum, R. M. Genomics and drug response. N. Engl. J. Med. 364, 1144–1153 (2011). [DOI] [PMC free article] [PubMed] [Google Scholar]
- 78. Evans, W.E. & McLeod, H.L. Pharmacogenomics–drug disposition, drug targets, and side effects. N. Engl. J. Med. 348, 538–549 (2003). [DOI] [PubMed] [Google Scholar]
- 79. Cancer Genome Atlas Research N et al. The Cancer Genome Atlas Pan‐Cancer analysis project. Nat. Genet. 45, 1113–1120 (2013). [DOI] [PMC free article] [PubMed] [Google Scholar]
- 80. Chittani, M. et al. TET2 and CSMD1 genes affect SBP response to hydrochlorothiazide in never‐treated essential hypertensives. Journal of Hypertension. 33, 1301–1309 (2015). [DOI] [PMC free article] [PubMed] [Google Scholar]
- 81. Barretina, J. et al. The Cancer Cell Line Encyclopedia enables predictive modelling of anticancer drug sensitivity. Nature. 483, 603–607 (2012). [DOI] [PMC free article] [PubMed] [Google Scholar]
- 82. Liu, X. et al. A systematic study on drug‐response associated genes using baseline gene expressions of the Cancer Cell Line Encyclopedia. Sci. Rep. 6, 22811 (2016). [DOI] [PMC free article] [PubMed] [Google Scholar]
- 83. Kim, H.S. et al. Systematic identification of molecular subtype‐selective vulnerabilities in non‐small‐cell lung cancer. Cell. 155, 552–566 (2013). [DOI] [PMC free article] [PubMed] [Google Scholar]
- 84. Slamon, D. et al. Adjuvant trastuzumab in HER2‐positive breast cancer. N. Engl. J. Med. 365, 1273–1283 (2011). [DOI] [PMC free article] [PubMed] [Google Scholar]
- 85. Merry, C.R. et al. Transcriptome‐wide identification of mRNAs and lincRNAs associated with trastuzumab‐resistance in HER2‐positive breast cancer. Oncotarget. 7, 53230–53244 (2016). [DOI] [PMC free article] [PubMed] [Google Scholar]
- 86. Theusch, E. et al. Statin‐induced expression change of INSIG1 in lymphoblastoid cell lines correlates with plasma triglyceride statin response in a sex‐specific manner. Pharmacogenomics J. 16, 301 (2016). [DOI] [PMC free article] [PubMed] [Google Scholar]
- 87. Himes, B.E. et al. RNA‐Seq transcriptome profiling identifies CRISPLD2 as a glucocorticoid responsive gene that modulates cytokine function in airway smooth muscle cells. PLoS One. 9, e99625 (2014). [DOI] [PMC free article] [PubMed] [Google Scholar]
- 88. Abstracts: ASCPT 2016 Annual Meeting & Quantitative Translational Approaches in Oncology Pre‐Conference. Clin. Pharmacol. Ther. 99(Suppl 1), S5–107 (2016). [DOI] [PubMed] [Google Scholar]