

Abstract
Background and Purpose
Hydrogen sulfide (H2S) is a gaseous signal molecule with antioxidative properties. Sirtuin 3 (SIRT3) is closely associated with mitochondrial function and oxidative stress. The study was to investigate whether and how H2S improved myocardial hypertrophy via a SIRT3‐dependent manner.
Experimental Approach
Neonatal rat cardiomyocytes were pretreated with NaHS (50 μM) for 4 h followed by angiotensin II (Ang II, 100 nM) for 24 h. SIRT3 was silenced with siRNA technology. SIRT3 promoter activity and expression, cell surface, hypertrophic gene mRNA expression, mitochondrial oxygen consumption rate and membrane potential were measured. Male 129S1/SvImJ [wild‐type (WT)] and SIRT3 knockout (KO) mice were injected with NaHS (50 μmol·kg−1·day−1; i.p.) followed by transverse aortic constriction (TAC). Echocardiography, heart mass, mitochondrial ultrastructure, volume and number, oxidative stress, mitochondria fusion and fission‐related protein expression were measured.
Key Results
In vitro, NaHS increased SIRT3 promoter activity and SIRT3 expression in Ang II‐induced cardiomyocyte hypertrophy. SIRT3 silencing abolished the ability of NaHS to reverse the Ang II‐induced cardiomyocyte hypertrophy, mitochondrial function impairment and permeability potential dysfunction, along with the decline in FOXO3a and SOD2 expression. In vivo, after TAC. NaHS attenuated myocardial hypertrophy, inhibited oxidative stress, improved mitochondrial ultrastructure, suppressed mitochondrial volume but increased mitochondrial numbers, enhanced OPA1, MFN1 and MFN2 expression but suppressed DRP1 and FIS1 expression in WT mice but not in SIRT3 KO mice
Conclusion and Implications
NaHS improved mitochondrial function and inhibited oxidative stress in myocardial hypertrophy in a SIRT3‐dependent manner.
Linked Articles
This article is part of a themed section on Spotlight on Small Molecules in Cardiovascular Diseases. To view the other articles in this section visit http://onlinelibrary.wiley.com/doi/10.1111/bph.v175.8/issuetoc
Tables of Links
| LIGANDS | |
|---|---|
| Angiotensin II | H2S |
| ANP | L‐cysteine |
| ATP | NaHS http://www.guidetopharmacology.org/GRAC/LigandDisplayForward?ligandId=4782 |
| BNP |
These Tables list key protein targets and ligands in this article which are hyperlinked to corresponding entries in http://www.guidetopharmacology.org, the common portal for data from the IUPHAR/BPS Guide to PHARMACOLOGY (Southan et al., 2016), and are permanently archived in the Concise Guide to PHARMACOLOGY 2015/16 (Alexander et al., 2015).
Abbreviations
- Ang II
angiotensin II
- ANP
atrial natriuretic peptide
- BNP
brain natriuretic peptide
- CBS
cystathionine β‐synthase
- CSE
cystathionine γ‐lyase
- DBP
diastolic BP
- DHE
dihydroethidium
- DRP1
dynamin‐related protein 1
- EF
ejection fraction
- FIS1
mitochondrial fission 1 protein
- FOXO3a
forkhead box O3a
- FS
fraction shortening
- GYY4137
p‐methoxyphenyl)morpholino‐phosphinodithioic acid
- HMI
heart mass index
- HW
heart weight
- IVS
interventricular septum
- LVPW
left ventricular posterior wall
- LVW
left ventricular weight
- MAP
mean arterial pressure
- MDA
malondialdehyde
- MFN1
mitofusin 1
- MFN2
mitofusin 2
- MPST
3‐mercaptypyruvate sulfurtransferase
- OCR
oxygen consumption rate
- OPA1
optic atrophy 1
- PGC‐1α
PPARγ coactivator‐1α
- SBP
systolic BP
- SIR2
silent information regulator 2
- SIRT3
sirtuin 3
- TAC
transverse aortic constriction
- T‐AOC
total antioxidant capacity
- TL
tibia length
- β‐MHC
β‐myosin heavy chain
Introduction
Myocardial hypertrophy is characterized by increased myocardial cell volume, greater ventricular wall thickness and enhanced myocardial contractility in the early stage of overload pressure (Shimizu and Minamino, 2016). However, myocardial hypertrophy gradually becomes more severe, accompanied with serious interstitial fibrosis, deteriorating cardiac function and disordered energy metabolism if suffering from persistent pathological stress. Myocardial hypertrophy may develop into heart failure, which is an independent risk factor of cardiovascular diseases (Lazzeroni et al., 2016). It is important to find more effective targets in the attempt to attenuate myocardial hypertrophy (Rodrigues et al., 2016).
Hydrogen sulfide (H2S) is a gas that smells of rotten eggs. High concentrations of H2S are toxic to the nervous system, immune system and reproductive system (Meng et al., 2015). In recent years, H2S has emerged as an endogenous gaseous signal molecule, which plays a vital role in physiological functions (Liu et al., 2013; Meng et al., 2015; Wu et al., 2015; Feliers et al., 2016; Szabo, 2017). Exogenous H2S reduced coronary artery wall thickness in the spontaneously hypertensive rat, which might be related to inhibition of ROS (Shi et al., 2007). H2S attenuated phenylephrine‐induced cardiomyocyte hypertrophy via improved glucose metabolism or up‐regulation of mir‐133 (Liu et al., 2011; Liang et al., 2015). H2S also prevented endothelin‐ or smoking‐induced enhancement of left ventricular mass (Yang et al., 2014; Zhou et al., 2015). H2S attenuated myocardial hypertrophy induced by abdominal aortic constriction in rats, through connexin 43 up‐regulation (Huang et al., 2012). Our latest study confirmed that H2S regulated the transcription activities of Krüppel‐like factor 5 via sulfhydration of the transcription factor Sp1 at Cys664, to prevent myocardial hypertrophy (Meng et al., 2016). The exact mechanism(s) underlying the effects of H2S on cardiac hypertrophy in different models were not completely consistent. However, almost all studies suggested that the anti‐hypertrophic effect of H2S was closely related to its antioxidative ability (Liu et al., 2011; Lu et al., 2013; Shen et al., 2015; Zhou et al., 2015). Therefore, exploring the specific mechanism by which H2S inhibits ROS formation in myocardial hypertrophy is helpful to further understand the role of H2S in the cardiovascular system and to clarify the effective biological targets of H2S to delay or reverse myocardial hypertrophy.
The histone deacetylase SIR2, was found in yeast to be an important regulator of antioxidant genes (Oppikofer et al., 2013). In mammals, a total of seven members of the same class of histone deacetylases have been found, sirtuins 1‐7 (SIRT1–SIRT7) and these enzymes play important roles in physiological metabolism, cell survival, cancer, aging, energy restriction longevity and in pathological processes (Chakraborty and Doss, 2013; Oppikofer et al., 2013; Yao et al., 2014; Matsushima and Sadoshima, 2015; Poulose and Raju, 2015). One of these sirtuins, SIRT3, mainly located in mitochondria, is closely associated with oxidative stress (McDonnell et al., 2015; Koentges et al., 2016a,b; Ansari et al., 2017).
Currently, it is not known if H2S stimulates SIRT3‐related signalling to modulate mitochondrial function in myocardial hypertrophy. Therefore, a major goal of the present study was to determine whether H2S protected against angiotensin II (Ang II)‐induced cardiomyocyte hypertrophy and transverse aortic constriction (TAC)‐induced myocardial hypertrophy, by improving mitochondrial function in a SIRT3‐dependent manner.
Methods
Animals
All animal care and experimental procedures complied with the US National Institutes of Health Guidelines for Care and Use of Laboratory Animals and were approved by the Committee on Animal Care of Nantong University (approval no. NTU‐ERLAUA‐20150153). Animal studies are reported in compliance with the ARRIVE guidelines (Kilkenny et al., 2010; McGrath and Lilley, 2015). The animals were kept in cages in the experimental animal centre of Nantong University. The mice were fed a standard laboratory diet and tap water ad libitum with a 12 h light/dark cycle, under a temperature of 20°C.
Neonatal cardiomyocyte culture and treatment
Neonatal Sprague Dawley rats, from 1 to 3 days old were killed by decapitation and hearts were removed immediately in a sterile environment. The residual blood was washed away with PBS. Ventricular tissue was separated from the atria and digested repeatedly with 0.25% trypsin in Hanks' balanced salt solution (Beyotime, Shanghai, China; 100 μL per heart) at 37°C for 5 min once. After 7–10 cycles of digestion, all supernatants were collected together (except the first time). DMEM (Wisent Inc, Pitt Meadows, BC, Canada) containing 10% FBS (Wisent Inc) was added to terminate digestion with the same volume of supernatants (about 100 μL per heart). After centrifugation at 1000 x g for 5 min, the cell pellet was resuspended in DMEM containing 10% FBS and cultured at 37°C in a humidified 5% CO2 incubator. Four hours later, the cardiomyocytes were in suspension in the culture medium, while the cardiac fibroblasts adhered to the wall of the dishes. The cardiomyocytes and medium were transferred into another 6‐well plate for 24h. Then the medium was changed into fresh DMEM (2 mL per well) containing 10% FBS for 2 or 3 days. Then the medium was changed to DMEM supplemented with 0.5% FBS (2 mL per well) for 24 h, Cells (105 cells mL‐1) were then incubated (37°C) with NaHS (50 μM) or GYY4137 (50 μM, provided by Professor Philip K. Moore from the National University of Singapore) for 4 h. Ang II (100 nM final concentration) was then added to the cells and incubation continued for another 24 h. Cardiomyocytes (2x 10⁵ cells) were digested with 1 mL of 0.1% trypsin (Sigma‐Aldrich, St. Louis, MO) in Hanks' balanced salt solution for about 10 s at room temperature. DMEM containing 10% FBS (1 mL) was added to terminate digestion immediately. The cells were then photographed using an inverted microscope (magnification 10×). Cell surface area of cardiomyocytes was calculated using Imagepro‐Plus system.
Luciferase reporter assay
Neonatal rat cardiomyocytes (105 cells) were cultured in 12‐well plates with DMEM and 10% FBS (1mL) for 24 h and then were transfected with 1 μg SIRT3 promoter luciferase fusion plasmid (provided by Professor Yongsheng Chang from Peking Union Medical College) and 0.1 μg of pRL‐TK reporter plasmid (control reporter) using Lipofectamine 3000 reagent (Invitrogen, Carlsbad, CA, USA). Twenty‐four hours later, the medium was changed to DMEM with antibiotics and 10% FBS (1 mL ) and cells incubated with NaHS (50 μM) for 4h, followed by Ang II (100 nM) stimulation for 24 h. Cells were harvested in cell lysis buffer, and luciferase activity was evaluated with a dual luciferase reporter assay system (Promega, Madison, WI, USA). The relative luciferase activities compared with the luciferase activities of pRL‐TK were determined in triplicate and normalized to that of control reporter.
SIRT3 RNA interference
Neonatal rat cardiomyocytes (105 cells mL‐1) were cultured in 6‐well plates with DMEM, antibiotics and 10% FBS (2 mL per well) for 24 h. Then the medium was changed to DMEM without antibiotics and FBS (2 mL per well) for 2 h. The cells were then transfected with double‐strand RNA oligonucleotides (2 μL, 20 μM) specific for rat SIRT3 (SIRT3 siRNA, sense, 5′‐CCAUCUUUGAACUAGGCUUTT‐3′, and antisense, 5′‐AAGCCUAGUUCAAAGAUGGTT‐3′; GenePharma, Shanghai, China) using 4 μL Lipofectamine 3000 reagent (Invitrogen) at 37 °C. Commercially available non‐specific control siRNA (2 μL, 20 μM) with random sequences (NC siRNA, sense, 5'‐UUCUCCGAACGUGUCACGUTT‐3', antisense, 5'‐ACGUGACACGUUCGGAGAATT‐3') were transfected using 4 μL Lipofectamine 3000 reagent at 37 °C. Medium was changed to DMEM and 10% FBS after 4 h. Another twenty hours later, the cells were washed with PBS twice and were harvested in cell lysis buffer (60 μL per well). The efficiency of SIRT3 silencing was detected by Western blots. The cells were then pretreated with NaHS (50 μM) for 4 h followed by Ang II (100 nM) for 24 h, as described above.
Cardiomyocyte area was measured as described above. Expression of mRNA and protein for atrial natriuretic peptide (ANP), brain natriuretic peptide (BNP) and β‐myosin heavy chain (β‐MHC) expression was measured with Western blot and real time PCR. Oxidative stress was measured as superoxide formation, using fluorescence microscopy and the fluorescent probe dihydroethidium (DHE). These procedures are detailed below.
Mitochondrial respiration assessment
Neonatal rat cardiomyocytes were plated (about 1000 cells per well) in an XF96‐well plate (Seahorse Bioscience, Massachusetts, USA) and transfected with SIRT3 siRNA or NC siRNA, as described above. Twenty‐four hours later, the cells were pretreated with NaHS (50 μM, 4 h), followed by addition of medium or Ang II (100 nM) for 24 h. Immediately before the respiration assay, the medium was changed to unbuffered DMEM containing glucose (10 mM), pyruvate (10 mM) and GlutaMAX (2 mM; Invitrogen). Mitochondrial respiration oxygen consumption rate (OCR) was measured by a Seahorse Extracellular Flux Analyzer XF96 (Seahorse Bioscience) according to our previous procedure (Xie et al., 2016). Firstly, basal respiration was measured in an unbuffered medium. Then oligomycin (2 μg·mL−1) was added to inhibit ATP synthesis and to detect respiration linked to ATP production. The uncoupler carbonyl cyanide 4‐(trifluoromethoxy) phenylhydrazone (FCCP, 2 μM) was applied to measure respiratory reserve capacity and maximal respiration. Finally, combination of rotenone plus antimycin A (rot & AA, 4 μM) was added to inhibit complexes III and I, in order to completely block mitochondrial oxygen consumption.
Assessment of mitochondrial membrane potential (Δψm)
The mitochondrial membrane potential (Δψm) was measured with a commercial JC‐1 kit (Beyotime, Shanghai, China) following the manufacturer's instructions. Briefly, after SIRT3 siRNA or NC siRNA was transfected into cardiomyocytes for 24 h, cardiomyocytes were pretreated with NaHS (50 μM) for 4 h followed by Ang II (100 nM) for 24 h. Cells were rinsed with PBS and incubated in 1 mL JC‐1 staining solution at 37°C for 20 min. In healthy cells with normal membrane potential, JC‐1 went through the mitochondrial membrane to form aggregates and emitted red fluorescence (570 nm). In damaged cells with mitochondrial membrane potential depolarization, JC‐1 failed to accumulate in the mitochondrial matrix. Monomers of JC‐1 was formed to emit green fluorescence (535 nm). The intensity of red (aggregate JC‐1)/green (monomeric JC‐1) fluorescence was detected with an inverted microscope (Olympus, Tokyo, Japan), and the ratio of the red: green fluorescence was proportional to the Δψm.
Animals and treatment
Male 8‐week‐old adult 129S1/SvImJ (WT) and SIRT3 knockout (KO) mice (18–22 g) were randomly assigned to treatment with NaHS (50 μmol·kg−1·day−1), GYY4137 (133 μmol·kg−1·day−1) or saline once daily (Xie et al., 2016). Two weeks later, mice were anaesthetized with a mixture of ketamine (100 mg·kg−1) and xylazine (5 mg·kg−1) by intraperitoneal injection. Anaesthesia was monitored by the lack of reflex to toe pinching. The chest cavity was opened in the second intercostal space at the left upper sternal border through a small incision and the animals were ventilated with a respirator. After the aortic arch was exposed, TAC was carried out between the left common carotid artery and the brachiocephalic artery, by tying a 6‐0 nylon suture ligature against a 26‐gauge needle. After the needle was withdrawn quickly, an incomplete constriction was formed. In the sham operation group, mice were subjected to the same surgical procedures but without the constriction. At the end of the procedure, the chest was closed by sutures. All of the mice received NaHS (50 μmol·kg−1·day−1) or saline for another 2 weeks. The mice were monitored closely for any signs of post‐operative pain or labored breathing. In the case of any signs of pain, animals received buprenorphine (TIPR Pharmaceutical Responsible Co., Ltd, Tianjin, China; 0.1‐2.5 mg·kg−1, by s.c. injection) every 6‐12 h, as needed. There was no post‐operative deaths in our experiments.
Echocardiography
After treatment, mice were anaesthetised with isoflurane (1–2%). After cutting off hair carefully on the left chest, cardiac geometry was measured from the parasternal long axis view using a small animal colour ultrasonic diagnostic apparatus (Visual Sonic Vevo 2100, Toronto, ON, Canada) with a probe frequency of 30 MHz. A clear image of the left ventricular area was recorded using M‐type echocardiography. Thickness of interventricular septum (IVS) and left ventricular posterior wall (LVPW) was detected. Ejection fraction (EF) and left ventricular fraction shortening (FS) were then calculated based on the mean values from 10 cardiac cycles.
BP measure
During treatment, non‐invasive systolic BP (SBP) was measured by the tail cuff method (Visitech Systems, Apex, NC, USA) every week. After echocardiography, anaesthesia was induced using 3% isoflurane in oxygen (3 L·min−1 ) and maintained with 2.5% isoflurane. The right carotid artery was then cannulated with a polyethylene catheter filled with heparin saline to the proximal end. This allowed invasive SBP, diastolic BP (DBP) and mean arterial pressure (MAP) to be recorded by a pressure transducer connected with a biological signal acquisition system (MedLab‐U/4C501, Nanjing, China).
Measurement of H2S in plasma and H2S production in myocardium
H2S concentration in culture medium or plasma was measured using a H2S‐specific microelectrode (ISO‐H2S‐2; World Precision Instruments, Sarasota, FL, USA) connected to a free radical analyser (TBR4100; World Precision Instruments) as previously described (Xie et al., 2016). The sensor was depolarized prior to the start of the experiment and then calibrated with 0.5, 1, 2, 4 and 8 μmol·L−1 Na2S, to provide a standard curve. Experimental values (H2S concentration in culture medium or plasma) were calculated from the standard curve.
Myocardium was homogenized in iced 100 mM potassium phosphate buffer (1/10, w/v). Samples of myocardial homogenate (460 μL) were incubated with 20 μL l‐cysteine (10 mmol·L−1) and 20 μL pyridoxal 5′‐phosphate (2 mmol·L−1) in tightly sealed vials for 30 min at 37°C. The concentration of H2S in the incubation mixture was measured using a H2S‐specific microelectrode, as described above. Finally, H2S production in the myocardium, representing the activity of enzymes for H2S production, was corrected for the protein content of the homogenate. The expression of mRNA for cystathionine γ‐lyase (CSE), cystathionine β‐synthase (CBS) and 3‐mercaptypyruvate sulfurtransferase (MPST) was carried out by real‐time PCR.
Determination of cardiac index
After arterial BP was measured, the mice were killed with an overdose of isoflurane (5%). The heart was excised immediately and washed with pre‐cooled saline to remove any blood clots. All of the connective tissues and vessels attached on the heart were also removed. The heart was dried with filter paper and then weighed (HW) with an electronic balance. The left ventricular weight (LVW), including ventricular septal weight, was determined after the atrium and right ventricle had been removed. The heart mass index (HMI) and left ventricular mass index (LVMI) was calculated as the ratio of HW to body weight (BW) and LVW to BW respectively. Tibia length (TL) was measured from the edge of the tibial plateau to the medial malleolus distance on the right hindlimb. The ratios of LVW to TL was calculated and represented as one index of cardiac hypertrophy. Some hearts were fixed with 4% paraformaldehyde, and paraffin sections (5μm) were prepared followed by haematoxylin and eosin staining. The stained heart was photographed and histological examination of myocardium was carried out with a light microscope.
Measurement of superoxide formation
Superoxide production in cardiomyocytes or myocardium was detected under a fluorescence microscope using the fluorescent probe dihydroethidium (DHE). Cardiomyocyte or myocardial sections (5 μm) were prepared and subsequently incubated (30 min, 37°C) in Krebs‐HEPES buffer (composition in mM: NaCl 99, KCl 4.7, MgSO4 1.2, KH2PO4 1.0, CaCl2 1.9, NaHCO3 25, glucose 11.1, Na HEPES 20; pH 7.4) with DHE (2 μM) in a light‐protected chamber. The slides were examined with a Nikon TE2000 Inverted Microscope (Nikon, Tokyo, Japan), using excitation and emission wavelengths of 480 and 610 nm respectively.
Levels of malondialdehyde (MDA) in myocardium were detected using a Lipid Peroxidation and Assay Kit, using the thiobarbituric acid method (Beyotime). Total antioxidant capacity (T‐AOC) of myocardium was measured by the T‐AOC Assay Kit with ferric reducing ability of plasma method (Beyotime). Activity of total SOD, Cu‐Zn/SOD and Mn‐SOD in myocardium was assessed with the WST‐1 (2‐(4‐iodophenyl)‐3‐(4‐nitrophenyl)‐5‐(2,4‐disulfophenyl)‐2H‐tetrazolium) method (Beyotime).
Western blots
Protein samples from cardiomyocytes or myocardium were separated by SDS‐PAGE, transferred onto a PVDF membrane (Millipore, Billerica, MA, USA). After blocking at room temperature in 5% v/v non‐fat milk with TBST buffer (Tris–HCl 10 mmol·L−1, NaCl 120 mmol·L−1, Tween‐20 0.1%; pH 7.4) for 2 h, membranes were incubated overnight with appropriate primary anti‐SIRT3 (1:1000; Santa Cruz Biotechnology, St. Louis, MO, USA); anti‐ANP (1:1000), BNP (1:1000), FOXO3a (1:1000) and SOD2 (1:1000) (Abcam, Cambridge, UK); β‐MHC (1:1000) and β‐tubulin (1:3000) (Bioworld Technology, St. Louis Park, MN, USA); mitofusin 1 (MFN1, 1:1000), mitofusin 2 (MFN2, 1:1000) and mitochondrial fission 1 protein (FIS1, 1:1000) (Cusabio, Baltimore, MD, USA); PPARγ coactivator‐1α (PGC‐1α, 1:1000; Bioss, Beijing, China); GAPDH (1:7000; Sigma‐Aldrich, St. Louis, MO, USA) at 4°C. Then membranes were incubated with HRP‐conjugated secondary antibody at room temperature for 2 h. Protein bands were visualized by enhanced chemiluminescence (Thermo Fisher Scientific Inc., Rockford, IL, USA).
Quantitative real‐time PCR
Total RNA was extracted from myocardium or cardiomyocytes using Trizol reagent (Takara, Kyoto, Japan) followed by reverse transcription using a PrimeScript™ RT Master Mix Kit (Takara). Quantitative real‐time PCR were performed with the above cDNAs using SYBR Green Fast qPCR mix (Takara) with ABI 7500 Real Time PCR System (ABI, Carlsbad, CA, USA). 18S was used as a housekeeping gene. Each cDNA from different groups was run and analysed in triplicate. Experimental cycle threshold values were normalized to 18S, and relative mRNA expression was calculated versus a control sample (structures of all primers used are listed in Table 1).
Table 1.
Sequence of primers
| Gene | Sense primer | Antisense primer |
|---|---|---|
| Rat SIRT1 | 5′‐CACCAGAAAGAACTTCACCACCAGA‐3 | 5′‐ACCATCAAGCCGCCTACTAATCTG‐3′ |
| Rat SIRT2 | 5′‐AGGGACAAGGAGCAGGGTTC‐3′ | 5′‐GAAGAGAGACAGCGGCAGGAC‐3 |
| Rat SIRT3 | 5′‐GAGGTTCTTGCTGCATGTGGTTG‐3′ | 5′‐AGTTTCCCGCTGCACAAGGTC‐3′ |
| Rat SIRT4 | 5′‐TTGTGCCAGCAAGTCCTCCTC‐3′ | 5′‐GTCTCTTGGAAAGGGTGATGAAGC‐3′ |
| Rat SIRT5 | 5′‐TCCAGCGTCCACACGAAACC‐3′ | 5′‐AACACCAGCTCCTGAGATGATGAC‐3′ |
| Rat SIRT6 | 5′‐GCTGGAGCCCAAGGAGGAATC‐3′ | 5′‐AGTAACAAAGTGAGACCACGAGAG‐3′ |
| Rat SIRT7 | 5′‐GAGCCAACCCTCACCCACATG‐3′ | 5′‐ACGCAGGAGGTACAGACTTCAATG‐3′ |
| Rat ANP | 5′‐GCTTCCGGGATGAAAACGTC‐3′ | 5′‐ACCAATCCATTGCCGACTATG‐3′ |
| Rat BNP | 5′‐CACCCGCGAGTACAACCTTC‐3′ | 5′‐CCCATACCCACCATCACACC‐3′ |
| Rat β‐MHC | 5′‐CCTCGCAATATCAAGGGAAA‐3′ | 5′‐TACAGGTGCATCAGCTCCAG‐3′ |
| Mouse ANP | 5′‐GAGAAGATGCCGGTAGAAGA‐3′ | 5′‐AAGCACTGCCGTCTCTCAGA‐3′ |
| Mouse BNP | 5′‐CTGCTGGAGCTGATAAGAGA‐3′ | 5′‐TGCCCAAAGCAGCTTGAGAT‐3′ |
| Mouse β‐MHC | 5′‐ATGTGCCGGACCTTGGAAG‐3′ | 5′‐CCTCGGGTTAGCTGAGAGATCA‐3′ |
| Mouse CSE | 5′‐GCTTGGAAAAAGCAGTGGCT‐3 | 5′‐TCGTAATGGTGGCAGCAAGA‐3 |
| Mouse CBS | 5′‐AGCTGGAACCTGCTCCTTTT‐3 | 5′‐GTTGGCTCTTGAGTCCCCTC‐3 |
| Mouse MPST | 5′‐TGGTATCTGCTACCCAACGC‐3 | 5′‐CAGAGCTCGGAAAAGTTGCG‐3 |
| Rat CSE | 5′‐GCCAGTCCTCGGGTTTTGTA‐3 | 5′‐CAGTGCAGCCACTGCTTTTT‐3 |
| Rat CBS | 5′‐ACCGCCATTGACCTGCTAAA‐3 | 5′‐GCCATTCCTTGGTTCTGGGA‐3 |
| Rat MPST | 5′‐GAGCACGTCATCTCTCAGGG‐3 | 5′‐AATTCCGGCAGCCCTCTTAC‐3 |
| 18S | 5′‐AGTCCCTGCCCTTTGTACACA‐3 | 5′‐CGATCCGAGGGCCTCACTA‐3′ |
Ultrastructural examination of myocardium
Fresh myocardium was cut into pieces of 1 mm3, fixed with 4% glutaraldehyde and 1% osmic acid in turn. The samples were dehydrated by acetone, embedded with Epon812, stained with toluidine blue, cut into slices of 70 nm and double‐stained with uranyl acetate and lead citrate. The ultrastructure of myocardial tissue was examined with a transmission electron microscope (JEM‐1230). For mitochondrial structure and quantity to be assessed, the visible image of 15 randomly selected areas per slice was photographed at 5000× magnification and the mitochondrial volumes were calculated and the mitochondrial numbers were counted.
mtDNA copy number
The ratio mtDNA versus nDNA was determined using a quantitative real‐time PCR assay, as previously described (Li and Yang, 2015). The primers were designed to target nDNA (β‐actin, 5′‐ATGGTGGGAATGGGTCAGAA‐3′ and 5′‐CTTTTCACGGTTGGCCTTAG‐3′) or mtDNA (NADH dehydrogenase 1, 5′‐AAACGCCCTAACAACCAT‐3′ and 5′‐GGATAGGATGCTCGGATT‐3′). The mtDNA content was normalized against that of β‐actin gene to calculate the relative mtDNA copy number. Each measurement was repeated in triplicate, and a non‐template control was included in each experiment.
Immunofluorescence
Frozen sections of myocardium were incubated with anti‐optic atrophy 1 (OPA1, 1:50; Santa Cruz Biotechnology) and anti‐dynamin‐related protein 1 (DRP1, 1:50; Cell Signaling Techonology, Danvers, MA, USA) antibodies overnight at 4°C followed by Alexa Fluor 488‐ or Cy3‐conjugated IgG (1:500) or at 37°C for 1 h and was then visualized with a fluorescence microscope (Nikon).
Data and statistical analysis
The data and statistical analysis in this study comply with the recommendations on experimental design and analysis in pharmacology (Curtis et al., 2015). All data are expressed as mean ± SEM and were analysed by one‐way ANOVA followed by Bonferroni post hoc test as appropriate (stata 13.0 software). Values of P < 0.05 were considered statistically significant.
Materials
NaHS and angiotensin II were supplied by Sigma‐Aldrich; rotenone and antimycin A by Seahorse Bioscience. GYY4137 was provided by Professor Philip K. Moore (National University of Singapore).
Results
NaHS promoted SIRT3 transcription and expression in Ang II‐induced cardiomyocyte hypertrophy
Exposure of neonatal cardiomyocytes to Ang II increased ANP, BNP and β‐MHC expression at both mRNA and protein levels, and these hypertrophic indicators were significantly inhibited by NaHS (Figure 1A–C).
Figure 1.
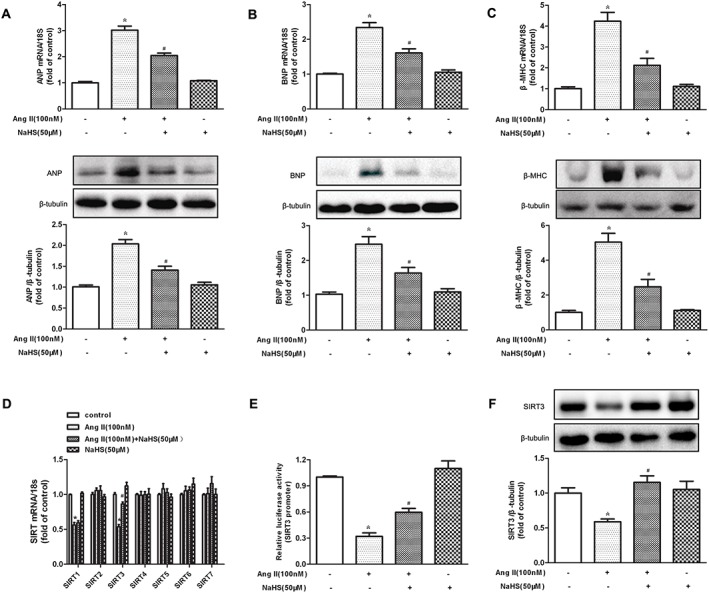
Effect of NaHS on SIRT3 transcription and expression in Ang II‐induced hypertrophy of cardiomyocytes. (A–C) Neonatal rat cardiomyocytes were pretreated with NaHS (50 μM) for 4 h followed by Ang II (100 nM) for 24 h. Quantification of ANP, BNP and β‐MHC expression in cardiomyocytes was carried out by real‐time PCR and Western blot. (D) Quantification of SIR2 family (SIRT1–SIRT7) mRNA expression was assessed by real‐time PCR. (E) Cardiomyocytes were transfected with SIRT3 promoter luciferase fusion plasmid. Twenty‐four hours later, cells were treated with NaHS (50 μM) followed by Ang II (100 nM) stimulation for 24 h. SIRT3 promoter luciferase activity was evaluated with a dual luciferase reporter assay system. (F) Quantification of SIRT3 protein expression was assessed by Western blots. * P < 0.05, significantly different from untreated cells; # P < 0.05, significantly different from cells treated with Ang II alone. n = 5.
We then assessed the involvement of SIRT1–SIRT7 in the protective effect of NaHS on cardiomyocyte hypertrophy, by examining mRNA levels after Ang II stimulation. The mRNA expression of SIRT1 and SIRT3 was reduced in Ang II‐stimulated cardiomyocytes, while that of SIRT2 and SIRT4–SIRT7 was unchanged. Expression of mRNA for SIRT3, but not SIRT1, was restored to near baseline by NaHS (50 μM, 4 h), suggesting that SIRT1 was not involved in the protective effect of NaHS on cardiomyocyte hypertrophy (Figure 1D). Moreover, NaHS alone did not alter any SIR2 mRNA expression in Ang II‐stimulated cardiomyocytes (Figure 1D). Further experiments confirmed that NaHS increased SIRT3 promoter activity and protein expression in Ang II‐stimulated cardiomyocytes (Figure 1E, F). All of these data suggested that NaHS increased SIRT3 transcription and expression in cardiomyocyte hypertrophy induced by Ang II.
NaHS attenuated Ang II‐induced cardiomyocyte hypertrophy in a SIRT3‐dependent manner
SIRT3 is highly expressed in organs or tissues with a high metabolic rate such as heart (He et al., 2016; Yue et al., 2016). SIRT3 is vital to protect against stress‐mediated cardiomyocyte death and doxorubicin‐induced myocardial injury (Chen et al., 2013; Pillai et al., 2016). The present data (see above) showed that NaHS increased SIRT3 expression in Ang II‐stimulated cardiomyocyte. However, whether enhanced SIRT3 was crucial for the inhibitory effect of NaHS on Ang II‐induced cardiomyocyte hypertrophy remained to be elucidated. Next, cell surface area, ANP, BNP and β‐MHC were measured in NaHS‐treated cardiomyocytes with SIRT3 silencing. SIRT3‐specific siRNA transfected into cardiomyocytes significantly reduced SIRT3 expression (Figure 2A). NaHS enhanced SIRT3 protein expression in Ang II‐stimulated cardiomyocyte (Figure 2B). However SIRT3 silencing prevented NaHS from attenuating Ang II‐induced cardiomyocyte enlargement and to inhibit mRNA and protein expression of ANP, BNP and β‐MHC by NaHS (Figure 2C–F). GYY4137, a water‐soluble H2S‐releasing compound, also decreased cardiomyocyte surface area and hypertrophic gene expression with Ang II stimulation, which was alleviated after SIRT3 was knocked down (Supporting Information Figure S1A–D). It is worth noting that NaHS increased the H2S concentration in the culture medium and the expression of CSE mRNA, in Ang II‐stimulated cardiomyocytes, with or without SIRT3 siRNA. There was also no significant difference in CBS and MPST mRNA expression in the cells (Supporting Information Figure S2A–D).
Figure 2.
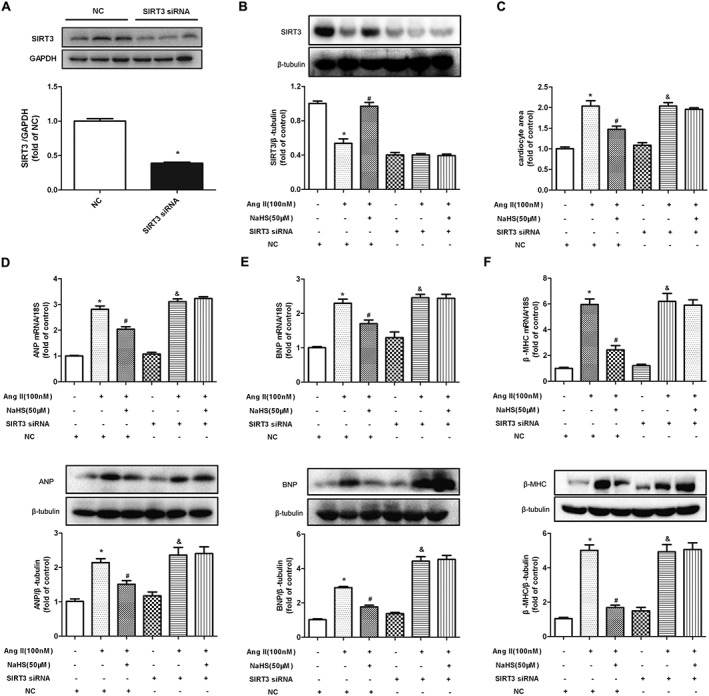
Effect of NaHS on Ang II‐induced cardiomyocyte hypertrophy after SIRT3 was silenced. (A) After SIRT3 siRNA or NC siRNA was transfected into neonatal rat cardiomyocytes for 24 h, SIRT3 protein expression was measured with Western blots. (B) After SIRT3 siRNA or NC siRNA was transfected into neonatal rat cardiomyocytes for 24 h, cells were pretreated with NaHS (50 μM) for 4 h followed by Ang II (100 nM) for 24 h. SIRT3 protein expression was measured with Western blots. (C) Cells were digested with 0.1% trypsin and photographed using an inverted microscope. Cell surface area of cardiomyocytes was calculated using Imagepro‐Plus system and normalized to cells not undergoing any drug treatment (with NC siRNA transfection). (D–F) Quantification of ANP, BNP and β‐MHC expression in cardiomyocytes was carried out by real‐time PCR and Western blots. * P < 0.05, significantly different from untreated cells (with NC siRNA transfection); # P < 0.05, significantly different from cells treated with Ang II alone (with NC siRNA transfection); & P < 0.05, significantly different from untreated cells (with SIRT3 siRNA transfection). n = 5.
NaHS improved mitochondrial function and mitochondrial permeability potential in Ang II‐stimulated cardiomyocyte in a SIRT3‐dependent manner
SIRT3 is localized in mammalian mitochondria and increased SIRT3 activity is beneficial for mitochondrial function in heart (Cheung et al., 2015; Koentges et al., 2015, 2016b; Lai et al., 2016; Yu et al., 2016). We therefore tested the effect of NaHS on OCR in cardiomyocytes with Ang II stimulation and SIRT3 silencing. Basal respiration, respiratory reserve capacity and maximal respiration were significantly decreased in Ang II‐stimulated cardiomyocytes, all of which were improved by NaHS. However, when SIRT3 was silenced, these bioenergetic parameters were no longer able to be affected by NaHS (Figure 3A, B).
Figure 3.
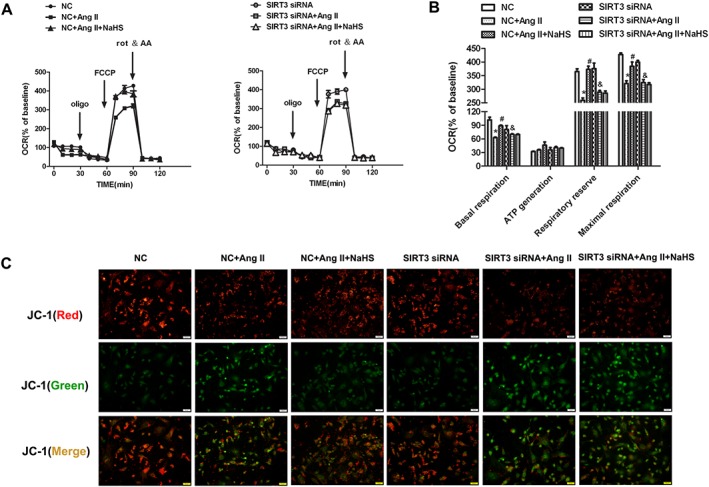
Effect of NaHS on mitochondrial function and mitochondrial permeability potential in Ang II‐stimulated cardiomyocytes after SIRT3 was silenced. After SIRT3 siRNA or NC siRNA was transfected into neonatal rat cardiomyocytes for 24 h, cells were pretreated with NaHS (50 μM) for 4 h followed by Ang II (100 nM) for 24 h. (A) The bioenergetic profiles of cardiomyocytes were measured by a Seahorse Extracellular Flux Analyzer, OCR in cells treated with oligomycin (2 μg∙mL−1), FCCP (2 μM), rot & AA (4 μM). (B) Quantitative analysis of basal respiration, ATP generation, respiratory reserve capacity and maximal respiratory is shown. (C) Mitochondrial permeability potential (Δψm) was determined by JC‐1 staining. Red fluorescence represented normal membrane potential, and green fluorescence represented mitochondrial membrane potential depolarization. Bar = 50 μm. * P < 0.05, significantly different from untreated cells (with NC siRNA transfection); # P < 0.05, significantly different from cells treated with Ang II alone (with NC siRNA transfection); & P < 0.05, significantly different from untreated cells (with SIRT3 siRNA transfection). n = 6.
Mitochondrial membrane potential (Δψm) was determined by JC‐1 staining. Normal membrane potential exhibited red fluorescence intensity, while depolarization of the mitochondrial membrane potential exhibited green fluorescence intensity. Ang II increased green fluorescence intensity but decreased red fluorescence intensity, indicating that the Δψm of the cells was significantly reduced. Pretreatment with NaHS weakened green fluorescence intensity but enhanced red fluorescence intensity, which suggested that NaHS attenuated collapse of Δψm in Ang II‐stimulated cardiomyocytes. However, when SIRT3 was knocked down, these above protective effects on mitochondrial membrane potential were absent (Figure 3C). All of these results suggested that NaHS improved mitochondrial function in Ang II‐stimulated cardiomyocytes via a SIRT3‐dependent manner.
NaHS increased FOXO3a and SOD2 expression and suppressed oxidative stress on Ang II‐stimulated cardiomyocytes in a SIRT3‐dependent manner
The data, so far, suggested that H2S up‐regulated SIRT3 to inhibit Ang II‐induced cardiomyocyte hypertrophy. However, the possible downstream effects of SIRT3 in terms of the anti‐hypertrophic activity of H2S were not clear. FOXO3a is a transcription factor whose action leads to inhibition of ROS production and SOD2 is one of the most important enzymes to reduce oxidative stress. Both FOXO3a and SOD2 are important downstream proteins in the SIRT3 signalling pathway (Sundaresan et al., 2009; Xie et al., 2016). In our experiments, NaHS increased FOXO3a and SOD2 expression and suppressed oxidative stress in Ang II‐stimulated cardiomyocytes, effects which were abolished by SIRT3 silencing (Figure 4A–D). GYY4137 also enhanced SIRT3 expression in Ang II‐stimulated cardiomyocytes (Supporting Information Figure S3A) and increased FOXO3a and SOD2 protein expression but attenuated DHE fluorescence intensity in Ang II‐stimulated cardiomyocytes, which was blunted after SIRT3 was knocked down (Supporting Information Figure S3B–D).
Figure 4.
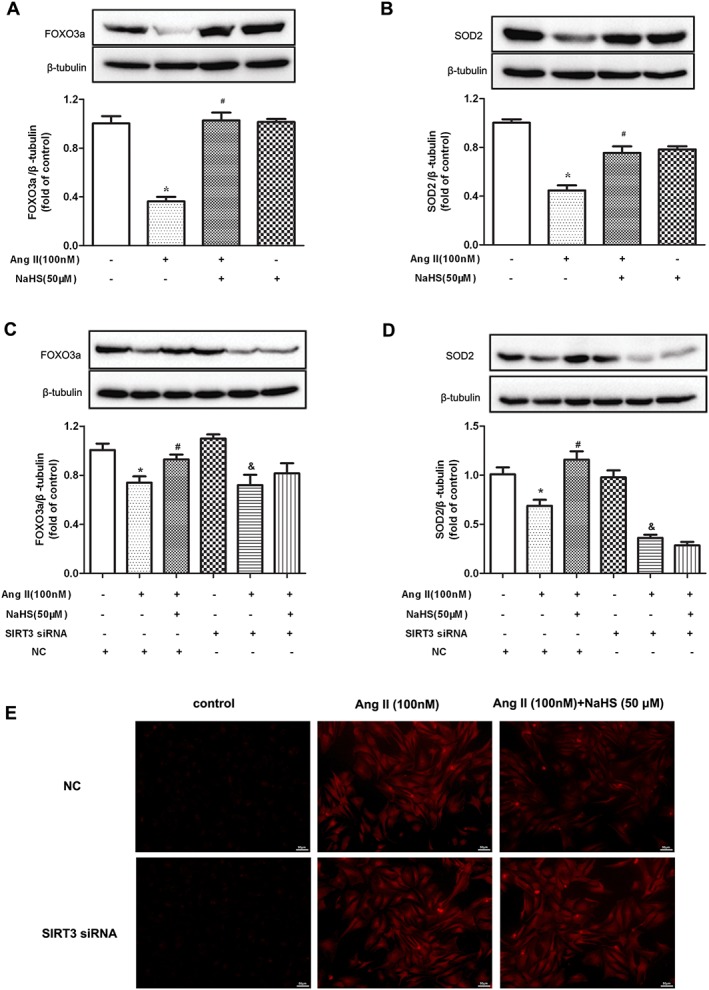
Effect of NaHS on FOXO3a, SOD2 expression and oxidative stress in Ang II‐stimulated cardiomyocytes. (A, B) Neonatal rat cardiomyocytes were pretreated with NaHS (50 μM) for 4 h followed by Ang II (100 nM) for 24 h. FOXO3a and SOD2 protein expression was measured with Western blots. * P < 0.05, significantly different from untreated cells; # P < 0.05, significantly different from cells treated with Ang II alone. n = 5. (C, D) After SIRT3 siRNA or NC siRNA was transfected into neonatal rat cardiomyocytes for 24 h, cells were pretreated with NaHS (50 μM) for 4 h followed by Ang II (100 nM) for 24 h. FOXO3a and SOD2 protein expression was measured with Western blots. * P < 0.05, significantly different from untreated cells (with NC siRNA transfection); # P < 0.05, significantly different from cells treated with Ang II alone (with NC siRNA transfection); & P < 0.05, significantly different from untreated cells (with SIRT3 siRNA transfection). n = 5. (E) Superoxide production in cardiomyocytes was detected under a fluorescence microscope with DHE fluorescent probe. Bar = 50 μm.
NaHS reduced BP and enhanced H2S level in both WT mice and SIRT3 KO mice after TAC
Our results suggested that NaHS, by regulating SIRT3, prevented Ang II‐induced cardiomyocyte hypertrophy in vitro. For further exploration of the pathophysiological role of SIRT3 in the protective effects of NaHS in vivo, myocardial hypertrophy was induced by TAC in SIRT3 KO mice. As the H2S concentration in the circulation or in the heart is closely related to BP (Cacanyiova et al., 2016; van Goor et al., 2016) and BP is one of the most important factors affecting myocardial hypertrophy (Nadruz, 2015), we measured BP and H2S level in WT mice and SIRT3 KO mice. BP measured by both non‐invasive tail cuff method and invasive artery catheterization was increased significantly after TAC. NaHS treatment (50 μmol·kg−1) reduced SBP, DBP and MAP in both WT mice and SIRT3 KO mice after TAC (Figure 5A, B). NaHS enhanced H2S concentration in plasma and myocardium of both WT mice and SIRT3 KO mice (Figure 5C, D). Mice with TAC showed decreased expression of CSE, which was restored by NaHS treatment, in both WT mice and SIRT3 KO mice. There was no significant difference in the expression of mRNA for CBS and MPST in the myocardium (Figure 5E–G). These data showed that there were no differences between SIRT3 deficient mice and WT mice, in BP and H2S levels.
Figure 5.
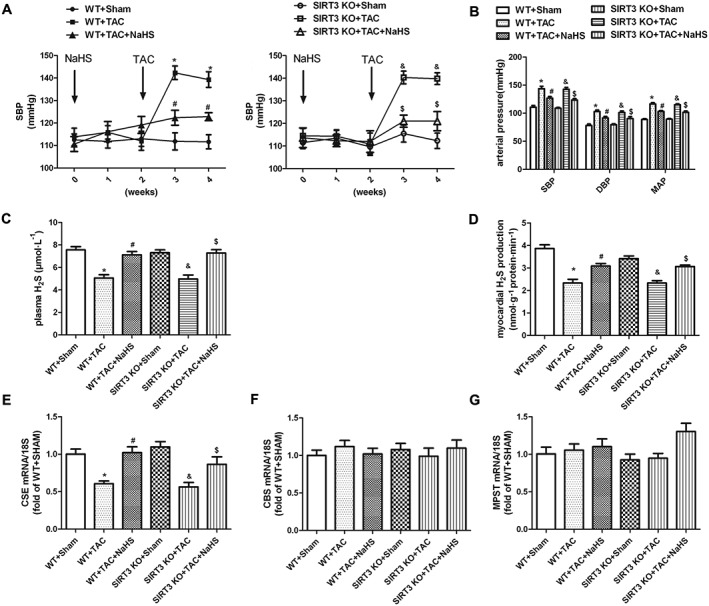
Effect of NaHS on BP and H2S level in WT and SIRT3 KO mice after TAC. Male 129S1/SvImJ (WT) and SIRT3 KO mice were injected with NaHS (50 μmol·kg−1·day−1; i.p) or saline for 2 weeks. Then, mice were subjected to TAC surgery. NaHS (50 μmol·kg−1·day−1) or saline was given for another 2 weeks. (A) SBP was measured once a week by the tail cuff method. (B) SBP, DBP and MAP were measured from the left carotid artery. (C, D) H2S concentration in plasma and H2S production in myocardium were measured with a H2S‐specific microelectrode. (E, G) Quantification of CSE, CBS and MPST mRNA expression in myocardium was carried out by real‐time PCR. * P < 0.05, significantly different from WT + SHAM; # P < 0.05, significantly different from WT + TAC; & P < 0.05, significantly different from SIRT3 KO + SHAM; $ P < 0.05, significantly different from SIRT3 KO + TAC. n = 6.
NaHS improved myocardial structure in WT mice but not in SIRT3 KO mice after TAC
To assess further the contribution of SRT3 to the effects of NaHS on myocardial hypertrophy, we compared the myocardial structure in WT mice and SIRT3 KO mice subjected to TAC. M‐mode echocardiography demonstrated that thickness of IVS and LVPW increased in both WT mice and SIRT3 KO mice after TAC, showing that our model of TAC did induce myocardial hypertrophy. The thickness of IVS and LVPW was attenuated significantly in WT mice, but not in SIRT3 KO mice, by NaHS treatment (Figure 6A, B). There was no significant difference in EF and FS between the two strains of mice (Figure 6C).
Figure 6.
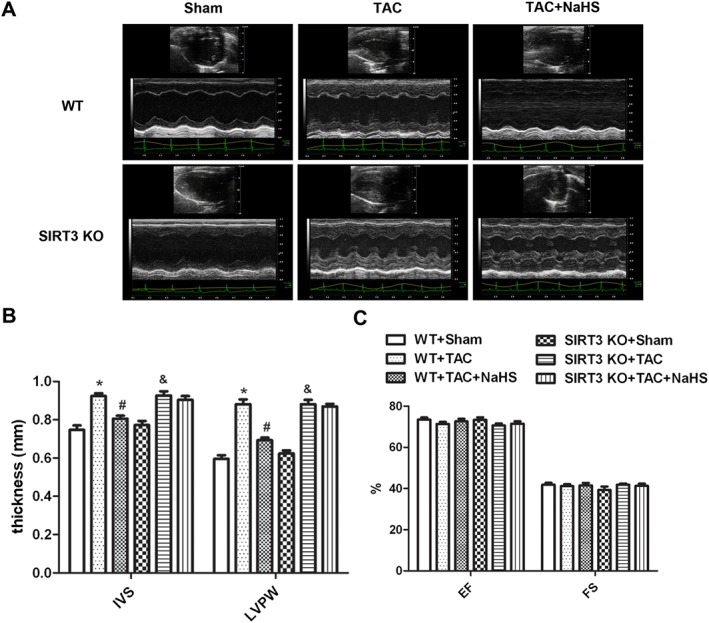
Effect of NaHS on myocardial structure in WT mice and SIRT3 KO mice after TAC. Male 129S1/SvImJ (WT) and SIRT3 KO mice were injected with NaHS (50 μmol·kg−1·day−1; i.p) or saline for 2 weeks. Then, mice were subjected to TAC surgery. NaHS (50 μmol·kg−1·day−1) or saline was given for another 2 weeks. (A) Representative 2‐D M‐mode echocardiograms of mice hearts are shown. (B) Quantitative analysis of IVS and LVPW thickness by echocardiography. (C) Quantitative analysis of EF and FS by echocardiography. * P < 0.05, significantly different from WT + SHAM; # P < 0.05, significantly different from WT + TAC; & P < 0.05, significantly different from SIRT3 KO + SHAM. n = 6.
NaHS attenuated myocardial hypertrophy in WT mice but not in SIRT3 KO mice after TAC
Compared with the sham group, TAC induced myocardial hypertrophy with larger heart and greater HW, HMI, LVMI and LVW/TL. Treatment with exogenous NaHS reduced all of these indices in WT mice but not in SIRT3 KO mice after TAC (Figure 7A–F). NaHS also failed to decrease ANP, BNP and β‐MHC mRNA expression in SIRT3 KO mice, which was reduced significantly by NaHS in WT mice (Figure 7G, H). Primary adult cardiomyocytes were isolated from mice subjected to TAC. The cells were photographed, and gene expression of ANP, BNP and β‐MHC was measured. We found that both NaHS and GYY4137 decreased cell surface areas and reduced hypertrophic gene expression oi primary adult cardiomyocytes isolated from WT mice, but not from SIRT3 KO mice, subjected to TAC (Supporting Information Figure S4A–D).
Figure 7.
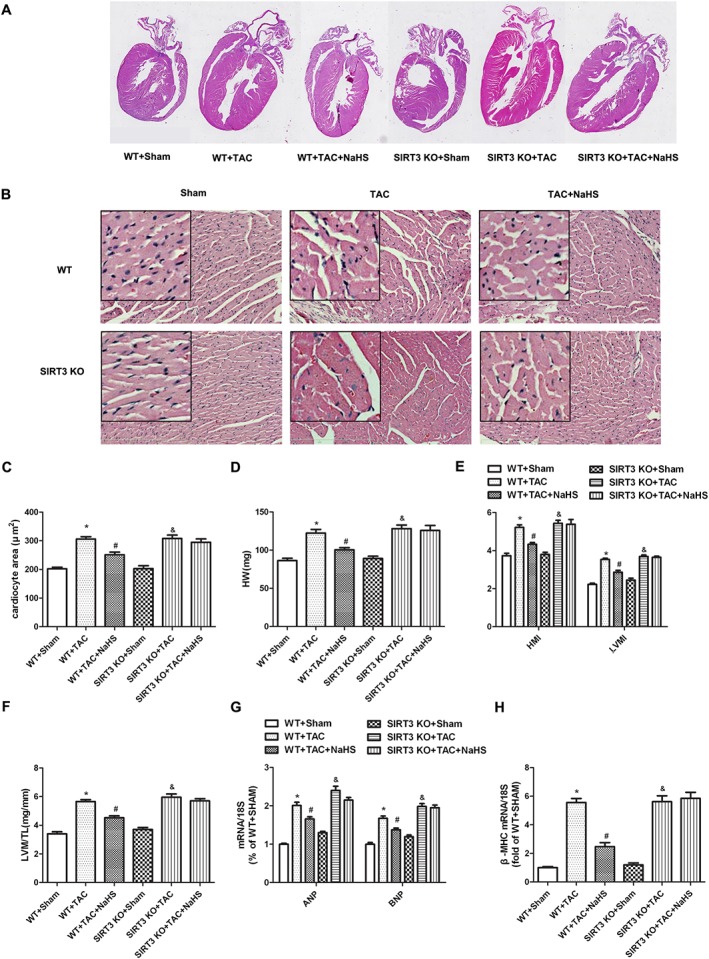
Effect of NaHS on myocardial hypertrophy in WT mice and SIRT3 KO mice after TAC. Male 129S1/SvImJ (WT) and SIRT3 KO mice were injected with NaHS (50 μmol·kg−1·day−1; i.p) or saline for 2 weeks. Then, mice were subjected to TAC surgery. NaHS (50 μmol·kg−1·day−1) or saline was given for another 2 weeks. (A) The whole heart of mice was stained with haematoxylin and eosin and was photographed. (B) Histological examination of myocardium was examined with microscope. Bar = 300 μm. (C) Cardiomyocyte area was calculated by morphometric analysis. (D–F) HW, HMI, LVMI and ratios of LVW to TL (LVW/TL) were measured and calculated. (G, H) Quantification of ANP, BNP and β‐MHC mRNA expression in myocardium was carried out by real‐time PCR. * P < 0.05, significantly different from WT + SHAM; # P < 0.05, significantly different from WT + TAC; & P < 0.05, significantly different from SIRT3 KO + SHAM. n = 6.
NaHS inhibited oxidative stress in myocardium of WT mice but not of SIRT3 KO mice after TAC
Oxidative stress derives from the mitochondria and plays an important role in the pathogenesis of myocardial hypertrophy (Maulik and Kumar, 2012; Walters et al., 2016). To determine whether the protective role of NaHS against TAC‐induced myocardial hypertrophy was related to SIRT3‐dependent ROS reduction, the oxidative level was measured in myocardium of WT mice and SIRT3 KO mice after TAC. Compared with Sham control, myocardial DHE fluorescence and levels of MDA were elevated after TAC, suggesting severe oxidative stress. After NaHS, both DHE fluorescence and MDA levels were reduced significantly in WT mice but not in SIRT3 KO mice (Figure 8A, B). NaHS also restored T‐AOC and total SOD activity (particularly Mn‐SOD but not Cu‐Zn/SOD) in the myocardium of WT mice but not of SIRT3 KO mice (Figure 8C, D).
Figure 8.
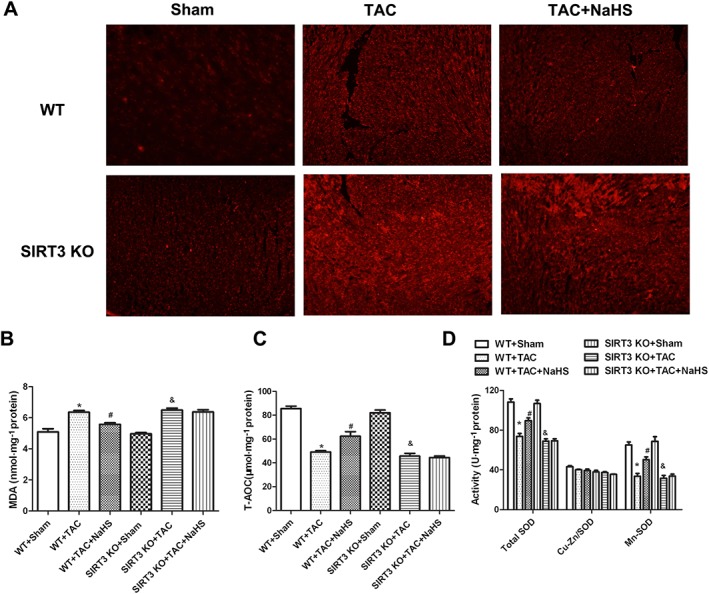
Effect of NaHS on oxidative stress in myocardium of WT mice and SIRT3 KO mice after TAC. Male 129S1/SvImJ (WT) and SIRT3 KO mice were injected with NaHS (50 μmol·kg−1·day−1; i.p) or saline for 2 weeks. Then, mice were subjected to TAC surgery. NaHS (50 μmol·kg−1·day−1) or saline was given for another 2 weeks. (A) Superoxide production in myocardium was detected under a fluorescence microscope with DHE fluorescent probe. (B–D) Level of MDA, T‐AOC, activity of SOD, Cu‐Zn/SOD and Mn‐SOD of myocardium were measured. * P < 0.05, significantly different from WT + SHAM; # P < 0.05, significantly different from WT + TAC; & P < 0.05, significantly different from SIRT3 KO + SHAM. n = 6.
NaHS restored mitochondrial ultrastructure and volume and number in myocardium of WT mice but not of SIRT3 KO mice after TAC
Transmission electron microscopy showed that the mitochondrial cristae of cardiomyocytes in mice after TAC became fewer, but fragmented and disordered. Some mitochondrial membranes was fused with vacuolar formation and sarcomere disorder after TAC. NaHS increased cristae numbers, restored cristae integrity and array and attenuated vacuolar formation and sarcomere disorder, representing an improvement of mitochondrial ultrastructure by NaHS in myocardium of WT mice but not of SIRT3 KO mice (Figure 9A). We also found that TAC induced mitochondria swelling with greater volume, which was alleviated by NaHS in WT but not in SIRT3 KO mice (Figure 9B). Mitochondrial number was evaluated with transmission electron microscopy observation and mtDNA copy number measurement. We found that NaHS increased mitochondrial number and mtDNA copy number after TAC in WT mice, effects that were absent from SIRT3 KO mice (Figure 9C, D).
Figure 9.
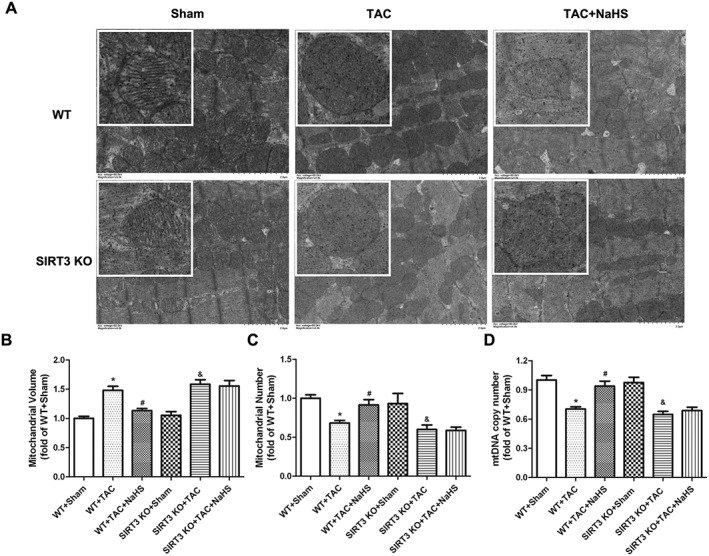
Effect of NaHS on mitochondrial ultrastructure, volumes and numbers in myocardium of WT mice and SIRT3 KO mice after TAC. Male 129S1/SvImJ (WT) and SIRT3 KO mice were injected with NaHS (50 μmol·kg−1·day−1; i.p) or saline for 2 weeks. Then, mice were subjected to TAC surgery. NaHS (50 μmol·kg−1·day−1) or saline was given for another 2 weeks. (A) Mitochondrial ultrastructure of myocardium was examined with transmission electron microscope. Bar = 2 μm. (B, C) Mitochondrial volume and number were evaluated with transmission electron microscopy observation. (D) mtDNA copy number was measured by real‐time PCR. * P < 0.05, significantly different from WT + SHAM; # P < 0.05, significantly different from WT + TAC; & P < 0.05, significantly different from SIRT3 KO + SHAM. n = 6.
Effect of NaHS on PGC‐1α, SIRT3, mitochondria fusion and fission‐related protein expressions in myocardium of WT mice and SIRT3 KO mice after TAC
SIRT3, a target of PGC‐1α, plays an important role in the suppression of ROS and mitochondrial biogenesis (Kong et al., 2010). Previous studies found that three mitochondrial fusion genes, OPA1, MFN1 and MFN2, significantly increased the efficiency of oxidative respiratory chain to protect tissue from injury (Hall et al., 2016; Le Page et al., 2016). DRP1 and FIS1 are two key proteins controlling mitochondrial fission (Hu et al., 2017; Marín‐García and Akhmedov, 2016). For further exploration of the detailed protective mechanism of NaHS against mitochondria function in myocardial hypertrophy, the effects of NaHS on PGC‐1α, SIRT3 and mitochondria‐related proteins in myocardium were assessed. Immunofluorescence staining confirmed that TAC decreased OPA1 expression but increased DRP1 expression, in myocardium. NaHS enhanced OPA1 expression but attenuated DRP1 formation in WT mice but not in SIRT3 KO mice after TAC (Figure 10A). NaHS enhanced PGC‐1α in both WT mice and SIRT3 KO mice after TAC (Figure 10B). There was a significant decrease of SIRT3 in myocardium after TAC, which was elevated by NaHS. There was no SIRT3 in the myocardium of SIRT3 KO mice (Figure 10C). Decreased MFN1 and MFN2 but enhanced FIS1 after TAC were reversed by NaHS in WT mice but not in SIRT3 KO mice (Figure 10D, E).
Figure 10.
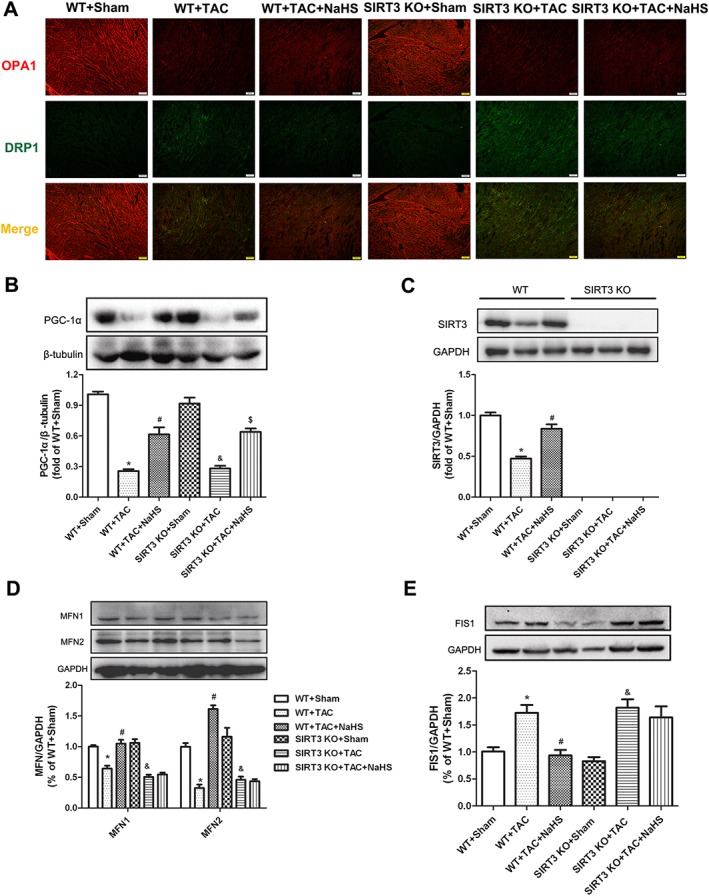
Effect of NaHS on PGC‐1α, SIRT3 and mitochondria‐related protein expression in myocardium of WT mice and SIRT3 KO mice after TAC. Male 129S1/SvImJ (WT) and SIRT3 KO mice were injected with NaHS (50 μmol·kg−1·day−1; i.p) or saline for 2 weeks. Then, mice were subjected to TAC surgery. NaHS (50 μmol·kg−1·day−1) or saline was given for another 2 weeks. (A) OPA1 and DRP1 in myocardium was immunofluorescence‐stained using Cy3 (Red) and Alexa Fluor 488 (Green)‐conjugated IgG respectively. Bar = 100 μm. (B–D) Quantification of PGC‐1α (B), SIRT3 (C), MFN1, MFN2 (D) and FIS1(E) protein expression in myocardium by Western blots. * P < 0.05, significantly different from WT + SHAM; # P < 0.05, significantly different from WT + TAC; & P < 0.05, significantly different from SIRT3 KO + SHAM; $ P < 0.05, significantly different from SIRT3 KO + TAC. n = 5.
Discussion
The SIR2 family plays an important role in the regulation of cellular stress response, metabolism, aging and apoptosis (Oppikofer et al., 2013; Pucci et al., 2013). We hypothesized that the SIR2 family might be responsible for the attenuation by H2S, of myocardial hypertrophy in mice. Real‐time PCR was applied to find that SIRT3, but not SIRT1 and other SIRT proteins, might be involved in its protective effect on cardiomyocyte hypertrophy. Our previous study found that H2S increased AP1 binding activity with the SIRT3 promoter, which was decreased after H2O2 treatment in endothelial cells. The enhanced effect of H2S on SIRT3 promoter activity was abolished by AP1 inhibitor, SR11302 or curcumin (Xie et al., 2016). The present study confirmed that NaHS increased SIRT3 promoter activity and enhanced SIRT3 mRNA expression, but the detailed mechanism remained to be studied.
There is evidence for the key role of SIRT3 in mitochondrial energy metabolism, raising the question of the pathological significance of SIRT3 in cardiovascular disease including myocardial hypertrophy (Lu et al., 2016; Yu et al., 2016; Koentges et al., 2016a, b). Previous studies found that there was no change on cardiac structure and function in young SIRT3 KO mice, before 8 weeks of age. However, SIRT3 KO mice displayed cardiac dysfunction, accompanied by myocardial hypertrophy in 13‐month‐old mice, suggesting that SIRT3 was relevant to the maintenance of cardiac contractility and structure (Hafner et al., 2009; Sundaresan et al., 2009). One recent study also found that, 4 weeks later, a greater degree of cardiac hypertrophy and fibrosis with decreased EF was induced by TAC (Koentges et al., 2015). We used a model of accelerated myocardial hypertrophy, TAC, in mice, in our study. Two weeks later, both WT mice and SIRT3 KO mice exhibited myocardial hypertrophy, manifested as greater IVS and LVPW thickness, greater heart mass and higher hypertrophic gene expression. However, there was no reduction in EF or FS on our model, because of a shorter time for TAC.
The severity and duration of hypertension are known to be positively correlated with myocardial hypertrophy. The effects of H2S on BP and cardiac hypertrophy are concentration‐dependent (Meng et al., 2015). It is worth noting that NaHS reduced BP and enhanced H2S level equally in WT mice and SIRT3 KO mice. We also confirmed that SIRT3 silencing in vitro or even SIRT3 deficiency in vivo had no effects on endogenous H2S signalling. We would suggest that the failure of NaHS to inhibit myocardial hypertrophy in SIRT3 KO mice is due to SIRT3 deficiency but not due to a direct effect on BP or on production of endogenous H2S.
Several studies have suggested that H2S exerts cardioprotective effects through its antioxidant properties. H2S can reduce the generation and accumulation of ROS in the myocardium after ischaemia/reperfusion. Na2S protected cultures of H9c2 cells from oxygen‐free radical‐induced cell death. More importantly, ROS activated a broad variety of hypertrophy signalling kinases and transcription factors, which play an important role in the occurrence and development of myocardial hypertrophy (Burgoyne et al., 2012; Maulik and Kumar, 2012). Inhibition of oxygen‐derived free radicals or increases in antioxidative proteins attenuates myocardial hypertrophy (Tham et al., 2015). Moreover, many studies have found that H2S to be a powerful antioxidant in protecting against myocardial hypertrophy (Liu et al., 2011; Lu et al., 2013; Shen et al., 2015; Zhou et al., 2015). Our study found that SIRT3 silencing in vitro or global SIRT3 deficiency in vivo abolished the protective effect of NaHS on cardiac hypertrophy. Associated with the finding that NaHS failed to inhibit ROS production if SIRT3 was deficient, the results suggested that SIRT3 might be an essential factor in the inhibition of oxidative stress and thus prevention of myocardial hypertrophy.
The detailed mechanism of SIRT3 for oxidative stress was then investigated. Using LC–MS/MS, Koentges et al. had found that 84 acetylated mitochondrial proteins increased in SIRT3 KO mice, including six enzymes of fatty acid import and oxidation, 50 subunits of the electron transport chain and three enzymes of the tricarboxylic acid cycle. Deficiency of SIRT3 weakened mitochondrial and contractile function in the heart (Koentges et al., 2015). Also, lack of SIRT3 facilitated the opening of the mitochondrial permeability transition pore by increasing acetylation and spatial dislocation of cyclophilin D (Hafner et al., 2009). Studies in failing hearts showed decreased expression of SIRT3 and evidence of myocardial NAD+ depletion and increased acetylation of mitochondrial enzymes, suggesting that SIRT3 is vital to maintain the stability of mitochondrial environment (Hsu et al., 2009; Pillai et al., 2010; Tanno et al., 2012; Lu et al., 2016; Osborne et al., 2016). Our study found that H2S up‐regulated SIRT3 to increase FOXO3a and SOD2 expression and to exhibit antioxidative ability to reduce oxidative stress and attenuate hypertrophy in Ang II‐stimulated cardiomyocytes. These changes could be possible downstream effects of SIRT3 in mediating the anti‐hypertrophic activity of H2S.
NaHS failed to restore mitochondrial function and mitochondrial permeability potential in Ang II‐stimulated cardiomyocytes. NaHS also did not improve mitochondrial ultrastructure in the myocardium of SIRT3 KO mice. However, NaHS did improve the quantity, structure and arrangement of mitochondrial cristae; increased mitochondrial number; and reduced mitochondrial swelling, which is vital to ameliorate mitochondrial function, regulate energy metabolism and reduce oxidative stress. Notably, the preventive effects of NaHS disappeared completely when SIRT3 silenced or deleted, indicating that SIRT3 was crucial in the alleviation of mitochondrial dysfunction by H2S in TAC‐induced myocardial hypertrophy.
We had already found that H2S increased AP1 binding activity with the SIRT3 promoter in hydrogen peroxide‐stimulated endothelial cells (Xie et al., 2016). Our present study found that NaHS enhanced PGC‐1α, which might be involved in the mechanism for SIRT3 up‐regulation. PGC‐1α interacts with oestrogen‐related receptor α, which bound to the SIRT3 promoter as its transcription factor to regulate SIRT3 expression (Zhang et al., 2016). Two GTPase isoforms, MFN1/2, as well as OPA1, are the main proteins required for fusion of mitochondria. MFN1 or MFN2 deficiency greatly reduced levels of mitochondrial fusion, induced the imbalance of fusion and even promoted mitochondrial fragmentation. OPA1 regulates mitochondrial shape, respiration regulation efficiency, respiratory chain components and the protein complexes in the form of energy (Cogliati et al., 2013). Mitochondrial fission was regulated by interaction of two proteins: a cytosolic GTPase, DRP1, and an outer mitochondrial membrane‐anchored protein, FIS1. DRP1 affected mitochondrial morphology and was important in mitochondrial and peroxisomal fission in mammalian cells, which served as a therapeutic target in cardiovascular diseases (Sharp, 2015; Atkins et al., 2016). FIS1 has been proposed to act as a receptor for DRP1, to promote mitochondrial fission (Palmer et al., 2013). NaHS failed to restore balance of the above fusion‐ and fission‐related protein in SIRT3 KO mice after TAC. Altogether, the improved mitochondrial function might be ascribed to SIRT3 but not to PGC‐1α.
Our present study suggested that the CSE/H2S pathway was impaired during hypertrophy. Exogenous NaHS restored expression of CSE mRNA and H2S levels, which might be the joint effect of direct exogenous supplementation and indirect endogenous sulfide production. NaHS is known to be a rapid‐releasing H2S donor and diffuses rapidly, within 30–45 min, which makes it difficult to ascertain the precise dosage of H2S. Although not all of the circulating sulfide actually enters the cell and NaHS does not elevate the H2S concentration to a very high level in vivo, the released H2S spreads throughout the body, which is likely to cause non‐specific, systemic effects. This might be the most serious challenge to the successful translation of research on H2S to clinical use. More novel H2S donors targeting specific cells or organs, with better metabolic kinetic characteristics, are urgently needed to enhance the efficacy and to reduce the adverse effects of H2S.
In conclusion, our present results have highlighted a novel role for SIRT3 in the protective effect of H2S against oxidative stress in myocardial hypertrophy both in vitro and in vivo. These results have shed new light on the molecular mechanism(s) responsible for the cardioprotective effect of H2S through SIRT3 activation in myocardial hypertrophy.
Author contributions
G.M. conducted the animal experiments, acquired and analysed the data and drafted the article. Y.J. designed the experiments and revised the article. J.L. and S.L. carried out the biochemical measurements. Q.S, L.L., L.X. and Y.H. conducted the cellular experiments.
Conflict of interest
The authors declare no conflicts of interest.
Declaration of transparency and scientific rigour
This Declaration acknowledges that this paper adheres to the principles for transparent reporting and scientific rigour of preclinical research recommended by funding agencies, publishers and other organisations engaged with supporting research.
Supporting information
Figure S1 Effect of GYY4137 on Ang II induced cardiomyocyte hypertrophy. After SIRT3 siRNA or NC siRNA was transfected into neonatal rat cardiomyocytes for 24 h, cells were pre‐treated with GYY4137 (50 μM) for 4 h followed by Ang II (100 nM) for 24 h. (A) Cells were digested with 0.1% trypsin and photographed using an inverted microscope. Cell surface area of cardiomyocytes was calculated using Imagepro‐Plus system and normalized to cells not undergoing any drug treatment (with NC siRNA transfection). (B‐D) Quantification of atrial natriuretic peptide (ANP), brain natriuretic peptide (BNP) and β‐myosin heavy chain (β‐MHC) mRNA expression in cardiomyocytes was carried out by real‐time PCR. * P < 0.05 versus cells not undergoing any drug treatment (with NC siRNA transfection); # P < 0.05 verse cells treated with Ang II alone (with NC siRNA transfection); & P < 0.05 versus cells not undergoing any drug treatment (with SIRT3 siRNA transfection). n = 6.
Figure S2 Effect of NaHS on H2S level in Ang II stimulated cardiomyocytes after SIRT3 was knocked down. After SIRT3 siRNA or NC siRNA was transfected into neonatal rat cardiomyocytes for 24 h, cells were pre‐treated with NaHS (50 μM) for 4 h followed by Ang II (100 nM) for 24 h. (A) H2S concentration in the culture medium was measured with a H2S‐specific microelectrode. (B‐D) Quantification of cystathionine γ‐lyase (CSE), cystathionine β‐synthase (CBS) and 3‐mercaptypyruvate sulfertransferase (MPST) mRNA expression in cardiomyocytes was carried out by real‐time PCR. * P < 0.05 versus cells not undergoing any drug treatment (with NC siRNA transfection); # P < 0.05 verse cells treated with Ang II alone (with NC siRNA transfection); & P < 0.05 versus cells not undergoing any drug treatment (with SIRT3 siRNA transfection); $ P < 0.05 versus cells treated with Ang II alone (with SIRT3 siRNA transfection). n = 6.
Figure S3 Effect of GYY4137 on SIRT3, FOXO3a, SOD2 expression and oxidative stress in Ang II stimulated cardiomyocytes. (A‐C) After SIRT3 siRNA or NC siRNA was transfected into neonatal rat cardiomyocytes for 24 h, cells were pre‐treated with GYY4137 (50 μM) for 4 h followed by Ang II (100 nM) for 24 h. SIRT3, FOXO3a and SOD2 protein expression was measured with western blot. * P < 0.05 versus cells not undergoing any drug treatment (with NC siRNA transfection); # P < 0.05 verse cells treated with Ang II alone (with NC siRNA transfection); & P < 0.05 versus cells not undergoing any drug treatment (with SIRT3 siRNA transfection). n = 5. (D) Superoxide production in cardiomyocytes was detected under a fluorescence microscope with dihydroethidium (DHE) fluorescent probe. Bar = 50 μm.
Figure S4 Effect of NaHS or GYY4137 on primary adult cardiomyocytes isolated from WT and SIRT3 KO mice after TAC. Male 129S1/SvImJ (WT) and SIRT3 KO mice were intraperitoneally injected with NaHS (50 μmol/kg/d) or GYY4137 (133 μmol/kg/d) or saline for 2 weeks. Then, mice were subjected with transverse aortic constriction (TAC) surgery. NaHS (50 μmol/kg/d) or GYY4137 (133 μmol/kg/d) or saline was administrated for another 2 weeks. (A) Primary adult cardiomyocytes were isolated from mice and photographed. Bar = 200 μm. (B‐D) Quantification of ANP, BNP and β‐MHC mRNA expression in primary adult cardiomyocytes was carried out by real‐time PCR. * P < 0.05 versus WT + SHAM; # P < 0.05 versus WT + TAC; & P < 0.05 versus SIRT3 KO + SHAM. n = 6.
Acknowledgements
This work was supported by grants from the National Natural Science Foundation of China (grant nos 81330004, 81400203, 91639204 and 31371156), the Natural Science Foundation of Nantong City from Nantong Science and Technology Bureau (grant no. MS12015015) and the Collaborative Innovation Center for Cardiovascular Disease Translational Medicine from Jiangsu Province.
Meng, G. , Liu, J. , Liu, S. , Song, Q. , Liu, L. , Xie, L. , Han, Y. , and Ji, Y. (2018) Hydrogen sulfide pretreatment improves mitochondrial function in myocardial hypertrophy via a SIRT3‐dependent manner. British Journal of Pharmacology, 175: 1126–1145. doi: 10.1111/bph.13861.
References
- Alexander SPH, Fabbro D, Kelly E, Marrion N, Peters JA, Benson HE et al. (2015) The Concise Guide to PHARMACOLOGY 2015/16: Enzymes. Br J Pharmacol 172: 6024–6109. [DOI] [PMC free article] [PubMed] [Google Scholar]
- Ansari A, Rahman MS, Saha SK, Saikot FK, Deep A, Kim KH (2017). Function of the SIRT3 mitochondrial deacetylase in cellular physiology, cancer, and neurodegenerative disease. Aging Cell 16: 4–16. [DOI] [PMC free article] [PubMed] [Google Scholar]
- Atkins K, Dasgupta A, Chen KH, Mewburn J, Archer SL (2016). The role of Drp1 adaptor proteins MiD49 and MiD51 in mitochondrial fission: implications for human disease. Clin Sci (Lond) 130: 1861–1874. [DOI] [PubMed] [Google Scholar]
- Burgoyne JR, Mongue‐Din H, Eaton P, Shah AM (2012). Redox signaling in cardiac physiology and pathology. Circ Res 111: 1091–1106. [DOI] [PubMed] [Google Scholar]
- Cacanyiova S, Berenyiova A, Kristek F (2016). The role of hydrogen sulphide in blood pressure regulation. Physiol Res 65 (Suppl 3): S273–S289. [DOI] [PubMed] [Google Scholar]
- Chakraborty C, Doss CG (2013). Sirtuins family‐recent development as a drug target for aging, metabolism, and age related diseases. Curr Drug Targets 14: 666–675. [DOI] [PubMed] [Google Scholar]
- Chen CJ, Fu YC, Yu W, Wang W (2013). SIRT3 protects cardiomyocytes from oxidative stress‐mediated cell death by activating NF‐κB. Biochem Biophys Res Commun 430: 798–803. [DOI] [PubMed] [Google Scholar]
- Chen H, Chomyn A, Chan DC (2005). Disruption of fusion results in mitochondrial heterogeneity and dysfunction. J Biol Chem 280: 26185–26192. [DOI] [PubMed] [Google Scholar]
- Cheung KG, Cole LK, Xiang B, Chen K, Ma X, Myal Y et al. (2015). Sirtuin‐3 (SIRT3) protein attenuates doxorubicin‐induced oxidative stress and improves mitochondrial respiration in H9c2 cardiomyocytes. J Biol Chem 290: 10981–10993. [DOI] [PMC free article] [PubMed] [Google Scholar]
- Cogliati S, Frezza C, Soriano ME, Varanita T, Quintana‐Cabrera R, Corrado M et al. (2013). Mitochondrial cristae shape determines respiratory chain supercomplexes assembly and respiratory efficiency. Cell 155: 160–171. [DOI] [PMC free article] [PubMed] [Google Scholar]
- Curtis MJ, Bond RA, Spina D, Ahluwalia A, Alexander SP, Giembycz MA et al. (2015). Experimental design and analysis and their reporting: new guidance for publication in BJP. Br J Pharmacol 172: 3461–3471. [DOI] [PMC free article] [PubMed] [Google Scholar]
- Feliers D, Lee HJ, Kasinath BS (2016). Hydrogen sulfide in renal physiology and disease. Antioxid Redox Signal 25: 720–731. [DOI] [PMC free article] [PubMed] [Google Scholar]
- van Goor H, van den Born JC, Hillebrands JL, Joles JA (2016). Hydrogen sulfide in hypertension. Curr Opin Nephrol Hypertens 25: 107–113. [DOI] [PubMed] [Google Scholar]
- Hafner AV, Dai J, Gomes AP, Xiao CY, Palmeira CM, Rosenzweig A et al. (2009). Regulation of the mPTP by SIRT3‐mediated deacetylation of CypD at lysine 166 suppresses age‐related cardiac hypertrophy. Aging (Albany NY) 2: 914–923. [DOI] [PMC free article] [PubMed] [Google Scholar]
- Hall AR, Burke N, Dongworth RK, Kalkhoran SB, Dyson A, Vicencio JM et al. (2016). Hearts deficient in both Mfn1 and Mfn2 are protected against acute myocardial infarction. Cell Death Dis 7: e2238. [DOI] [PMC free article] [PubMed] [Google Scholar]
- He X, Zeng H, Chen JX (2016). Ablation of SIRT3 causes coronary microvascular dysfunction and impairs cardiac recovery post myocardial ischemia. Int J Cardiol 215: 349–357. [DOI] [PMC free article] [PubMed] [Google Scholar]
- Hsu CP, Oka S, Shao D, Hariharan N, Sadoshima J (2009). Nicotinamide phosphoribosyltransferase regulates cell survival through NAD+ synthesis in cardiac myocytes. Circ Res 105: 481–491. [DOI] [PMC free article] [PubMed] [Google Scholar]
- Hu C, Huang Y, Li L (2017). Drp1‐dependent mitochondrial fission plays critical roles in physiological and pathological progresses in mammals. Int J Mol Sci 18 pii: E144. [DOI] [PMC free article] [PubMed] [Google Scholar]
- Huang J, Wang D, Zheng J, Huang X, Jin H (2012). Hydrogen sulfide attenuates cardiac hypertrophy and fibrosis induced by abdominal aortic coarctation in rats. Mol Med Rep 5: 923–928. [DOI] [PMC free article] [PubMed] [Google Scholar]
- Kilkenny C, Browne W, Cuthill IC, Emerson M, Altman DG (2010). Animal research: reporting in vivo experiments: the ARRIVE guidelines. Br J Pharmacol 160: 1577–1579. [DOI] [PMC free article] [PubMed] [Google Scholar]
- Koentges C, Bode C, Bugger H (2016a). SIRT3 in cardiac physiology and disease. Front Cardiovasc Med 3: 38. [DOI] [PMC free article] [PubMed] [Google Scholar]
- Koentges C, Pfeil K, Meyer‐Steenbuck M, Lother A, Hoffmann MM, Odening KE et al. (2016b). Preserved recovery of cardiac function following ischemia–reperfusion in mice lacking SIRT3. Can J Physiol Pharmacol 94: 72–80. [DOI] [PubMed] [Google Scholar]
- Koentges C, Pfeil K, Schnick T, Wiese S, Dahlbock R, Cimolai MC et al. (2015). SIRT3 deficiency impairs mitochondrial and contractile function in the heart. Basic Res Cardiol 110: 36. [DOI] [PubMed] [Google Scholar]
- Kong X, Wang R, Xue Y, Liu X, Zhang H, Chen Y et al. (2010). Sirtuin 3, a new target of PGC‐1alpha, plays an important role in the suppression of ROS and mitochondrial biogenesis. PLoS One 5: e11707. [DOI] [PMC free article] [PubMed] [Google Scholar]
- Lai YC, Tabima DM, Dube JJ, Hughan KS, Vanderpool RR, Goncharov DA et al. (2016). SIRT3–AMP‐activated protein kinase activation by nitrite and metformin improves hyperglycemia and normalizes pulmonary hypertension associated with heart Failure with preserved ejection fraction. Circulation 133: 717–731. [DOI] [PMC free article] [PubMed] [Google Scholar]
- Lazzeroni D, Rimoldi O, Camici PG (2016). From left ventricular hypertrophy to dysfunction and failure. Circ J 80: 555–564. [DOI] [PubMed] [Google Scholar]
- Le Page S, Niro M, Fauconnier J, Cellier L, Tamareille S, Gharib A et al. (2016). Increase in cardiac ischemia–reperfusion injuries in Opa1+/− mouse model. PLoS One 11: e0164066. [DOI] [PMC free article] [PubMed] [Google Scholar]
- Li S, Yang G (2015). Hydrogen sulfide maintains mitochondrial DNA replication via demethylation of TFAM. Antioxid Redox Signal 23: 630–642. [DOI] [PMC free article] [PubMed] [Google Scholar]
- Liang M, Jin S, Wu DD, Wang MJ, Zhu YC (2015). Hydrogen sulfide improves glucose metabolism and prevents hypertrophy in cardiomyocytes. Nitric Oxide 46: 114–122. [DOI] [PubMed] [Google Scholar]
- Liu J, Hao DD, Zhang JS, Zhu YC (2011). Hydrogen sulphide inhibits cardiomyocyte hypertrophy by up‐regulating miR‐133a. Biochem Biophys Res Commun 413: 342–347. [DOI] [PubMed] [Google Scholar]
- Liu Z, Han Y, Li L, Lu H, Meng G, Li X et al. (2013). The hydrogen sulfide donor, GYY4137, exhibits anti‐atherosclerotic activity in high fat fed apolipoprotein E(−/−) mice. Br J Pharmacol 169: 1795–1809. [DOI] [PMC free article] [PubMed] [Google Scholar]
- Lu F, Xing J, Zhang X, Dong S, Zhao Y, Wang L et al. (2013). Exogenous hydrogen sulfide prevents cardiomyocyte apoptosis from cardiac hypertrophy induced by isoproterenol. Mol Cell Biochem 381: 41–50. [DOI] [PubMed] [Google Scholar]
- Lu Y, Wang YD, Wang XY, Chen H, Cai ZJ, Xiang MX (2016). SIRT3 in cardiovascular diseases: Emerging roles and therapeutic implications. Int J Cardiol 220: 700–705. [DOI] [PubMed] [Google Scholar]
- Marín‐García J, Akhmedov AT (2016). Mitochondrial dynamics and cell death in heart failure. Heart Fail Rev 21: 123–136. [DOI] [PubMed] [Google Scholar]
- Matsushima S, Sadoshima J (2015). The role of sirtuins in cardiac disease. Am J Physiol Heart Circ Physiol 309: H1375–H1389. [DOI] [PMC free article] [PubMed] [Google Scholar]
- Maulik SK, Kumar S (2012). Oxidative stress and cardiac hypertrophy: a review. Toxicol Mech Methods 22: 359–366. [DOI] [PubMed] [Google Scholar]
- McDonnell E, Peterson BS, Bomze HM, Hirschey MD (2015). SIRT3 regulates progression and development of diseases of aging. Trends Endocrinol Metab 26: 486–492. [DOI] [PMC free article] [PubMed] [Google Scholar]
- McGrath JC, Lilley E (2015). Implementing guidelines on reporting research using animals (ARRIVE etc.): new requirements for publication in BJP. Br J Pharmacol 172: 3189–3193. [DOI] [PMC free article] [PubMed] [Google Scholar]
- Meng G, Ma Y, Xie L, Ferro A, Ji Y (2015). Emerging role of hydrogen sulfide in hypertension and related cardiovascular diseases. Br J Pharmacol 172: 5501–5511. [DOI] [PMC free article] [PubMed] [Google Scholar]
- Meng G, Xiao Y, Ma Y, Tang X, Xie L, Liu J et al. (2016). Hydrogen sulfide regulates Krüppel‐like factor 5 transcription activity via specificity protein 1 S‐sulfhydration at Cys664 to prevent myocardial hypertrophy. J Am Heart Assoc 5 pii: e004160. [DOI] [PMC free article] [PubMed] [Google Scholar]
- Nadruz W (2015). Myocardial remodeling in hypertension. J Hum Hypertens 29: 1–6. [DOI] [PubMed] [Google Scholar]
- Oppikofer M, Kueng S, Gasser SM (2013). SIR–nucleosome interactions: structure–function relationships in yeast silent chromatin. Gene 527: 10–25. [DOI] [PubMed] [Google Scholar]
- Osborne B, Bentley NL, Montgomery MK, Turner N (2016). The role of mitochondrial sirtuins in health and disease. Free Radic Biol Med 100: 164–174. [DOI] [PubMed] [Google Scholar]
- Palmer CS, Elgass KD, Parton RG, Osellame LD, Stojanovski D, Ryan MT (2013). Adaptor proteins MiD49 and MiD51 can act independently of Mff and Fis1 in Drp1 recruitment and are specific for mitochondrial fission. J Biol Chem 288: 27584–27593. [DOI] [PMC free article] [PubMed] [Google Scholar]
- Pillai VB, Bindu S, Sharp W, Fang YH, Kim G, Gupta M et al. (2016). Sirt3 protects mitochondrial DNA damage and blocks the development of doxorubicin‐induced cardiomyopathy in mice. Am J Physiol Heart Circ Physiol 310: H962–H972. [DOI] [PMC free article] [PubMed] [Google Scholar]
- Pillai VB, Sundaresan NR, Kim G, Gupta M, Rajamohan SB, Pillai JB et al. (2010). Exogenous NAD blocks cardiac hypertrophic response via activation of the SIRT3‐LKB1‐AMP‐activated kinase pathway. J Biol Chem 285: 3133–3144. [DOI] [PMC free article] [PubMed] [Google Scholar]
- Poulose N, Raju R (2015). Sirtuin regulation in aging and injury. Biochim Biophys Acta 1852: 2442–2455. [DOI] [PMC free article] [PubMed] [Google Scholar]
- Pucci B, Villanova L, Sansone L, Pellegrini L, Tafani M, Carpi A et al. (2013). Sirtuins: the molecular basis of beneficial effects of physical activity. Intern Emerg Med 8 (Suppl 1): S23–S25. [DOI] [PubMed] [Google Scholar]
- Rodrigues PG, Leite‐Moreira AF, Falcão‐Pires I (2016). Myocardial reverse remodeling: how far can we rewind? Am J Physiol Heart Circ Physiol 310: H1402–HH422. [DOI] [PubMed] [Google Scholar]
- Sharp WW (2015). Dynamin‐related protein 1 as a therapeutic target in cardiac arrest. J Mol Med (Berl) 93: 243–252. [DOI] [PMC free article] [PubMed] [Google Scholar]
- Shen Y, Shen Z, Luo S, Guo W, Zhu YZ (2015). The cardioprotective effects of hydrogen sulfide in heart diseases: from molecular mechanisms to therapeutic potential. Oxid Med Cell Longev 2015: 925167. [DOI] [PMC free article] [PubMed] [Google Scholar]
- Shi YX, Chen Y, Zhu YZ, Huang GY, Moore PK, Huang SH et al. (2007). Chronic sodium hydrosulfide treatment decreases medial thickening of intramyocardial coronary arterioles, interstitial fibrosis, and ROS production in spontaneously hypertensive rats. Am J Physiol Heart Circ Physiol 293: H2093–H2100. [DOI] [PubMed] [Google Scholar]
- Shimizu I, Minamino T (2016). Physiological and pathological cardiac hypertrophy. J Mol Cell Cardiol 97: 245–262. [DOI] [PubMed] [Google Scholar]
- Southan C, Sharman JL, Benson HE, Faccenda E, Pawson AJ, Alexander SPH et al. (2016). The IUPHAR/BPS guide to PHARMACOLOGY in 2016: towards curated quantitative interactions between 1300 protein targets and 6000 ligands. Nucleic Acids Res 44: D1054–D1068. [DOI] [PMC free article] [PubMed] [Google Scholar]
- Sundaresan NR, Gupta M, Kim G, Rajamohan SB, Isbatan A, Gupta MP (2009). Sirt3 blocks the cardiac hypertrophic response by augmenting Foxo3a‐dependent antioxidant defense mechanisms in mice. J Clin Inves 119: 2758–2771. [DOI] [PMC free article] [PubMed] [Google Scholar]
- Szabo C (2017). Hydrogen sulfide, an enhancer of vascular nitric oxide signaling: mechanisms and implications. Am J Physiol Cell Physiol 312: C3–C15. [DOI] [PMC free article] [PubMed] [Google Scholar]
- Tanno M, Kuno A, Horio Y, Miura T (2012). Emerging beneficial roles of sirtuins in heart failure. Basic Res Cardiol 107: 273. [DOI] [PMC free article] [PubMed] [Google Scholar]
- Tham YK, Bernardo BC, Ooi JY, Weeks KL, McMullen JR (2015). Pathophysiology of cardiac hypertrophy and heart failure: signaling pathways and novel therapeutic targets. Arch Toxicol 89: 1401–1438. [DOI] [PubMed] [Google Scholar]
- Walters JW, Amos D, Ray K, Santanam N (2016). Mitochondrial redox status as a target for cardiovascular disease. Curr Opin Pharmacol 27: 50–55. [DOI] [PMC free article] [PubMed] [Google Scholar]
- Wu D, Si W, Wang M, Lv S, Ji A, Li Y (2015). Hydrogen sulfide in cancer: friend or foe? Nitric Oxide 50: 38–45. [DOI] [PubMed] [Google Scholar]
- Xie L, Feng H, Li S, Meng G, Liu S, Tang X et al. (2016). SIRT3 mediates the antioxidant effect of hydrogen sulfide in endothelial cells. Antioxid Redox Signal 24: 329–343. [DOI] [PMC free article] [PubMed] [Google Scholar]
- Yang F, Liu Z, Wang Y, Li Z, Yu H, Wang Q (2014). Hydrogen sulfide endothelin‐induced myocardial hypertrophy in rats and the mechanism involved. Cell Biochem Biophys 70: 1683–1686. [DOI] [PubMed] [Google Scholar]
- Yao Y, Yang Y, Zhu WG (2014). Sirtuins: nodes connecting aging, metabolism and tumorigenesis. Curr Pharm Des 20: 1614–1624. [DOI] [PubMed] [Google Scholar]
- Yu W, Gao B, Li N, Wang J, Qiu C, Zhang G et al. (2016). Sirt3 deficiency exacerbates diabetic cardiac dysfunction: role of Foxo3A‐Parkin‐mediated mitophagy. Biochim Biophys Acta pii: S0925‐4439(16)30274‐5. [DOI] [PubMed] [Google Scholar]
- Yue Z, Ma Y, You J, Li Z, Ding Y, He P et al. (2016). NMNAT3 is involved in the protective effect of SIRT3 in Ang II‐induced cardiac hypertrophy. Exp Cell Res 347: 261–273. [DOI] [PubMed] [Google Scholar]
- Zhang X, Ren X, Zhang Q, Li Z, Ma S, Bao J et al. (2016). PGC‐1α/ERRα‐Sirt3 pathway regulates DAergic neuronal death by directly deacetylating SOD2 and ATP synthase β. Antioxid Redox Signal 24: 312–328. [DOI] [PMC free article] [PubMed] [Google Scholar]
- Zhou X, Zhao L, Mao J, Huang J, Chen J (2015). Antioxidant effects of hydrogen sulfide on left ventricular remodeling in smoking rats are mediated via PI3K/Akt‐dependent activation of Nrf2. Toxicol Sci 144: 197–203. [DOI] [PubMed] [Google Scholar]
Associated Data
This section collects any data citations, data availability statements, or supplementary materials included in this article.
Supplementary Materials
Figure S1 Effect of GYY4137 on Ang II induced cardiomyocyte hypertrophy. After SIRT3 siRNA or NC siRNA was transfected into neonatal rat cardiomyocytes for 24 h, cells were pre‐treated with GYY4137 (50 μM) for 4 h followed by Ang II (100 nM) for 24 h. (A) Cells were digested with 0.1% trypsin and photographed using an inverted microscope. Cell surface area of cardiomyocytes was calculated using Imagepro‐Plus system and normalized to cells not undergoing any drug treatment (with NC siRNA transfection). (B‐D) Quantification of atrial natriuretic peptide (ANP), brain natriuretic peptide (BNP) and β‐myosin heavy chain (β‐MHC) mRNA expression in cardiomyocytes was carried out by real‐time PCR. * P < 0.05 versus cells not undergoing any drug treatment (with NC siRNA transfection); # P < 0.05 verse cells treated with Ang II alone (with NC siRNA transfection); & P < 0.05 versus cells not undergoing any drug treatment (with SIRT3 siRNA transfection). n = 6.
Figure S2 Effect of NaHS on H2S level in Ang II stimulated cardiomyocytes after SIRT3 was knocked down. After SIRT3 siRNA or NC siRNA was transfected into neonatal rat cardiomyocytes for 24 h, cells were pre‐treated with NaHS (50 μM) for 4 h followed by Ang II (100 nM) for 24 h. (A) H2S concentration in the culture medium was measured with a H2S‐specific microelectrode. (B‐D) Quantification of cystathionine γ‐lyase (CSE), cystathionine β‐synthase (CBS) and 3‐mercaptypyruvate sulfertransferase (MPST) mRNA expression in cardiomyocytes was carried out by real‐time PCR. * P < 0.05 versus cells not undergoing any drug treatment (with NC siRNA transfection); # P < 0.05 verse cells treated with Ang II alone (with NC siRNA transfection); & P < 0.05 versus cells not undergoing any drug treatment (with SIRT3 siRNA transfection); $ P < 0.05 versus cells treated with Ang II alone (with SIRT3 siRNA transfection). n = 6.
Figure S3 Effect of GYY4137 on SIRT3, FOXO3a, SOD2 expression and oxidative stress in Ang II stimulated cardiomyocytes. (A‐C) After SIRT3 siRNA or NC siRNA was transfected into neonatal rat cardiomyocytes for 24 h, cells were pre‐treated with GYY4137 (50 μM) for 4 h followed by Ang II (100 nM) for 24 h. SIRT3, FOXO3a and SOD2 protein expression was measured with western blot. * P < 0.05 versus cells not undergoing any drug treatment (with NC siRNA transfection); # P < 0.05 verse cells treated with Ang II alone (with NC siRNA transfection); & P < 0.05 versus cells not undergoing any drug treatment (with SIRT3 siRNA transfection). n = 5. (D) Superoxide production in cardiomyocytes was detected under a fluorescence microscope with dihydroethidium (DHE) fluorescent probe. Bar = 50 μm.
Figure S4 Effect of NaHS or GYY4137 on primary adult cardiomyocytes isolated from WT and SIRT3 KO mice after TAC. Male 129S1/SvImJ (WT) and SIRT3 KO mice were intraperitoneally injected with NaHS (50 μmol/kg/d) or GYY4137 (133 μmol/kg/d) or saline for 2 weeks. Then, mice were subjected with transverse aortic constriction (TAC) surgery. NaHS (50 μmol/kg/d) or GYY4137 (133 μmol/kg/d) or saline was administrated for another 2 weeks. (A) Primary adult cardiomyocytes were isolated from mice and photographed. Bar = 200 μm. (B‐D) Quantification of ANP, BNP and β‐MHC mRNA expression in primary adult cardiomyocytes was carried out by real‐time PCR. * P < 0.05 versus WT + SHAM; # P < 0.05 versus WT + TAC; & P < 0.05 versus SIRT3 KO + SHAM. n = 6.