

Abstract
Objective
To evaluate whether participation in Medicare's Acute Care Episode (ACE) Demonstration Program—an early, small, voluntary episode‐based payment program—was associated with a change in expenditures or quality of care.
Data Sources/Study Setting
Medicare claims for patients who underwent cardiac or orthopedic surgery from 2007 to 2012 at ACE or control hospitals.
Study Design
We used a difference‐in‐differences approach, matching on baseline and pre‐enrollment volume, risk‐adjusted Medicare payments, and clinical outcomes to identify controls.
Principal Findings
Participation in the ACE Demonstration was not significantly associated with 30‐day Medicare payments (for orthopedic surgery: −$358 with 95 percent CI: −$894, +$178; for cardiac surgery: +$514 with 95 percent CI: −$1,517, +$2,545), or 30‐day mortality (for orthopedic surgery: −0.10 with 95 percent CI: −0.50, 0.31; for cardiac surgery: −0.27 with 95 percent CI: −1.25, 0.72). Program participation was associated with a decrease in total 30‐day post‐acute care payments (for cardiac surgery: −$718; 95 percent CI: −$1,431, −$6; and for orthopedic surgery: −$591; 95 percent CI: $‐$1,161, −$22).
Conclusions
Participation in Medicare's ACE Demonstration Program was not associated with a change in 30‐day episode‐based Medicare payments or 30‐day mortality for cardiac or orthopedic surgery, but it was associated with lower total 30‐day post‐acute care payments.
Keywords: Program evaluation, surgery, health policy/politics/law/regulation
The Centers for Medicare & Medicaid Services (CMS) have set ambitious goals to replace fee‐for‐service payments with alternative payment models (Burwell 2015). One such model is bundled payments, where a fixed payment is provided for a longitudinal episode of care that may span several different care settings and include multiple providers. Bundling payments around an “episode” of care may incentivize providers to better coordinate care, improve quality, and decrease costs. CMS currently has at least four active or proposed bundled payment programs: the Bundled Payments for Care Improvement (BPCI) initiative for up to 48 medical and surgical conditions; the Comprehensive Care for Joint Replacement (CJR) Model for hip and knee replacement; the Oncology Care Model; and the recently proposed cardiac and orthopedic bundled payment models (Centers for Medicare & Medicaid Services, 2015b,c; Tsai et al. 2015; Centers for Medicare & Medicaid Services 2016).
Despite enthusiasm for bundled payment, there is limited evidence supporting its effectiveness in reducing costs or improving quality outcomes (Hussey et al. 2012; Shih, Chen, and Nallamothu 2015). Hospitals participating in the ACE Demonstration—an early, small, voluntary episode‐based payment program—accepted discounted bundled payments from Medicare for cardiovascular and orthopedic inpatient care from 2009 to 2012. We used a difference‐in‐differences approach to evaluate the impact of the ACE Demonstration Program on Medicare expenditures and clinical outcomes for cardiac and orthopedic surgery.
Methods
ACE Demonstration Overview
The ACE Demonstration was a 3‐year initiative to test the impact of bundled payments for 28 cardiovascular and nine orthopedic inpatient services (Centers for Medicare & Medicaid Services 2015a). It built on CMS’s earlier experiments with bundled payments: the Cataract Surgery Alternate Payment Demonstration and the Medicare Participating Heart Bypass Demonstration. In the ACE Demonstration, participating organizations received discounted payments for Part A and Part B services provided during an inpatient stay (see Table S1) and shared in any savings if they met requirements for quality reporting and monitoring (Calsyn and Emanuel 2014). Participating organizations could elect to incentivize physicians through gainsharing. Medicare agreed to share savings with participating beneficiaries, up to the amount of the annual Part B premium (Centers for Medicare & Medicaid Services 2015a).
The Centers for Medicare & Medicaid Services invited physician hospital organizations that met minimum volume thresholds (e.g., 100 bypass surgeries or 90 hip and knee replacements in 2007) and were located in Texas, Oklahoma, Colorado, and New Mexico, to apply for the ACE Demonstration in May 2008. CMS selected participants based on a number of factors, including ongoing quality improvement efforts, strength of organizational infrastructure, and the proposed discount, which did not include disproportionate share hospital (DSH) or indirect medical education (IME) payments. Participants were announced in January 2009, and CMS launched the program in April 2009. The start date for participants was staggered from April 2009 through November 2010 (Centers for Medicare & Medicaid Services 2015a).
Data Source and Study Population
We used data from the MedPAR (Medicare Analysis Provider and Review) and Master Beneficiary Summary files from 2007 to 2012 to identify clinical cohorts, identify patient risk factors, and calculate study outcomes. We used the American Hospital Association Annual Survey to identify hospital characteristics.
We included patients who underwent any of the cardiac or orthopedic surgical procedures included in the ACE Demonstration (i.e., cardiac bypass [CABG], cardiac valve surgery, or hip or knee replacement or revision) (Table S2). We excluded patients who were under 65 years of age or older than 99 years and patients who were not enrolled in both Medicare Part A and Part B in the 6 months prior to the index admission and the 3 months after discharge. To increase clinical homogeneity, we also excluded patients who were nursing home residents prior to surgery. For patients who had multiple admissions for the same procedure in a given year, we chose the first admission in that year.
This study was approved by the University of Michigan Institutional Review Board.
Medicare Expenditures
Our primary spending outcome was total, 30‐day episode payments, which we defined as Medicare spending from admission up until 30 days after discharge for any of several components of care: (1) index hospitalization (DRG payments plus outlier payments); (2) rehospitalization (DRG payments plus outlier payments); (3) physician services at any time during the episode; and (4) post‐acute care payments (home health, skilled nursing facility, inpatient rehabilitation facility, and outpatient). Our other spending outcomes were hospital payments and physician payments occurring during the index hospitalization. We chose these spending outcomes, because the ACE Demonstration bundled Part A and Part B payments during the index hospitalization only. We price‐standardized Medicare payments to account for regional differences in prices, using a method that has been previously described (Gottlieb et al. 2010), and adjusted for inflation such that the results are presented in 2012 dollars (Bureau of Labor Statistics 2016). We examined payments prior to the discount that ACE Demonstration hospitals granted to CMS.
Outcome Measures
Our main quality outcomes were mortality within 30 days of the index surgical procedure, serious complications, and 30‐day readmissions. We used previously validated algorithms to identify eight common postoperative complications (i.e., pulmonary failure, pneumonia, myocardial infarction, deep venous thrombosis and pulmonary embolism, acute renal failure, postoperative hemorrhage, surgical site infection, and gastrointestinal hemorrhage) with claims data (Table S3) (Iezzoni et al. 1994; Weingart et al. 2000). Similar to prior work, we defined serious complications as any complication accompanied by a length of stay greater than the 75th percentile for the procedure (Osborne et al. 2015). We defined 30‐day readmissions as any admission to an acute care hospital that occurred within 30 days of discharge, excluding transfers. The 30‐day time frame has been adopted as the standard time frame in quality improvement efforts around readmissions (Tsai et al. 2013).
Statistical Analyses
We used difference‐in‐differences analyses to compare the change in episode payments and clinical outcomes before versus after enrollment in the ACE Demonstration, compared with control hospitals. To select controls that resembled ACE hospitals as closely as possible, we used stratified exact matching (as described in the Methods Appendix and Table S4) to identify control hospitals as participating hospitals. We used multivariate models to adjust for potential confounders not included in the exact matching.
We compared the patient and hospital characteristics of ACE versus control hospitals, before and after stratified exact matching to check the balance (Table 1a,b). For each payment and clinical outcome, we also confirmed similar pre‐enrollment trends in ACE and control hospitals (Dimick and Ryan 2014).
Table 1.
Characteristics of Hospitals Participating in the ACE Demonstration Compared with Nonparticipating (Control) Hospitals before and after Propensity Score Matching
| Hospital Characteristics | ACE | Non‐ACE | p‐value | |
|---|---|---|---|---|
| Before Matching | After Matching | |||
| (a) | ||||
| Cardiac surgery | ||||
| No. of hospitals | 4 | 1,116 | 9 | |
| No. of patients | 5,017 | 671,767 | 9,617 | |
| Annual cardiac surgery volume in enrollment year, median (IQR) | 260 (169–478) | 184 (110–307) | 236 (212–292) | .46 |
| Profit status, % | ||||
| For‐profit | 77 | 10 | 12 | .02 |
| Nonprofit | 23 | 82 | 88 | |
| Other | 0 | 8 | 0 | |
| Number of beds, % | ||||
| <250 | 39 | 16 | 9 | .96 |
| 250–499 | 23 | 42 | 48 | |
| ≥500 | 37 | 42 | 44 | |
| Geographic region, % | ||||
| Northeast | 0 | 21 | 0 | .33 |
| West | 25 | 16 | 33 | |
| Midwest | 0 | 25 | 14 | |
| South | 75 | 38 | 53 | |
| Other characteristics, median (IQR) | ||||
| Non‐teaching, % | 100 | 66 | 71 | .16 |
| Technology hospital, % | 100 | 99 | 100 | |
| Urban, % | 100 | 94 | 100 | |
| Nurse ratio | 8 (5–10) | 7 (6–9) | 8 (6–9) | .63 |
| Medicaid, % | 11 | 17 | 15 | .33 |
| Total admissions | 9,982 (8,990–63,438) | 21,668 (14,575–31,600) | 17,347 (13,705–47,442) | .76 |
| FTEs | 1,416 (734–4,344) | 2,452 (1,575–4,254) | 1,824 (1,498–5,196) | .99 |
| Operations/y | 11,495 (7,108–29,316) | 15,124 (9,505–23,384) | 13,390 (11,351–28,591) | .93 |
| Operating rooms | 24 (5–52) | 21 (14–33) | 26 (22–49) | .96 |
| (b) | ||||
| Orthopedic surgery | ||||
| No. of hospitals | 5 | 2,959 | 22 | |
| No. of patients | 10,462 | 2,643,304 | 42,312 | |
| Orthopedic surgery volume in enrollment year, median (IQR) | 1,152 (249–1,152) | 335 (183–585) | 459 (382–643) | .97 |
| Profit status, % | ||||
| For‐profit | 98 | 10 | 10 | <.001 |
| Nonprofit | 2 | 80 | 90 | |
| Other | 0 | 9 | 0 | |
| Number of beds, % | ||||
| <250 | 17 | 40 | 29 | .05 |
| 250–499 | 2 | 37 | 45 | |
| ≥500 | 81 | 23 | 26 | |
| Geographic region, % | ||||
| Northeast | 0 | 18 | 16 | .10 |
| West | 17 | 18 | 19 | |
| Midwest | 0 | 28 | 44 | |
| South | 83 | 36 | 21 | |
| Other characteristics, median (IQR) | ||||
| Nonteaching, % | 100 | 82 | 84 | .16 |
| Technology hospital, % | 95 | 78 | 90 | .08 |
| Urban, % | 100 | 92 | 88 | .16 |
| Nurse ratio | 5 (5–6) | 7 (6–9) | 7 (6–9) | .83 |
| Medicaid, % | 21 | 16 | 11 | .27 |
| Total admissions | 63,438 (10,232–63,992) | 14,637 (8,101–23,325) | 18,474 (9,912–24,358) | .63 |
| FTEs | 4,852 (924–5,479) | 1,611 (883–2,739) | 1,938 (1,227–3,096) | .96 |
| Operations/y | 29,316 (10,170–30,531) | 10,414 (6,364–17,389) | 11,213 (7,554–17,166) | .87 |
| Operating rooms | 52 (19–60) | 14 (9–24) | 18 (14–23) | .61 |
ACE, acute care episode; FTE, full‐time equivalent employees; Operations/y, total annual surgical operations.
We next performed the difference‐in‐differences analyses. We used multivariate generalized linear models with log link to estimate episode payments before and after participation. ACE hospitals had exactly 2 years in the pre‐intervention time period, and the postintervention time period. For our three dichotomous clinical outcomes, we used multivariate logistic regression models. We adjusted our models for patient risk factors, including age (continuous), gender, race (black vs. white), and 29 Elixhauser comorbidities (Elixhauser et al. 1998). We also adjusted our models for hospital characteristics that we hypothesized were most likely to be associated with outcomes (i.e., number of beds: <250, 250–499, ≥500; profit status: for‐profit, nonprofit; teaching status; and geographic region: Midwest, Northeast, South, and West), when not able to perform an exact match on these characteristics. To account for secular trends over time in payments and clinical outcomes, we also adjusted for year of the procedure. All of our models included an interaction term (ACE × After ACE implementation], with the coefficient for this interaction term being the difference‐in‐differences estimator. In our primary analyses, we accounted for clustering at the hospital level with robust standard errors. We performed two additional sensitivity analyses: first accounting for clustering at the propensity score strata level and then not accounting for any clustering.
p‐values <.05 were considered to be statistically significant. All analyses were conducted in Stata version 12.0 (Stata Corp., College Station, TX, USA).
Results
During the study period, a total of 5,017 patients underwent cardiac surgery at the four hospitals that enrolled in the ACE Demonstration for these procedures (Table S1). These participating hospitals were matched with nine control hospitals that cared for 9,617 cardiac surgery patients. For orthopedic surgery, a total of 10,462 patients underwent hip or knee replacement or revision at the five hospitals that enrolled in the ACE Demonstration for orthopedics. These participating hospitals were matched with 22 control hospitals that cared for 42,312 patients who underwent one of these procedures during the study period.
Compared with controls, hospitals participating in the ACE Demonstration for cardiac procedures were more likely to be smaller (39 percent vs. 9 percent with <250 beds), for‐profit (77 percent vs. 12 percent), and non‐teaching hospitals (100 percent vs. 71 percent), but except for profit status, these differences were not statistically significant (p‐values >.05). Similarly, ACE hospitals had fewer full‐time‐equivalent (FTE) employees (1,416 vs. 1,824), and fewer operations per year (11,495 vs. 13,390), but these differences also were not statistically significant (Table 1). Results were similar for orthopedic surgery, except that orthopedic ACE hospitals were more likely to be larger (81 percent vs. 26 percent with 500+ beds), have more FTE employees, and perform more operations (29,316 vs. 11,213) compared with non‐ACE hospitals. However, these differences were not statistically significant.
The characteristics of patients at ACE hospitals also differed from the characteristics of patients seen at control hospitals (Tables S5, S6, and S7). Compared with controls, hospitals participating in the ACE Demonstration for cardiac procedures had slightly younger patients (74.1 vs. 74.5 years; p‐value <.01), and a higher proportion of white patients (90 percent vs. 89 percent; p‐value <.01). Compared with controls, hospitals participating in the ACE Demonstration for orthopedic procedures had a lower proportion of white patients (88 percent vs. 95 percent; p‐value <.01) and were more likely to care for patients with at least two comorbidities (72 percent vs. 61 percent; p‐value <.01). For both cardiac and orthopedic procedures, the proportion of patients with individual comorbidities at ACE and control hospitals did not differ in clinically meaningful ways.
There were parallel pre‐intervention trends in cost and quality outcomes at ACE hospitals and matched controls (Figure 1). For example, total 30‐day episode payments for cardiac surgery decreased from $45,558 to $43,820 at ACE hospitals during the pre‐intervention period, and from $47,057 to $45,524 at control hospitals during this same time period (p‐value = .21). There were also parallel trends for other cost and quality outcomes. Similarly, total 30‐day episode payments for orthopedic surgery showed minimal change at ACE hospitals during the pre‐intervention period ($22,111 to $21,707), and little change at control hospitals during this same time period ($22,251 to $21,940) (p‐value = .32). Trends at ACE hospitals also mirrored trends at control hospitals for other cost and quality outcomes.
Figure 1.
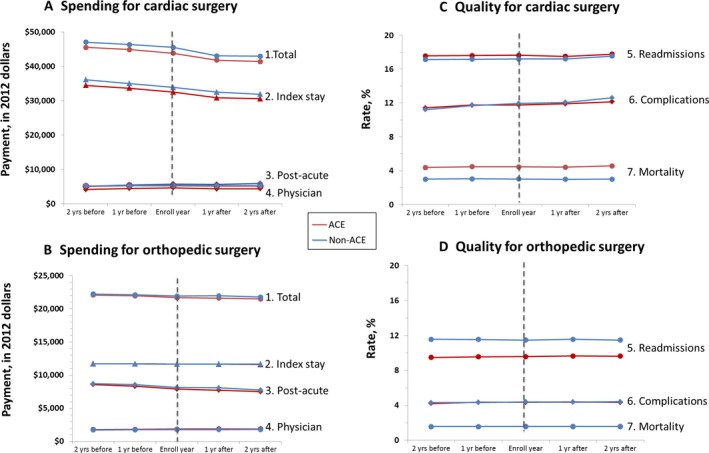
Cost and Quality before versus after Participating in the ACE Demonstration Compared with Matched Non‐ACE Control Hospitals [Color figure can be viewed at wileyonlinelibrary.com]
In difference‐in‐differences analyses, there were no statistically significant changes in total, price‐standardized, 30‐day episode payments for cardiac surgery at ACE Demonstration hospitals compared with controls, in the postintervention versus pre‐intervention periods ($514; 95 percent CI: −$1,517 to $2,545) (Table 2). Similarly, program participation was not associated with any change in payments for the index hospitalization ($862; 95 percent CI: −$396 to $2,120) or inpatient physician care after cardiac surgery ($20; 95 percent CI: −$423 to $463). Results were similar for payment outcomes for orthopedic surgery. However, program participation was associated with a decrease in total post‐acute care payments (for cardiac surgery: −$718; 95 percent CI: −$1,431, −$6; and for orthopedic surgery: −$591; 95 percent CI: $‐$1,161, −$22).
Table 2.
Thirty‐Day Total and Component Episode Payment Outcomes before versus after Participating in the ACE Demonstration Compared with Matched Non‐ACE (Control) Hospitals
| Cost Outcome, by Procedure | Marginal Predicted Payments, $s | Difference in Average Medicare Payments after vs. before the ACE Demonstration, Compared with Controls (95% CI), $s | |
|---|---|---|---|
| Pre‐enrollment | Postenrollment | ||
| (a) | |||
| Cardiac surgery | |||
| Home health (N = 5,095) | |||
| ACE | 1,584 | 1,637 | 16 (−196, 229) |
| Non‐ACE | 1,780 | 1,816 | |
| Skilled nursing facility (N = 2,020) | |||
| ACE | 8,422 | 10,166 | 1,013 (−154, 2,180) |
| Non‐ACE | 7,063 | 7,817 | |
| Inpatient rehabilitation (N = 144) | |||
| ACE | 22,262 | 29,129 | 5,234 (−3,868, 14,336) |
| Non‐ACE | 13,662 | 14,615 | |
| Other PAC (N = 5,755) | |||
| ACE | 2,103 | 1,481 | −684 (−1,733, 364) |
| Non‐ACE | 4,031 | 4,182 | |
| Total PAC (N = 8,128) | |||
| ACE | 4,772 | 4,363 | −718 (−1,431, −6) |
| Non‐ACE | 5,429 | 5,772 | |
| Index admission (N = 10,667) | |||
| ACE | 31,144 | 31,556 | 862 (−396, 2,120) |
| Non‐ACE | 34,666 | 34,231 | |
| Physician (N = 10,860) | |||
| ACE | 4,339 | 4,489 | 20 (−423, 463) |
| Non‐ACE | 5,987 | 6,187 | |
| Total episode (N = 9,735) | |||
| ACE | 40,673 | 40,315 | 514 (−1,517, 2,545) |
| Non‐ACE | 47,186 | 46,192 | |
| (b) | |||
| Orthopedic surgery | |||
| Home health (N = 10,375) | |||
| ACE | 2,703 | 2,840 | 6 (−288, 300) |
| Non‐ACE | 2,804 | 2,938 | |
| Skilled nursing facility (N = 7,377) | |||
| ACE | 7,804 | 8,189 | −204 (−737, 330) |
| Non‐ACE | 9,490 | 10,077 | |
| Inpatient rehabilitation (N = 652) | |||
| ACE | 14,495 | 15,527 | −410 (−1,656, 837) |
| Non‐ACE | 12,771 | 14,371 | |
| Other PAC (N = 8,147) | |||
| ACE | 3,555 | 4,367 | −154 (−1,298, 991) |
| Non‐ACE | 4,416 | 5,404 | |
| Total PAC (N = 17,641) | |||
| ACE | 8,595 | 7,904 | −591 (−1,161, −22) |
| Non‐ACE | 8,069 | 7,987 | |
| Index admission (N = 23,706) | |||
| ACE | 11,445 | 11,864 | −1 (−88, 86) |
| Non‐ACE | 11,490 | 11,908 | |
| Physician (N = 18,213) | |||
| ACE | 2,068 | 2,104 | 8 (−80, 96) |
| Non‐ACE | 2,210 | 2,237 | |
| Total episode (N = 19,680) | |||
| ACE | 22,501 | 22,413 | −358 (−894, 178) |
| Non‐ACE | 21,705 | 21,899 | |
ACE, acute care episode; CI, confidence interval; PAC, post‐acute care.
With regard to clinical outcomes, participation in the ACE Demonstration was not associated with any statistically significant changes in 30‐day mortality after cardiac surgery (−0.27; 95 percent CI: −1.25 to 0.72) (Table 3). Program participation also was not associated with any statistically significant changes in readmissions (0.21; 95 percent CI: −1.67 to 2.09) or serious complications after cardiac surgery (0.81; 95 percent CI: −1.80 to 3.42). Results were similar for orthopedic surgery, except ACE hospitals had a statistically significant decrease in readmission rates compared with controls (−2.22; 95 percent CI: −3.25 to −1.19).
Table 3.
Thirty‐Day Total and Component Quality Outcomes before versus after Participating in the ACE Demonstration Compared with Matched Non‐ACE (Control) Hospitals
| Quality Outcome, by Procedure | Marginal Predicted Rate of Outcomes | Difference in Rates of Adverse Outcomes after vs. before the ACE Demonstration, Compared with Control Hospitals (95% CI) | |
|---|---|---|---|
| Pre‐enrollment | Postenrollment | ||
| Cardiac surgery | |||
| Serious complications (N = 14,634) | |||
| ACE | 9.29 | 12.55 | 0.81 (−1.8, 3.42) |
| Non‐ACE | 10.76 | 14.28 | |
| Readmissions (N = 23,423) | |||
| ACE | 15.29 | 16.42 | 0.21 (−1.67, 2.09) |
| Non‐ACE | 16.7 | 17.53 | |
| Mortality (N = 26,675) | |||
| ACE | 1.77 | 2.03 | −0.27 (−1.25, 0.72) |
| Non‐ACE | 4.37 | 4.65 | |
| Orthopedic surgery | |||
| Serious complications (N = 52,774) | |||
| ACE | 3.85 | 2.65 | −1.14 (−2.33, 0.04) |
| Non‐ACE | 4.37 | 3.81 | |
| Readmissions (N = 43,046) | |||
| ACE | 9.94 | 7.96 | −2.22 (−3.25, −1.19) |
| Non‐ACE | 11.48 | 11.61 | |
| Mortality (N = 37,645) | |||
| ACE | 1.66 | 1.37 | −0.1 (−0.5, 0.31) |
| Non‐ACE | 1.72 | 1.48 | |
ACE, acute care episode; CI, confidence interval.
Discussion
We found that participation in the ACE Demonstration Program for cardiac and orthopedic surgery was not associated with a reduction in total 30‐day episode payments, hospital payments, or physician payments during the index hospitalization. However, it was associated with a reduction in total 30‐day, post‐acute care payments. Participation in the ACE Demonstration was not associated with a consistent improvement in clinical outcomes.
Our study adds to existing literature on bundled payments by evaluating the ACE Demonstration using intervention and control hospitals that have parallel pre‐intervention trends, one of the major assumptions of the difference‐in‐differences approach for policy evaluation (Dimick and Ryan 2014). A prior evaluation of the ACE did not explicitly confirm parallel pre‐intervention trends for ACE and non‐ACE hospitals for all analyses (IMPAQ International and The Hilltop Institute 2013). With our approach, we found no association between participation in the ACE Demonstration and total 30‐day episode spending or most clinical outcomes. However, program participation was associated with lower total 30‐day, post‐acute care spending.
Our findings should be interpreted in the context of earlier evidence in support of “bundling” health care payments. The Inpatient Prospective Payment System (IPPS) bundled payments for hospital care excluding physician services, reimbursing hospitals a fixed payment per admission based on a patient's diagnosis. The IPPS dramatically reduced length of stay but did not adversely affect mortality or readmission rates (Lave 1989; Kahn et al. 1990; Chulis 1991; Feinglass and Holloway 1991). Research also suggests that the Medicare Heart Bypass Demonstration—which bundled inpatient hospital and physician payments and readmissions for seven hospitals—reduced Medicare spending primarily through discounted payments but also through decreases in postdischarge care (Cromwell et al. 1998).
There may be several reasons why the ACE Demonstration did not succeed in reducing total 30‐day episode payments. It is possible that incentives were not large enough for providers to fully engage in the initiative. Hospitals negotiated their own discounts with Medicare, but not all hospitals engaged in gainsharing with physicians (IMPAQ International and The Hilltop Institute 2013). Recent attempts at bundled payments also make clear that there are substantial barriers to implementation, such as lack of advanced information technology as well as lack of established mechanisms to distribute physician payments (Hussey, Ridgely, and Rosenthal 2011; Ridgely et al. 2014). Our findings, in conjunction with the fact that payments to physicians make up a small proportion of total episode payments for surgery (Birkmeyer et al. 2010; Miller et al. 2011), should temper enthusiasm for an inpatient‐only bundle. However, they leave open the possibility that more inclusive bundles may have a larger impact on utilization and quality of care. Early evidence suggests that a broad bundle for lower extremity joint replacement can lower total episode spending (Dummit et al. 2016).
Even though the ACE Demonstration only bundled inpatient payments, we found that total 30‐day post‐acute care payments were lower for ACE versus non‐ACE hospitals. This was surprising. It could be that ACE hospitals were more involved in non‐ACE initiatives that bundled payments over a longer time period. CMS’ criteria for selecting participating organizations included the presence of strong organizational infrastructure and experience with quality improvement activities (Centers for Medicare & Medicaid Services 2015a). It may also be that efforts to increase inpatient efficiencies for the ACE Demonstration fostered a culture of “value” that affected discharge decisions (e.g., fewer discharges to post‐acute care facilities when those services were believed to be unnecessary). We did not have the qualitative data to explore these hypotheses.
Our study had several potential limitations. First, our primary goal was to assess how participation in the ACE Demonstration affected both utilization within an episode of care and quality of care. Therefore, we cannot make any conclusions about the ACE Demonstration's impact on either hospitals’ costs of care or actual payments disbursed by Medicare. Second, because we performed a quasi‐experimental study of a voluntary program, our results may be biased by selection. Although we matched hospitals on outcomes at baseline, pre‐intervention year 1, and pre‐intervention year 2, differences still remained after matching, most notably with profit status. We also compared each hospital both to itself in a pre‐/post‐comparison and to controls. Third, as the number of hospitals participating in the ACE Demonstration was very small (four for cardiac surgery and five for orthopedic surgery), we did not have the power to detect small differences in utilization or clinical outcomes. Finally, we did not have complete information about participation in other value‐based purchasing programs, which may have provided additional incentives for lower episode payments. In the few areas where the ACE Demonstration was associated with lower utilization (i.e., total post‐acute care payments and readmissions), we cannot rule out the possibility that the effects may in part have been due to participation in non‐ACE value‐based purchasing programs.
In spite of these limitations, it is worth considering the implications of our results for the current expansion of episode‐based payment models (Centers for Medicare & Medicaid Services, 2015b; Kline et al. 2015). First, our results suggest that the limited scope of some of the BPCI models may limit their effectiveness (e.g., Model 1, which bundles Part A and Part B payments during the inpatient stay, like the ACE Demonstration; Model 3, which bundles post‐acute care alone; and Model 4, which bundles the index admission and any readmissions) (Centers for Medicare & Medicaid Services 2014). Second, the magnitude of the incentives in the evolving CJR and Oncology Care Models may need to be larger than those extended to ACE hospitals in order to have a larger impact on utilization and quality.
Bundled payment is alternative to fee‐for‐service that is increasingly being considered by payers. Nonetheless, we cannot assume that it will improve value. To be effective, bundled payment must ultimately incentivize lower utilization. Our results suggest that the ACE Demonstration—evaluate small, voluntary, early bundled payment program—was associated with lower total 30‐day post‐acute care utilization. It would be important to assess whether broader bundles with more participants—such as those that have been implemented or proposed by CMS—have similar or larger effects for a broad range of conditions. Medicare may initially save money through bundled payment programs that incorporate discounted episode payments to providers (e.g., BPCI), but discounted episode payments amount to the same thing as rate cuts. Research must strive to understand the designs of bundled payment programs that can improve value over the long term by lowering utilization without compromising quality.
Supporting information
Appendix SA1: Author Matrix.
Appendix SA2:
Methods Appendix. Additional Detail about Methods, Including Matching.
Table S1. Participating Acute Care Episode (ACE) Demonstration Hospitals.
Table S2. MS‐DRGs and ICD‐9 Procedure Codes Used to Define Cohorts.
Table S3. ICD‐9 Procedure Codes Used to Define Complications.
Table S4. Model Specifications.
Table S5. Patient Characteristics at Hospitals Participating in the ACE Demonstration Compared with Nonparticipating (Control) Hospitals before and after Exact Matching.
Table S6. Patient Co‐Morbidities at Hospitals Participating in the ACE Demonstration for Cardiac Surgery Compared with Nonparticipating (Control) Hospitals.
Table S7. Patient Co‐Morbidities at Hospitals Participating in the ACE Demonstration for Orthopedic Surgery Compared with Nonparticipating (Control) Hospitals.
Acknowledgments
Joint Acknowledgment/Disclosure Statement: This work was supported by the National Institute on Aging (Grant No. R01AG039434). Prior to completion of the study Andrew Ryan was supported by K01HS18546 from AHRQ, Terry Shih was supported by 5T32HL07612309 from the National Institutes of Health, and Lena Chen was supported by K08HS020671 from the Agency for Healthcare Research and Quality (AHRQ). Prior to the completion of the study, Lena Chen was also supported by R01HS024698 from AHRQ, 5P01AG019783 from the NIH/NIA, and 2059.11 from the Blue Cross Blue Shield of Michigan Foundation Investigator Initiated Research Program.
Justin Dimick, MD, MPH has equity interest in ArborMetrix, a company that profiles hospital quality and episode cost efficiency. The company played no role in this work.
Lena Chen currently receives support from the Department of Health and Human Services Office of the Assistant Secretary for Planning and Evaluation for her work there. That support played no role in this work.
No other disclosures, except as specified on attachment.
Disclosures: None.
Disclaimer: None.
References
- Birkmeyer, J. D. , Gust C., Baser O., Dimick J. B., Sutherland J. M., and Skinner J. S.. 2010. “Medicare Payments for Common Inpatient Procedures: Implications for Episode‐Based Payment Bundling.” Health Services Research 45 (6 Pt 1): 1783–95. [DOI] [PMC free article] [PubMed] [Google Scholar]
- Bureau of Labor Statistics . 2016. “Consumer Price Index” [accessed on July 29, 2016]. Available at http://www.bls.gov/cpi/
- Burwell, S. M. 2015. “Setting Value‐Based Payment Goals–HHS Efforts to Improve U.S. Health Care.” New England Journal of Medicine 372 (10): 897–9. [DOI] [PubMed] [Google Scholar]
- Calsyn, M. , and Emanuel E. J.. 2014. “Controlling Costs by Expanding the Medicare Acute Care Episode Demonstration.” JAMA Internal Medicine 174 (9): 1438–9. [DOI] [PubMed] [Google Scholar]
- Centers for Medicare & Medicaid Services . 2014. “Bundled Payments for Care Improvement Initiative Fact Sheet.”
- Centers for Medicare & Medicaid Services . 2015a. “Medicare Acute Care Episode (ACE) Demonstration” [accessed on July 29, 2015a]. Available at https://innovation.cms.gov/initiatives/ACE/
- Centers for Medicare & Medicaid Services . 2015b. “Medicare Program; Comprehensive Care for Joint Replacement Payment Model for Acute Care Hospitals Furnishing Lower Extremity Joint Replacement Services.” Department of Health and Human Services. Federal Register. [PubMed] [Google Scholar]
- Centers for Medicare & Medicaid Services . 2015c. “Oncology Care Model.”
- Centers for Medicare & Medicaid Services . 2016. “Notice of Proposed Rulemaking for Bundled Payment Models for High‐Quality, Coordinated Cardiac and hip Fracture Care” [accessed on July 29, 2016]. Available at https://www.cms.gov/Newsroom/MediaReleaseDatabase/Fact-sheets/2016-Fact-sheets-items/2016-07-25.html
- Centers for Medicare & Medicaid Services . “Bundled Payments for Care Improvement (BPCI) Initiative: General Information.”
- Chulis, G. S. 1991. “Assessing Medicare's Prospective Payment System for Hospitals.” Medical Care Review 48 (2): 167–206. [DOI] [PubMed] [Google Scholar]
- Cromwell, J. , Dayhoff D. A., McCall N. T., Subramanian S., Freitas R. C., Hart R. J., Caswell C., and Stason W.. 1998. “Medicare Participating Heart Bypass Center Demonstration” [accessed on February 17, 2017]. Available at https://downloads.cms.gov/files/cmmi/medicare-demonstration/Medicare_Heart_Bypass_Volume1.pdf
- Dimick, J. B. , and Ryan A. M.. 2014. “Methods for Evaluating Changes in Health Care Policy: The Difference‐in‐Differences Approach.” Journal of the American Medical Association 312 (22): 2401–2. [DOI] [PubMed] [Google Scholar]
- Dummit, L. A. , Kahvecioglu D., Marrufo G., Rajkumar R., Marshall J., Tan E., Press M. J., Flood S., Muldoon L. D., Gu Q., Hassol A., Bott D. M., Bassano A., and Conway P. H.. 2016. “Association between Hospital Participation in a Medicare Bundled Payment Initiative and Payments and Quality Outcomes for Lower Extremity Joint Replacement Episodes.” Journal of the American Medical Association 316 (12): 1267–78. [DOI] [PubMed] [Google Scholar]
- Elixhauser, A. , Steiner C., Harris D. R., and Coffey R. M.. 1998. “Comorbidity Measures for use With Administrative Data.” Medical Care 36 (1): 8–27. [DOI] [PubMed] [Google Scholar]
- Feinglass, J. , and Holloway J. J.. 1991. “The Initial Impact of the Medicare Prospective Payment System on U.S. Health Care: A Review of the Literature.” Medical Care Review 48 (1): 91–115. [DOI] [PubMed] [Google Scholar]
- Gottlieb, D. J. , Zhou W., Song Y., Andrews K. G., Skinner J. S., and Sutherland J. M.. 2010. “Prices Don't Drive Regional Medicare Spending Variations.” Health Affairs (Millwood) 29 (3): 537–43. [DOI] [PMC free article] [PubMed] [Google Scholar]
- Hussey, P. S. , Ridgely M. S., and Rosenthal M. B.. 2011. “The PROMETHEUS Bundled Payment Experiment: Slow Start Shows Problems in Implementing New Payment Models.” Health Affairs (Millwood) 30 (11): 2116–24. [DOI] [PubMed] [Google Scholar]
- Hussey, P. S. , Mulcahy A. W., Schnyer C., and Schneider E. C.. 2012. “Closing the Quality Gap: Revisiting the State of the Science (vol. 1: Bundled Payment: Effects on Health Care Spending and Quality).” Evidence Report/Technology Assessment (Full Rep) (208.1): 1–155. [DOI] [PMC free article] [PubMed] [Google Scholar]
- Iezzoni, L. I. , Daley J., Heeren T., Foley S. M., Fisher E. S., Duncan C., Hughes J. S., and Coffman G. A.. 1994. “Identifying Complications of Care Using Administrative Data.” Medical Care 32 (7): 700–15. [DOI] [PubMed] [Google Scholar]
- IMPAQ International and The Hilltop Institute . 2013. “Evaluation of the Medicare Acute Care Episode (ACE) Demonstration: Final Evaluation Report.”
- Kahn, K. L. , Keeler E. B., Sherwood M. J., Rogers W. H., Draper D., Bentow S. S., Reinisch E. J., Rubenstein L. V., Kosecoff J., and Brook R. H.. 1990. “Comparing Outcomes of Care before and after Implementation of the DRG‐Based Prospective Payment System.” Journal of the American Medical Association 264 (15): 1984–8. [PubMed] [Google Scholar]
- Kline, R. M. , Bazell C., Smith E., Schumacher H., Rajkumar R., and Conway P. H.. 2015. “Centers for Medicare and Medicaid Services: Using an Episode‐Based Payment Model to Improve Oncology Care.” Journal of Oncology Practice 11 (2): 114–6. [DOI] [PubMed] [Google Scholar]
- Lave, J. R. 1989. “The Effect of the Medicare Prospective Payment System.” Annual Review of Public Health 10: 141–61. [DOI] [PubMed] [Google Scholar]
- Miller, D. C. , Gust C., Dimick J. B., Birkmeyer N., Skinner J., and Birkmeyer J. D.. 2011. “Large Variations in Medicare Payments for Surgery Highlight Savings Potential from Bundled Payment Programs.” Health Affairs (Millwood) 30 (11): 2107–15. [DOI] [PMC free article] [PubMed] [Google Scholar]
- Osborne, N. H. , Nicholas L. H., Ryan A. M., Thumma J. R., and Dimick J. B.. 2015. “Association of Hospital Participation in a Quality Reporting Program with Surgical Outcomes and Expenditures for Medicare Beneficiaries.” Journal of the American Medical Association 313 (5): 496–504. [DOI] [PMC free article] [PubMed] [Google Scholar]
- Ridgely, M. S. , de Vries D., Bozic K. J., and Hussey P. S.. 2014. “Bundled Payment Fails to Gain a Foothold in California: The Experience of the IHA Bundled Payment Demonstration.” Health Affairs (Millwood) 33 (8): 1345–52. [DOI] [PMC free article] [PubMed] [Google Scholar]
- Shih, T. , Chen L. M., and Nallamothu B. K.. 2015. “Will Bundled Payments Change Health Care? Examining the Evidence Thus Far in Cardiovascular Care.” Circulation 131 (24): 2151–8. [DOI] [PMC free article] [PubMed] [Google Scholar]
- Tsai, T. C. , Joynt K. E., Orav E. J., Gawande A. A., and Jha A. K.. 2013. “Variation in Surgical‐Readmission Rates and Quality of Hospital Care.” New England Journal of Medicine 369 (12): 1134–42. [DOI] [PMC free article] [PubMed] [Google Scholar]
- Tsai, T. C. , Joynt K. E., Wild R. C., Orav E. J., and Jha A. K.. 2015. “Medicare's Bundled Payment Initiative: Most Hospitals Are Focused on a Few High‐Volume Conditions.” Health Affairs (Millwood) 34 (3): 371–80. [DOI] [PubMed] [Google Scholar]
- Weingart, S. N. , Iezzoni L. I., Davis R. B., Palmer R. H., Cahalane M., Hamel M. B., Mukamal K., Phillips R. S., Davies D. T. Jr, and Banks N. J.. 2000. “Use of Administrative Data to Find Substandard Care: Validation of the Complications Screening Program.” Medical Care 38 (8): 796–806. [DOI] [PubMed] [Google Scholar]
Associated Data
This section collects any data citations, data availability statements, or supplementary materials included in this article.
Supplementary Materials
Appendix SA1: Author Matrix.
Appendix SA2:
Methods Appendix. Additional Detail about Methods, Including Matching.
Table S1. Participating Acute Care Episode (ACE) Demonstration Hospitals.
Table S2. MS‐DRGs and ICD‐9 Procedure Codes Used to Define Cohorts.
Table S3. ICD‐9 Procedure Codes Used to Define Complications.
Table S4. Model Specifications.
Table S5. Patient Characteristics at Hospitals Participating in the ACE Demonstration Compared with Nonparticipating (Control) Hospitals before and after Exact Matching.
Table S6. Patient Co‐Morbidities at Hospitals Participating in the ACE Demonstration for Cardiac Surgery Compared with Nonparticipating (Control) Hospitals.
Table S7. Patient Co‐Morbidities at Hospitals Participating in the ACE Demonstration for Orthopedic Surgery Compared with Nonparticipating (Control) Hospitals.