

Abstract
Objective
To measure the impact of prescription drug monitoring programs (PDMPs) on prescribing of opioid and nonopioid painkillers.
Data Source
2010–2013 physician‐level Medicare Part D prescribing data released by the Centers for Medicare and Medicaid Services and Propublica.
Study Design
Using difference‐in‐differences models with physician‐level fixed effects, the study compares prescribing in states with and without PDMPs for opioid and nonopioid analgesics, oxycodone, hydrocodone, and opioids by controlled substances Schedules II–IV.
Principal Findings
Prescription drug monitoring programs were associated with a 5.2 percent decrease in days supply prescribed per physician for oxycodone in addition to smaller reductions for hydrocodone and opioids overall (2.8 percent and 2 percent, respectively) and a small increase in prescribing for Schedule IV opioids. PDMPs were not associated with changes for nonopioid analgesics or other opioids in Schedules II and III. The effects of PDMPs were negated in states where statutes explicitly did not require use of the PDMP.
Conclusions
Prescription drug monitoring programs have a modest effect targeted at the high‐profile drug oxycodone among the Medicare Part D population and an even smaller effect for hydrocodone and opioids in general. The findings suggest some substitution toward lower schedule opioids. Substantially addressing the widespread opioid abuse problem will require enhancing existing PDMPs or implementing new policies.
Keywords: Substance abuse: alcohol/chemical dependency/tobacco, state health policies, Medicare, pharmaceuticals: prescribing/use/costs
A fourfold increase in deaths attributable to prescription painkiller overdose in the United States since 1999 has caught the attention of state policy makers. Opioid painkiller abuse was tied to almost 19,000 deaths in 2014 (Rudd et al. 2016). Opioid‐related emergency department visits and substance abuse treatment admissions have also sharply increased (CDC 2013), and an estimated 4.5 million Americans currently use these prescription drugs for nonmedical purposes (SAMHSA, 2015). These are some of the alarming trends underlying results from a recent study by Case and Deaton (2015) that revealed an unprecedented increase in mortality for middle‐aged, non‐Hispanic whites, driven substantially by rises in drug poisonings, especially from opiates.
Despite the high potential for harm and addiction inherent in opioid painkiller use, the drugs are prescribed extensively in the United States as pain management therapies. Health care providers issued prescriptions for 259 million opioids in 2012, a quantity sufficient to medicate every American adult for a month (CDC 2014). Physicians encounter difficulties in identifying drug‐seeking patients from legitimate pain patients because many opioid abusers engage in a practice known as doctor shopping—that is, concealing their addiction by visiting multiple doctors and pharmacies to obtain numerous prescriptions (Fishbain et al. 2010). Doctor shopping is the most common method of drug procurement for the heaviest‐use opioid abusers (Jones, Paulozzi, and Mack 2014), making this behavior an essential target for public policy.
Currently, 49 states (all but Missouri) have enacted prescription drug monitoring programs (PDMP) as a primary tool for curtailing the illegitimate use of opioids obtained by prescription (NAMSDL 2015). These online databases keep records of prescriptions filled by patients for controlled substances, including opioid painkillers. Physicians can use them to more easily recognize doctor shopping by accessing the records to determine whether their patients have overlapping prescriptions for opioids (Perrone, DeRoos, and Nelson 2012). Ideally, a physician would refrain from prescribing to a drug‐seeking patient and refer him to substance abuse treatment. Indirectly, PDMPs might result in fewer prescriptions written for opioids by creating undesirable administrative hurdles for prescribers or by reinforcing the message to providers and patients that the drugs have a high potential for harm. PDMPs could also encourage physicians to rely more heavily on substitute pain therapies or analgesics such as nonsteroidal anti‐inflammatory drugs (NSAIDs).
Whether prescription drug monitoring programs are effective tools for reducing high‐risk opioid prescribing remains uncertain. In most states, physician use of a PDMP is entirely voluntary. PDMP data are largely not integrated with electronic medical records, making PDMP consultation a time‐consuming task (Perrone, DeRoos, and Nelson 2012). Many programs experience very low use; one study found a median rate of PDMP registration of only 35 percent for physicians who had issued at least one controlled substance prescription (Kreiner, Nikitin, and Shields 2013). Only in the most recent years have a few states begun requiring registration and, in some cases, mandating that physicians access PDMPs prior to issuing opioid prescriptions (National Alliance for Model State Drug Laws 2015). In contrast to this more rigorous approach to PDMP administration, 16 states included language in their statutes as of 2015 explicitly not requiring a physician to utilize the PDMP. Because such a legal statement strongly reinforces the message to physicians that PDMP access is purely voluntary, PDMPs in these states may be underutilized and less impactful. I will control for such statutory language in the models to measure its impact.
Although states have invested millions of dollars into PDMP development and administration, little evidence exists evaluating the programs’ effectiveness in changing prescribing practices. Most studies of PDMPs have analyzed the policies’ effects on possible downstream outcomes such as opioid‐related deaths or addiction treatment facility admissions (Paulozzi, Kilbourne, and Desai 2011; Reifler et al. 2012; Radakrishnan 2014); however, their empirical findings have been mixed, with some studies observing modest improvements in outcomes related to PDMPs and others failing to find significant impacts (Gugelmann, Perrone, and Nelson 2012). Recent work by Rutkow et al. (2015) finds small decreases in physician‐level opioid prescribing in Florida after the implementation of both a PDMP and pill mill legislation; however, it is unclear whether these results are generalizable to other states or in the absence of pill mill laws. (Such laws regulate so‐called pill mills, or pain management clinics that inappropriately prescribe and dispense large quantities of opioids.) I expand on this line of inquiry by examining the effects of PDMPs on physician opioid prescribing behavior across many states using data from the Medicare Part D prescription drug benefit. I also look for changes in prescribing of nonopioid analgesics as evidence of substitution to other pain therapies.
Furthermore, this study explores more nuanced changes in opioid prescribing based on results from Radakrishnan (2014), who observes reduced abuse of the particular opioid Oxycontin (i.e., the branded version of oxycodone), and Paulozzi, Kilbourne, and Desai (2011), who find evidence of switching from Schedule II to Schedule III opioids in states with PDMPs. This study separately estimates the effects of PDMPs on prescribing drugs containing oxycodone and hydrocodone (e.g., Vicodin), which are the most commonly abused opioids (Cicero et al. 2014), and during a recent period that had some of highest levels of opioid abuse, 2010–2013. Finally, this study looks at prescribing of opioid painkillers according to the Drug Enforcement Agency's (DEA) Controlled Substances Schedules II–IV separately.
Methodology
Medicare Prescribing Data
The primary data source measures physician‐level prescribing for patients enrolled in the Medicare Prescription Drug Benefit, or “Part D.” Part D is the optional pharmaceutical insurance program for Medicare beneficiaries that launched in 2006 and provided drug coverage to 37 million Americans in 2013 (CMS 2016). The first year available for these data is 2010. They were compiled for 2010–2012 by the nonprofit news organization, ProPublica, and provided as the Prescriber Checkup database. For 2013, the Centers for Medicare and Medicaid Services (CMS) released the data itself. In both cases, the data report all prescriptions written by physicians and filled through Medicare Part D. All providers with at least 50 Medicare prescriptions were included. Drugs for which a provider wrote fewer than 10 prescriptions each year were suppressed to protect patient confidentiality. Each observation describes the total days supply of prescriptions written for each drug by each provider in a given year.
Although illicit drug abuse is not a problem commonly associated with individuals in Medicare, prescription drug abuse and misuse is an area of rising concern for this population (SAMHSA 2012b)—as evidenced by numerous policies recently adopted by the Department of Health and Human Services trying to combat problematic prescribing in Medicare (Opioid Use Among Seniors, [Link]). Individuals become Medicare Part D–eligible either by age (i.e., 65 years or older) or disability (through Social Security Disability Insurance). In 2013, nearly 7 million of Part D enrollees were under the age of 65 and eligible for the program due to disability status (Centers for Medicare & Medicaid Services 2016). These disabled beneficiaries accounted for more than 25 percent of the drug claims used in this study. Not only is this population more likely to abuse drugs based on their younger age, approximately 34 percent of them qualified for disability benefits due to musculoskeletal conditions—often chronic back pain (SSA 2012)—and these types of patients are prescribed opioid medications in significant numbers. In 2011, almost 44 percent of disabled Medicare beneficiaries received at least one opioid prescription, and 23 percent were chronic users (Morden et al. 2014).
Doctor shopping remains a problem within the Medicare population. A third of total Part D beneficiaries—10 million individuals—filled at least one opioid prescription in 2011 due to the high incidence of chronic pain (MedPAC 2014). The Government Accountability Office (GAO) (2011) examined Part D claims from 2008 and found 170,000 cases of doctor shopping, 80 percent of which were associated with the opioids oxycodone and hydrocodone. Beneficiaries suspected of doctor shopping represented 1.8 percent of the Medicare population with prescriptions for these drugs.
While research finds that the 65 and older Medicare population abuses prescription drugs at a significantly lower rate than younger individuals, abuse does still occur among this older cohort and has grown in recent years as the baby boom generation has aged into Medicare eligibility (Colliver et al. 2006; Han et al. 2009). Inpatient hospital stays related to opioid overuse by Medicare beneficiaries increased 10.6 percent annually between 1993 and 2012 (Medicare Payment Advisory Commission 2014). There are also clinical reasons to monitor their opioid prescription history for older patients, who show increased sensitivity to opioids and can experience adverse drug events. These patients’ greater use of pharmaceuticals in general present more opportunities for dangerous interactions between opioids and drugs such as sedatives (SAMHSA 2012a). Overall, the Medicare Part D program data provide an interesting way to analyze the effects of PDMPs on opioid prescribing. However, to the extent that the older population abuses drugs at lower rates, the estimated effects of PDMPs found in this study may be lower than what would be observed using data of prescribing for younger patients.
Dependent Variables
There are seven dependent variables used in the models to measure multiple dimensions of the effect of PDMPs on prescribing patterns. Using the drug‐specific values for the number of days supply prescribed per physician, I aggregated up to the following analgesic categories—total days supply prescribed per physician for all opioids, nonopioid analgesics, oxycodone‐containing products, hydrocodone‐containing products, and opioids categorized in DEA Schedules II–IV. The dependent variables are log‐transformed to account for skewness. As a result, the models include only physicians with nonzero prescribing in the given categories. The total sample included 789,569 physician‐year observations, 451,583 (57 percent) of which had at least one opioid prescription. I identified opioid and nonopioid pain relievers based on classifications from the Medicare Formulary Reference File. There were 208 painkillers identified in the data, of which 122 were opioids.
The first two models examine the effects of PDMPs on opioid and nonopioid analgesic prescribing broadly, while the oxycodone and hydrocodone models hone in more closely on the two high‐profile drugs associated with prescription painkiller abuse. If PDMPs have any effects on prescribing, I would expect them to be most pronounced for these specific drugs. Finally, I examine changes in prescribing for different schedules of controlled substances to observe potential substitution from higher Schedule II drugs (considered by the DEA to have a greater potential for harm and addiction) to lower schedule III and IV drugs. During this study period, the DEA classified oxycodone as a Schedule II drug. Hydrocodone was designated a Schedule III drug with fewer restrictions (but was reclassified to Schedule II in 2014). The Schedule II and III categories are exclusive of oxycodone‐ and hydrocodone‐containing products, respectively, as the effects on these drugs are measured separately in the other models.
Table 1 shows the means of the dependent and independent variables for the sample grouped by states with and without PDMPs. Observations are included under the “States with PDMP” category if they were from a state and year when a PDMP was operational for part of that year. There are statistically significant differences in prescribing between states with and without PDMPs for all analgesic categories. The logged values are higher for observations in PDMP states, which highlights the need to account for endogeneity of PDMP status. This study attempts to do so with a difference‐in‐differences framework and through the use of physician‐level fixed effects.
Table 1.
Variable Means and Proportions by PDMP Status
| Variable | Variable Definition | States without PDMP | States with PDMP |
|---|---|---|---|
| Independent variables | |||
| PDMP | State has an operational, online PDMP | – | 0.785 (0.313) |
| [0.08, 1] | |||
| PDMP statue | Statute explicitly does not require PDMP access | – | 0.217 (0.381) |
| [0, 1] | |||
| Dependent variables | |||
| Opioids | Logged days supply opioids | 6.858 (1.766) | 6.891* (1.765) |
| [2.485, 13.05] | [2.398, 13.08] | ||
| Nonopioids | Logged days supply nonopioid analgesics | 7.378 (1.280) | 7.402* (1.319) |
| [2.485, 11.78] | [2.398, 11.88] | ||
| Oxycodone | Logged days supply oxycodone | 6.283 (1.469) | 6.320* (1.493) |
| [2.398, 12.12] | [2.398, 12.26] | ||
| Hydrocodone | Logged days supply hydrocodone | 6.403 (1.506) | 6.440* (1.537) |
| [2.565, 12.10] | [2.398, 12.19] | ||
| Schedule II | Logged days supply Sch. II opioids (not oxycodone) | 6.923 (1.065) | 6.943* (1.142) |
| [2.398, 11.95] | [2.485, 12.23] | ||
| Schedule III | Logged days supply Sch. III opioids (not hydrocodone) | 5.723 (0.927) | 5.803* (0.924) |
| [2.639, 9.549] | [2.197, 10.26] | ||
| Schedule IV | Logged days supply Sch. IV opioids | 6.801 (1.228) | 6.827* (1.213) |
| [2.398, 11.47] | [2.485, 11.29] | ||
| Control variables | |||
| Enrollment | County Part D enrollment (in 1,000s) | 59.36 (62.70) | 87.19* (84.09) |
| [0, 305.2] | [0.00858, 350.9] | ||
| Medicare costs | Per capita Medicare costs (in 1,000s) | 9.290 (1.540) | 9.677* (1.871) |
| [2.862, 15.43] | [3.384, 16.70] | ||
| Median income | County median income (in 1,000s) | 51.86 (13.29) | 53.22* (12.56) |
| [20.58, 108.5] | [21.57, 107.2] | ||
| HHI | County HHI for physician prescribing | 193.0 (511.8) | 138.1* (437.7) |
| [7.544, 10,000] | [6.955, 10,000] | ||
| White | Percent county population white | 66.14 (21.65) | 61.05* (20.51) |
| [2.860, 98.65] | [3.170, 97.78] | ||
| Black | Percent county population black | 14.60 (15.02) | 11.95* (10.20) |
| [0, 73.59] | [0.0200, 72.68] | ||
| Hispanic | Percent county population Hispanic | 13.23 (15.00) | 20.08* (17.33) |
| [0.340, 95.71] | [0.630, 95.67] | ||
| Asian | Percent county population Asian | 3.717 (3.457) | 4.414* (3.843) |
| [0, 29.55] | [0, 31.48] | ||
| Other race | Percent county population other races | 2.305 (2.650) | 2.501* (2.779) |
| [0.0900, 94.53] | [0.100, 92.24] | ||
| Observations | 269,888 | 212,279 | |
Standard deviations in parentheses; minimum and maximum values in brackets.
Significantly different from the “States without PDMP” category (*p < .01).
The data represent measures of Medicare Part D prescribing and other variables from 2010 to 2013. The table includes summary statistics for all observations that are included in at least one of the seven study models. Values under “States without PDMP” include statistics from time periods when a state had no online PDMP operational during the year. The number of states falling under this category ranged from 20 states in 2010 to five states in 2013. Values under “States with PDMP” include statistics from time periods when a state had an online PDMP operational for at least part of the year. “HHI” refers to a Herfindahl–Hirschman Index.
Prescription Drug Monitoring Programs
This article is specifically interested in the effect of monitoring programs that allow health care providers real‐time access to patient information. The only practical way to accomplish this is to provide physicians with online PDMP access. Early PDMPs relied on fax or other cumbersome modes of communication, and especially prior to widespread high‐speed Internet access, they did not allow timely access to prescribers wanting information. Therefore, I only consider a state to have a PDMP in time t if their program met all of three conditions: (1) prescriber and dispenser access (as opposed to only law enforcement, for example), (2) online access, and (3) required reporting of all prescriptions dispensed by the pharmacy. Under these circumstances, prescribers have a tool available that offers both complete and timely information. In the models, I include a variable with a value of 1 if a state had an online PDMP operational for the entire year in time t, 0 if a state had no PDMP during the year, and a value between 0 and 1 representing the proportion of the year the PDMP was operational if the state launched its PDMP in time t.
Prescription drug monitoring programs vary in their implementation, making some more binding and more likely to have an impact on physicians’ PDMP use and prescribing behaviors. As previously mentioned, several states have recently begun requiring physicians to access the PDMP prior to issuing opioid prescriptions. These regulations almost all went into effect after the end of this study period and are promising topics for future research as new data become available. I do control for states that have statutes that specifically do not require physicians to utilize PDMPs. Of the physicians subject to a PDMP in the sample, 27 percent of them practiced in such states.
Because I am using a difference‐in‐differences framework to observe the effect of introducing a PDMP in a state, I limit my analysis to those states that either implemented a new online PDMP during 2011–2013 (the first year of data availability, 2010, serving as a pretreatment time period) or who had still not implemented one by 2013. I exclude the 29 states that already had PDMPs in place prior to 2011. (Massachusetts is maintained in the dataset because its PDMP began only in December 2010.) The 21 states included in the analysis and their dates of PDMP adoption are displayed in Figure 1. PDMP dates of operation came from the National Alliance for Model State Drug Laws (NAMSDL) and were supplemented by correspondence with state PDMP administrators. Care was taken to ensure that the dates used to determine a state's PDMP status reflected when PDMPs were actually operational online and available for physician use.
Figure 1.
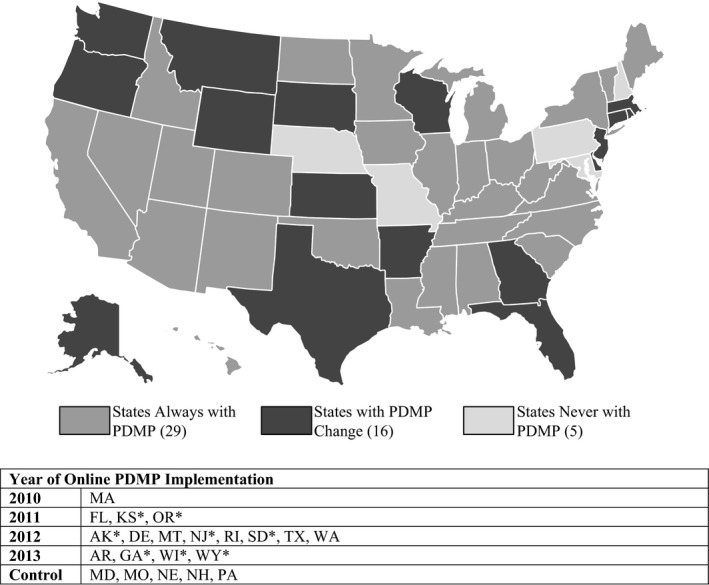
State Status for Operational Online Prescription Drug Monitoring Programs, 2010–2013
Source: National Alliance for Model State Drug Laws (NAMSDL) with supplementary data collected by author in communication with state PDMP coordinators. *Indicates that the state's PDMP statute contains language explicitly not requiring physicians to utilize the program.
Following the introduction of the Massachusetts PDMP in late 2010, three states—Florida, Kansas, and Oregon—had programs become operational in 2011, followed by eight more in 2012, and another four in 2013. A final five states had no PDMP operational online by the end of the study period. On average, 30.6 percent of providers in the sample practiced in states where they had online access to a PDMP. Two states—Texas and Rhode Island—had older PDMPs in place prior to the study period but began offering online access between 2011 and 2013.
Covariates
I obtain county‐level economic and demographic variables from the U.S. Census Bureau American Community Survey, including median income and percent of population by race and ethnicity. I also control for the size and characteristics of the county Medicare population using CMS‐provided data. I control for the number of Medicare Part D enrollees and the standardized per capita Medicare costs of beneficiaries in the county.
Finally, I account for the concentration of the county physician market by constructing a Herfindahl–Hirschman Index (HHI) equal to the sum of the squared values of each physician's percentage of countywide prescribing. A larger measure indicates that more prescribing is concentrated in fewer doctor's practices in a county. Because doctor shopping relies on the ability to visit multiple doctors, a more concentrated market might make doctor shopping more difficult.
Models
To understand the potential effect of PDMPs, I employ a series of difference‐in‐differences regression models using ordinary least squares with physician and year fixed effects to predict the different outcome variables as a function of state PDMPs, statutes not requiring PDMP access, and the controls described above. I also employ cluster‐robust standard errors (clustered by physician) to adjust for heteroskedasticity and correlation in the individual errors (Cameron and Travedi 2005).
As specified, the models are the equivalents of difference‐in‐differences estimation because all of the states included in the analysis either implement a PDMP during the study period (i.e., the treatment group) or never have a PDMP (i.e., the control group). These treatment and control group identifiers are captured in the physician fixed effects. The year indicator variable measures the pre‐ and post‐treatment identifiers. The PDMP variable then becomes the algebraic equivalent of the interaction term in a DID model. The DID approach helps to reduce endogeneity concerns. Inclusion of physician fixed effects further reduces the potential bias of PDMP status being nonrandomly assigned by measuring within‐physician variation and controlling for time‐invariant prescriber characteristics, such as medical specialty. Finally, the year fixed effects control for secular time trends in opioid prescribing patterns.
In order for a difference‐in‐differences estimator to be unbiased, the assumption must hold that the trends in the outcome variable for the treatment and control groups would have followed the same pattern in the absence of the policy intervention. Typically, visual inspection of a pretrend analysis will provide evidence of this counterfactual. With no pre‐2010 observations available in the dataset, I rely instead on CMS's State Drug Utilization Data (SDUD)—which provides state‐level measures of Medicaid prescribing—to compare trends for the treatment and control states in the years preceding the study period. Figure 2 displays the numbers of opioid prescriptions filled through Medicaid per 100,000 beneficiaries from 2005 to 2009 for the 21 states analyzed in this study. The trends are parallel in the period leading up to this study, providing support that the DID models will produce unbiased estimates of the effect of PDMPs.
Figure 2.
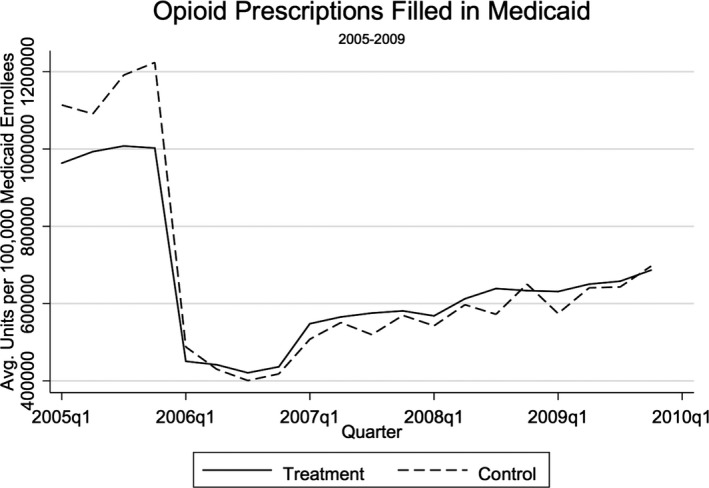
Pretrend Analysis of Opioid Prescribing in Treatment and Control States, 2005–2009
Source: Centers for Medicare & Medicaid Services States Drug Utilization Data. Note. The sharp decline in prescriptions between 2005 and 2006 is explained by the transfer of prescription drug coverage for dual‐eligible Medicare and Medicaid enrollees from Medicaid to the Medicare Part D program beginning in 2006.
Table 2 displays the unadjusted differences in prescribing for the treatment and control groups between the pretreatment period, 2010, and the final treatment period, 2013. These estimates show small deviations between the two groups and prescribing decreases for only oxycodone and Schedule III opioids. Values are positive for opioids, nonopioids, hydrocodone, and Schedules II and IV. As such, I proceed with the following model specifications:
where the unit of analysis for all models is prescriber i in each time period t. lnRXicst represents the logged days supply of opioid analgesics, nonopioid analgesics, oxycodone, hydrocodone, and DEA controlled substances Schedules II–IV prescribed by provider i in the cth county and the sth state in time t. The predicted values of lnRXicst are estimated as a function of a state's PDMP status in time t, PDMPst, if the state's statute explicitly does not require physician use of the PDMP, STATUTEst , along with county and individual characteristics and time. County characteristics, Z ct, include median income (in $1,000s), number of Part D enrollees (in 1,000s), per capita Medicare spending (in $1,000s), percent of population by race and ethnicity, and the HHI measure of physician market concentration. Physician fixed effects are captured in δ i, τ t comprises the year dummies, and the error term is εicst.
Table 2.
Raw Difference‐in‐Differences Estimates for Logged Days Supply of Opioid and Nonopioid Analgesics between 2010 and 2013
| Opioids | Nonopioids | Oxycodone | Hydrocodone | Schedule II* | Schedule III* | Schedule IV | |
|---|---|---|---|---|---|---|---|
| Treatment Group 2013 | 6.920 | 7.452 | 6.346 | 6.466 | 6.972 | 5.820 | 6.849 |
| Treatment Group 2010 | 6.801 | 7.302 | 6.260 | 6.353 | 6.877 | 5.708 | 6.744 |
| Treatment Group Difference | 0.119 | 0.151 | 0.085 | 0.112 | 0.095 | 0.111 | 0.106 |
| Control Group 2013 | 6.956 | 7.487 | 6.351 | 6.472 | 6.994 | 5.777 | 6.881 |
| Control Group 2010 | 6.878 | 7.388 | 6.222 | 6.375 | 6.909 | 5.655 | 6.802 |
| Control Group Difference | 0.077 | 0.099 | 0.129 | 0.098 | 0.085 | 0.122 | 0.080 |
| Raw Difference‐in‐Differences | 0.041 | 0.052 | −0.043 | 0.014 | 0.009 | −0.011 | 0.026 |
Values represent the average logged days supply of the analgesic categories among physicians with any prescribing in those categories.
*Schedule II and Schedule III models measure days supply of opioids prescribed in the schedules exclusive of oxycodone‐ or hydrocodone‐containing drugs, respectively.
Results
The coefficients and confidence intervals for the two main variables of interest—PDMP and statutory language not requiring PDMP use (“PDMP Statute”)—are represented in Figure 3. Complete regression results for these seven DID regressions are presented in the Appendix SA1. With logged dependent variables, the coefficients are interpreted as the percent change in prescribing among physicians with nonzero prescribing. Only three categories of analgesics—opioids, oxycodone, and hydrocodone—show statistically significant decreases in days supply prescribed associated with the presence of a PDMP. The larger oxycodone result is consistent with the raw DID estimates from Table 2. Prescriptions containing oxycodone reduced by an average of 5.2 percent per physician. Prescribing for opioids overall and for hydrocodone products shows declines of a much smaller magnitude at 2 percent and 2.8 percent, respectively.
Figure 3.
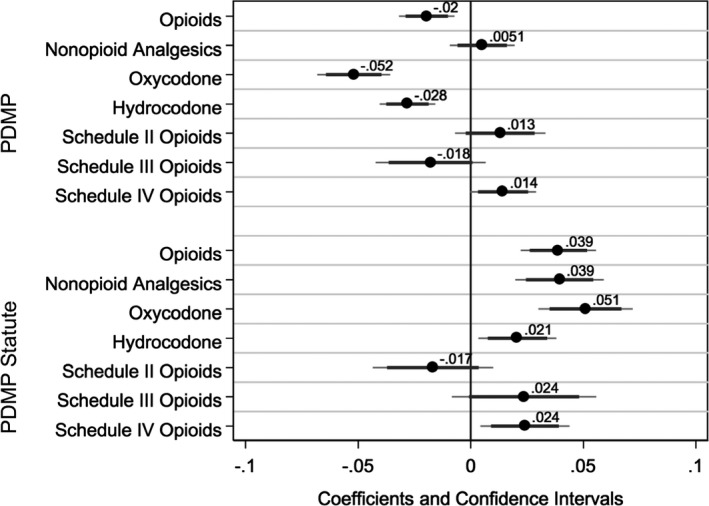
Coefficient Plots for PDMP and PDMP Statute Variables in Difference‐in‐Differences Models Estimating Changes in Logged Prescribing Dependent Variables
Note. Confidence intervals indicated at 99 percent and 95 percent levels.
Prescription drug monitoring programs are not associated with greater prescribing of nonopioid analgesics. However, they are correlated with a small 1.4 percent increase in prescribing for Schedule IV opioids such as tramadol. There were no statistically significant differences in days prescribed for Schedule II or III opioids (excluding oxycodone and hydrocodone) associated with PDMPs.
Figure 3 illustrates an interesting relationship between the model coefficients for PDMPs and the coefficients for the PDMP Statute variable. These coefficients are essentially mirror images of each other. For oxycodone, hydrocodone, and opioids overall, a significant negative coefficient for PDMP is matched with a positive coefficient with a similar magnitude for the statute.
Results from fixed effects models employing untransformed, winsored dependent variables yielded qualitatively similar results as these models with logged dependent variables, with the exception that the significant but small effects observed for opioids overall and hydrocodone products in the logged models become insignificant in the nonlogged specifications. As an additional robustness check to rule out Type 1 errors, I conduct a series of placebo tests by randomizing PDMP treatment by state and year. The models for oxycodone and opioids overall easily pass this falsification test, providing additional credence to the estimated effects. The model for hydrocodone only marginally passes the test, and the model for Schedule IV opioids does not pass, indicating these findings may be less robust. As a result, the estimates from these models may be considered associations rather than causal effects.
Discussion
These findings show that PDMPs have significant but limited impacts on physician prescribing behaviors among the Medicare Part D population. The regression results provide evidence that PDMPs have had some success in a targeted way by reducing prescribing for one of the most abused and publicized drugs of the opioid epidemic—oxycodone. The 5.2 percent average decrease indicated by the model represents 83.6 fewer days supply (or slightly less than three 30‐day prescriptions) of oxycodone prescribed per physician. This is a meaningful effect but is still modest when compared to the widespread increases in oxycodone use.
Despite being a more extensively prescribed drug than oxycodone, hydrocodone prescriptions showed only a small response to the introduction of a PDMP. Certainly, hydrocodone is also a highly addictive and widely abused drug in its own right. The average reduction for hydrocodone was 53.1 days supply. Furthermore, it does not seem to be the case that PDMPs have a large, generalized effect on overall opioid prescribing. The 2 percent average decline estimated here for opioids represents only 77 fewer days supply prescribed, that is, approximately 2.5 30‐day prescriptions per doctor per year.
An expected and perhaps desired response was not observed for nonopioid painkillers, prescribing for which did not show significant changes following PDMP implementation. However, the coefficient might underestimate the full effect because many options for these drugs are available over the counter and would not appear in the claims data. Switching away from oxycodone and hydrocodone appears to move some consumption toward Schedule IV opioid painkillers. Prescribing for these drugs rose by approximately 25.3 days supply. This supports the idea that there is substitution occurring to the supposedly less harmful Schedule IV drugs when PDMPs are introduced. It is possible that interfacing with PDMPs makes physicians more aware of the relative risks of opioid painkillers and has encouraged greater reliance on lower schedule drugs. The extent to which these shifts are welfare enhancing is not possible to ascertain from the data.
The second main finding relates to the impact of statutory language designed to protect physicians by asserting that they are under no obligation to utilize the PDMP and its data. In the models, the “PDMP Statute” variable acts as an interaction term denoting that a state has both a PDMP and such a statute. As Figure 3 makes clear, changes produced by the PDMP are negated by the presence of such a statute. For example, the 5.2 percent days supply decline in oxycodone related to PDMP implementation is met with a 5.1 percent days supply increase when the law absolves doctors from the need to use the PDMP. In practice, it seems that the suggestive power of this aspect of the PDMP legislation sends a powerful message to physicians that negatively influences their use of the databases.
Limitations
There are several limitations of the study that must be considered when drawing conclusions based on its findings. First, the prescribing data used do not provide information on dosage strength, making it impossible to determine whether average prescription strength changed post‐PDMP implementation. Secondly, the current study does not track other interventions that may have been implemented simultaneously with PDMPs and been responsible for changes in opioid prescribing, such as “pill mill” restrictions. The sharp increase in opioid abuse in recent years provoked various policy responses, many of which would be difficult to identify and track. (However, a nationwide policy change would be controlled for in the year fixed effects.) In some cases, drug‐seeking individuals may respond to PDMPs by visiting doctors across state borders in states without PDMPs. To the extent this occurs, these models may overstate the benefits of the programs. Another limitation, already discussed, is the use of Medicare data. It is possible that studies looking at prescribing outside the Medicare program may uncover more pronounced impacts for PDMPs. Perhaps physicians are more likely to access the PDMP for non‐Medicare patients, who they might consider to be more likely to abuse drugs.
I explored estimating a hierarchical model that accounted for the variation present multiple levels in the data—physicians within counties within states. Due to the short nature of the panel, a fully hierarchical model proved infeasible. Additionally, the use of a DID estimator and physician fixed effects control for unobservable time‐invariant sources of endogeneity; however, to the extent that time‐variant sources of endogeneity may still be present, results can be considered correlations and not causal.
Another limitation arises from the use of pharmaceutical claims data to study prescribing. If drug seekers feared their behaviors would be uncovered from monitoring of their insurance claims and they attempted to hide their behaviors by paying out of pocket for prescriptions, those transactions would not appear in these Medicare data. However, the possibility of being identified as a drug seeker from Part D claims was very low during this study period, as CMS did not require Part D insurers to conduct utilization review for opioid misuse until July of 2013 (McCutcheon 2014). Finally, recent changes in PDMP requirements may make these programs more effective tools as time goes by. Registration requirements and access mandates have been adopted in a few states and should reduce the problem of PDMP underutilization by physicians. Future research with more up‐to‐date data should explore these policy details.
Conclusions
Today, nearly every American lives in a state where filling a prescription for an opioid painkiller means being tracked by a prescription drug monitoring program. The reach of these programs is expansive; therefore, their effects are quite relevant to health care policy research. While PDMPs are seen as promising tools for reducing opioid abuse, the literature has produced conflicting findings on their actual effectiveness.
This study adds to the literature in a number of ways. It relies upon a large, recent dataset of physician‐level prescribing. Second, it gets to the potential core effect of monitoring programs by examining the number of prescriptions filled for opioids. Finally, this study employs a difference‐in‐differences approach and physician fixed effects to address the potential for endogeneity in program adoption.
The findings present a nuanced picture of physician response to PDMP implementation within a specific patient population. Decreases are most concentrated on oxycodone; however, even these changes are small when compared to the large increases in oxycodone use during recent years. Changes for opioid prescribing in general and for hydrocodone specifically are even more modest. These findings suggest that PDMPs are effective in reducing opioid prescribing in a limited and targeted capacity. Physicians seem to be changing their behaviors primarily with respect to the drug most commonly associated with prescription abuse. These reductions in prescribing are met with corresponding increases in prescribing for Schedule IV opioids. A similar effect was observed by Paulozzi, Kilbourne, and Desai (2011). The results indicate that PDMP administrators should make efforts to broaden the perceived opioid threat beyond oxycodone. Furthermore, the results present compelling evidence that statutes that explicitly do not require physicians to access PDMP data largely eliminate the impacts of monitoring programs on prescribing. The 16 states with such statutes on the books should consider revising them to increase program utilization. Additionally, researchers should account for this variable in their studies, as it serves to attenuate PDMP effectiveness.
Ultimately, both pain and drug abuse will continue to be serious public health threats in the foreseeable future. Federal and state policy makers have the difficult task of trying to balance their management of these threats and ensure that victories in one arena do not produce suffering in the other. These findings suggest that a key tool in combatting the prescription abuse epidemic does not operate in straightforward ways. Future research should continue to look for ways to improve existing PDMPs or for alternative types of policies to reduce opioid abuse.
Supporting information
Appendix SA1: Coefficients for Difference‐in‐Differences Models Predicting Logged Days Supply Prescribed for Opioid and Nonopioid Analgesics (Conditional on Any), Physician and Year Fixed Effects.
Acknowledgments
Joint Acknowledgment/Disclosure Statement: Funding for this research was provided by the Robert Wood Johnson Foundation's (RWFJ) Public Health Law Research program (72227). The author thanks RWJF for its financial support in the area of prescription painkiller abuse. She also thanks W. David Bradford and Tyler Scott at the University of Georgia for their helpful comments.
Disclosures: None.
Disclaimer: None.
References
- Cameron, A. C. , and Travedi P. K.. 2005. Microeconomics: Methods and Applications. Cambridge, UK: Cambridge University Press. [Google Scholar]
- Case, A. , and Deaton A.. 2015. “Rising Morbidity and Mortality in Midlife among White non‐Hispanic Americans in the 21st Century.” Proceedings of the National Academy of Sciences of the United States of America 112 (49): 15078–83. [DOI] [PMC free article] [PubMed] [Google Scholar]
- Centers for Disease Control and Prevention . 2013. “Vital Signs: Overdoses of Prescription Opioid Pain Relievers and Other Drugs among Women‐United States, 1999–2010.” Morbidity and Mortality Weekly Report 62: 537–42. [PMC free article] [PubMed] [Google Scholar]
- Centers for Disease Control and Prevention . 2014. Opioid Prescription Painkiller Prescribing: Where You Live Makes a Difference. Retrieved from https://www.cdc.gov/vitalsigns/opioid-prescribing/
- Centers for Medicare & Medicaid Services . 2016. “CMS Chronic Condition Data Warehouse: Medicare Part D Beneficiary Counts 2006–2014” [accessed May 3, 2016]. Available at https://www.ccwdata.org/web/guest/medicare-tables-reports
- Cicero, T. J. , Ellis M. S., Surratt H. L., and Kurtz S. P.. 2014. “The Changing Face of Heroin Use in the United States: A Retrospective Analysis of the Past 50 Years.” JAMA Psychiatry 71 (7): 821–6. [DOI] [PubMed] [Google Scholar]
- Colliver, J. D. , Compton W. M., Gfroerer J. C., and Condon T.. 2006. “Projecting Drug use among Aging Baby Boomers in 2020.” Annals of Epidemiology 16 (4): 257–65. [DOI] [PubMed] [Google Scholar]
- Fishbain, D. , Johnson S., Webster L., Greene L., and Faysal J.. 2010. “Review of Regulatory Programs and new Opioid Technologies in Chronic Pain Management: Balancing the Risk of Medication Abuse with Medical Need.” Journal of Managed Care Pharmacy: JMCP 16 (4): 276–87. [DOI] [PMC free article] [PubMed] [Google Scholar]
- Government Accountability Office . 2011. “Medicare Part D: Instances of Questionable Access to Prescription Drugs” [accessed May 1, 2016]. Available at http://www.gao.gov/products/GAO-11-699
- Gugelmann, H. , Perrone J., and Nelson L.. 2012. “Windmills and Pill Mills: Can PDMPs Tilt the Prescription Drug Epidemic?” Journal of Medical Toxicology 8 (4): 378–86. [DOI] [PMC free article] [PubMed] [Google Scholar]
- Han, B. , Gfroerer J. C., Colliver J. D., and Penne M. A.. 2009. “Substance Use Disorder among Older Adults in the United States in 2020.” Addiction 104 (1): 88–96. [DOI] [PubMed] [Google Scholar]
- Jones, C. M. , Paulozzi L. J., and Mack K. A.. 2014. “Sources of Prescription Opioid Pain Relievers by Frequency of Past‐Year Nonmedical Use United States, 2008–2011.” JAMA Internal Medicine 174 (5): 802–3. [DOI] [PMC free article] [PubMed] [Google Scholar]
- Kreiner, P. , Nikitin R., and Shields T. P.. 2013. “Bureau of Justice Assistance Prescription Drug Monitoring Program Performance Measures Report: January 2009 through June 2012” [accessed June 11, 2016]. Available at http://www.pdmpexcellence.org/sites/all/pdfs/BJA PDMP Performance Measures Report Jan 2009 to June 2012 FInal_with feedback.pdf
- McCutcheon, T. A . 2014. Medicare Part D Overutilization Monitoring System. Centers for Medicare and Medicaid Services. Available at https://www.cms.gov/Medicare/Prescription-Drug-Coverage/PrescriptionDrugCovContra/Downloads/HPMSmemo_MedicarePartDOverutilizationMonitoringSystem011714.pdf.
- Medicare Payment Advisory Commission . 2014. “Opioid Use among Medicare Part D Enrollees” [accessed April 18, 2015]. Available at http://www.medpac.gov/blog/october-2014/october-2014/2014/10/22/opioid-use-among-medicare-part-d-enrollees
- Morden, N. E. , Munson J. C., Colla C. H., Skinner J. S., Bynum J. P., Zhou W., and Meara E. R.. 2014. “Prescription Opioid Use among Disabled Medicare Beneficiaries: Intensity, Trends and Regional Variation.” Medical Care 52 (9): 852. [DOI] [PMC free article] [PubMed] [Google Scholar]
- National Alliance for Model State Drug Laws . 2015. “2015 Annual Review of Prescription Drug Monitoring Programs” [accessed May 1, 2016]. Available at http://www.namsdl.org/library/1810E284-A0D7-D440-C3A9A0560A1115D7/
- Opioid Use Among Seniors – Issues and Emerging Trends , U.S. Senate, Testimony by Sean Cavanaugh, Deputy Administrator and Director, Center for Medicare Sess (2016).
- Paulozzi, L. J. , Kilbourne E. M., and Desai H. A.. 2011. “Prescription Drug Monitoring Programs and Death Rates from Drug Overdose.” Pain Medicine 12 (5): 747–54. [DOI] [PubMed] [Google Scholar]
- Perrone, J. , DeRoos F. J., and Nelson L. S.. 2012. “Prescribing Practices, Knowledge, and Use of Prescription Drug Monitoring Programs (PDMP) by a National Sample of Medical Toxicologists, 2012.” Journal of Medical Toxicology 8 (4): 341–52. [DOI] [PMC free article] [PubMed] [Google Scholar]
- Radakrishnan, S . 2014. “The Impact of Information in Health Care Markets: Prescription Drug Monitoring Programs and Abuse of Opioid Pain Relievers” [accessed February 24, 2016]. Available at http://paa2014.princeton.edu/papers/143182
- Reifler, L. M. , Droz D., Bailey J. E., Schnoll S. H., Fant R., Dart R. C., and Bucher Bartelson B.. 2012. “Do Prescription Monitoring Programs Impact State Trends in Opioid Abuse/Misuse?” Pain Medicine 13 (3): 434–42. [DOI] [PubMed] [Google Scholar]
- Rudd, R. A. , Aleshire N., Zibbell J. E., and Gladden R. M.. 2016. Increases in Drug and Opioid Overdose Deaths — United States, 2000‐2014. Retrieved from https://www.cdc.gov/mmwr/preview/mmwrhtml/mm6450a3.htm [DOI] [PubMed]
- Rutkow, L. , Chang H., Daubresse M., Webster D. W., Stuart E. A., and Alexander G.. 2015. “Effect of Florida's Prescription Drug Monitoring Program and Pill Mill Laws on Opioid Prescribing and Use.” JAMA Internal Medicine 175 (10): 1642–9. [DOI] [PubMed] [Google Scholar]
- Substance Abuse and Mental Health Services Administration . 2012. a. “Substance Abuse among Older Adults” [accessed April 13, 2016]. Available at http://store.samhsa.gov/product/TIP-26-Substance-Abuse-Among-Older-Adults/SMA12-3918
- Substance Abuse and Mental Health Services Administration . 2012. b. “Prescription Medication Misuse and Abuse among Older Adults” [accessed April 13, 2016]. Available at https://aoa.acl.gov/AoA_Programs/HPW/Behavioral/docs2/Issue%20Brief%205%20Prescription%20Med%20Misuse%20Abuse.pdf
- Substance Abuse and Mental Health Services Administration . 2015. Behavioral Health Trends in the United States: Results from the 2014 National Survey on Drug Use and Health. Rockville, MD. Available at http://www.samhsa.gov/data/sites/default/files/NSDUH-FRR1-2014/NSDUH-FRR1-2014.pdf
- U.S. Social Security Administration . 2012. Annual Statistical Report on the Social Security Disability Insurance Program, 2011 [accessed May 2, 2016]. Available at https://www.ssa.gov/policy/docs/statcomps/di_asr/2011/index.html
Associated Data
This section collects any data citations, data availability statements, or supplementary materials included in this article.
Supplementary Materials
Appendix SA1: Coefficients for Difference‐in‐Differences Models Predicting Logged Days Supply Prescribed for Opioid and Nonopioid Analgesics (Conditional on Any), Physician and Year Fixed Effects.