

Abstract
Objective
To evaluate the prevalence of seven social factors using physician notes as compared to claims and structured electronic health records (EHRs) data and the resulting association with 30‐day readmissions.
Study Setting
A multihospital academic health system in southeastern Massachusetts.
Study Design
An observational study of 49,319 patients with cardiovascular disease admitted from January 1, 2011, to December 31, 2013, using multivariable logistic regression to adjust for patient characteristics.
Data Collection/Extraction Methods
All‐payer claims, EHR data, and physician notes extracted from a centralized clinical registry.
Principal Findings
All seven social characteristics were identified at the highest rates in physician notes. For example, we identified 14,872 patient admissions with poor social support in physician notes, increasing the prevalence from 0.4 percent using ICD‐9 codes and structured EHR data to 16.0 percent. Compared to an 18.6 percent baseline readmission rate, risk‐adjusted analysis showed higher readmission risk for patients with housing instability (readmission rate 24.5 percent; p < .001), depression (20.6 percent; p < .001), drug abuse (20.2 percent; p = .01), and poor social support (20.0 percent; p = .01).
Conclusions
The seven social risk factors studied are substantially more prevalent than represented in administrative data. Automated methods for analyzing physician notes may enable better identification of patients with social needs.
Keywords: Social determinants of health, readmissions, natural language processing, quality of care
The past several years have seen a series of policies and programs by federal, state, and private payers attempting to improve the value of health care. For example, the CMS Hospital Readmissions Reductions Program (HRRP) provides direct financial incentives for health systems to reduce unplanned readmissions, and both the Medicare Pioneer Accountable Care Organization (ACO) and Shared Savings Programs included readmissions among the 33 core measures (Krumholz et al. 2011; CMS 2014a). As health systems navigate these payment programs, the social characteristics of their patient populations play an important role in determining readmission rates and the impact of HRRP and ACO programs on health system reimbursement (Joynt, Orav, and Jha 2011; Barnett, Hsu, and McWilliams 2015). This is in part because social factors beyond age and gender are not included in risk adjustment (Barnett, Hsu, and McWilliams 2015). Consequently, many health systems have launched care management and discharge transitions programs to assist vulnerable patients in navigating the complexities of transitions in care, including programs that create partnerships with community physicians, promote sharing of medical records, and assign accountability for longitudinal management to specific clinical staff (Bradley et al. 2013a, 2013b, 2015).
A variety of hospital characteristics, patient clinical, and social (sociodemographic, socioeconomic, sociobehavioral and psychosocial, and community factors) characteristics have been associated with readmission. For example, the type of ownership, bed size, volume, teaching status, and staffing level of hospitals are significantly associated with readmissions (Krumholz et al. 2009; Joynt, Orav, and Jha 2011). Several studies have demonstrated that patients with cardiovascular conditions such as congestive heart failure and acute myocardial infarction, medical conditions such as pneumonia, as well as older patients are at high risk for readmission (Boult et al. 1993; Marcantonio et al. 1999; Philbin and DiSalvo 1999; Krumholz et al. 2000, 2008a, 2008b, 2008c; Silverstein et al. 2008; Krumholz et al. 2009; Amarasingham et al. 2010; Hammill et al. 2011; Krumholz et al. 2011; Lindenauer et al. 2011; Bradley et al. 2013b). Mental health comorbidities and substance use are also frequently associated with readmissions (Evans et al. 1988; Marcantonio et al. 1999; Billings et al. 2006; Billings and Mijanovich 2007; Howell et al. 2009). Other research has established the effects of patient‐level social determinants of health and sociodemographic factors on outcomes, including readmissions, with factors such as race/ethnicity, health literacy, marital status, education, income, and social support (Krumholz et al. 1997; Marcantonio et al. 1999; McGregor et al. 2006; Rathore et al. 2006; Bernheim et al. 2007; Roe‐Prior 2007; Arbaje et al. 2008; Amarasingham et al. 2010; Foraker et al. 2011; Joynt, Orav, and Jha 2011; Hawkins et al. 2012). Furthermore, several studies have focused on social determinants of health at the community level (Corrigan and Martin 1992; Tsuchihashi et al. 2001; Herrin et al. 2015).
While health systems attempting to reduce readmissions can find many model clinical programs to emulate (Coleman et al. 2004; Naylor et al. 2011), a more vexing problem has been tailoring scarce care management resources to needs of individual patients at high risk (Hong, Siegel, and Ferris 2014). Tailoring interventions requires accurately identifying and understanding patient characteristics, particularly those associated with poor outcomes. Directing programs specifically toward patients with social risk factors could be helpful in personalizing care management interventions and reducing readmissions (Calvillo‐King et al. 2013). These potential risk factors are disproportionately represented in high‐need populations, yet existing approaches to identifying these patients have provided limited discrimination (Kuper, Marmot, and Hemingway 2002; Marmot 2002, 2005; Wilkinson and Marmot 2003; Stansfeld 2006; Kansagara et al. 2011; Di Cesare et al. 2013). This is at least in part because detailed patient information on social risk factors is typically lacking in clinical databases and associated risk‐stratification tools that care managers and discharge planners use (Hu, Gonsahn, and Nerenz 2014). Thus, care managers are left to manual chart review, which is time‐consuming and subjective, and therefore not a feasible approach to screening large volumes of patients. Furthermore, efforts to access supplementary data on social factors drawn from sources like point‐of‐care survey instruments or large‐scale survey datasets are not readily automated or scalable (Kansagara et al. 2011; Calvillo‐King et al. 2013).
Further exacerbating the problem is that some social factors (such as housing stability and social support) are unreliably coded in billing data from insurance claims (Zeng and Bell 2011). These billing codes are frequently used to measure quality, compile registries of patients, and more recently for predictive modeling of high‐risk patients (Kansagara et al. 2011). Consequently, health systems may be targeting care management resources without accurately understanding the prevalence of these social factors or precisely identifying which individual patients experience them.
However, recent advances in natural language processing (NLP), a technology that enables automated extraction of information from clinical text, provides a rapid, scalable way to harness information from physician notes that health systems could not otherwise use for care management (Rosenbloom et al. 2011). Clinical narrative notes are likely to include valuable information as physicians frequently document salient observations and thought processes relevant to a patient's care and expected outcome (Häyrinen, Saranto, and Nykänen 2008; Rosenbloom et al. 2011). However, analyzing clinical text is not trivial and thus the potential for using a variety of social information in physician notes to identify high‐need patients has remained unexplored.
In this study, we examined whether using physician notes can improve the quality of patient‐specific information on social factors toward better identification of patients at risk for readmission. We sought to answer two questions: first, to what extent would the prevalence of seven selected common social characteristics (tobacco use, alcohol abuse, drug abuse, depression, housing instability, fall risk, and poor social support) increase when using information from physician narrative notes versus billing codes and structured EHR data? Second, will the social information about patients in physician narrative notes be associated with higher readmission risk, even after accounting for other social risk factors and detailed clinical data available in the medical record? We hypothesized that physicians would document significantly more information about these seven social factors in narrative notes than was available in billing codes, therefore indicating a higher prevalence than would be otherwise detected. Finally, we predicted that enhanced social factors based on physician notes would be significantly associated with readmission, even with more refined clinical risk adjustment. We examined the association and not a causal relationship between these factors and readmission.
Methods
Study Population and Data
We used EHR data and administrative claims, which included claims for commercial payers, Medicare, and Medicaid, from the Partners Healthcare System, a multihospital academic health system in Boston, MA, that includes two flagship academic medical centers. The EHR data included structured fields such as problem lists, medication lists, laboratory results, and health maintenance registries (e.g., smoking status). The EHR data also included unstructured text in physician notes.
We focused on patients with cardiovascular disease because of higher readmission rates, availability of evidence‐based care management approaches, and as social factors likely have a more consistent relationship within a disease group. We identified patients with cardiovascular disease through International Classification of Diseases, Ninth Revision, Clinical Modification [ICD‐9‐CM] codes (410.xx, 413.xx, 411.xx, 412.xx, 414.xx, 424.1, 427.3, 428.xx, 424.0, and 427.89) who were hospitalized from January 1, 2011, to December 31, 2013.
We excluded admissions primarily for treatment of psychiatric illness or obstetrics and gynecologic care, consistent with our focus on medical and surgical readmissions (CMS 2014a, 2014b). We also excluded patients with a primary diagnosis of cancer, hospice patients, and patients younger than 18 years. Our final sample included 49,319 unique patients who experienced 93,606 hospital admissions at one of five hospitals.
All‐Cause Thirty‐Day Readmission
We examined all‐cause unplanned readmissions, defined based on the CMS hospitalwide readmission rates (HWRRs) measure (CMS 2014a; Horwitz et al. 2014). We defined index admissions as an admission without transfer to another acute care facility or discharge against medical advice (CMS 2014a). We excluded planned readmissions for scheduled chemotherapy or procedures such as colonoscopy as designated by CMS (2014a, 2014b), Horwitz et al. (2014). In a sensitivity analysis, we restricted our sample to index admissions that were not readmissions themselves; this restriction is applied by CMS in determining readmissions for the HRRP but not in calculating HWRRs.
Conceptual Model—Social Factors and Readmission
We adapted a conceptual model developed by Calvillo‐King et al. (2013) that covers a broad range of social factors, including sociodemographic, socioeconomic, socioenvironmental, behavioral, sociocognitive, and neighborhood factors and their relationship with readmission. In particular, our focus in adapting this model was to guide selection of social factors to include in our analysis. Each factor in the Calvillo‐King et al. (2013) conceptual model has been demonstrated to be significantly associated with readmission (Krumholz et al. 1997; Marcantonio et al. 1999; Tsuchihashi et al. 2001; McGregor et al. 2006; Rathore et al. 2006; Bernheim et al. 2007; Roe‐Prior 2007; Arbaje et al. 2008; Amarasingham et al. 2010; Foraker et al. 2011; Joynt, Orav, and Jha 2011; Hawkins et al. 2012; Howie‐Esquivel and Spicer 2012). Following Calvillo‐King and colleagues, the social factors were stratified into three levels based on the likelihood of a direct causal link to postdischarge outcomes and ease of measurement. Level 1 factors included simple sociodemographic characteristics such as age, gender, and race or ethnicity. These data are frequently captured in administrative claims or the EHR. Level 2 factors included socioeconomic variables such as the education level, income, insurance status, marital status, and employment status of an individual patient, many of which rarely appear in claims or structured clinical data. The Level 3 factors related to underlying social environment (social support, housing situation), sociobehavioral (medications, diet, visit adherence, substance use/abuse, smoking, fall risk, psychiatric conditions), sociocognitive (health literacy, language proficiency), and community social factors (urban/rural, proximity to health care, community poverty).
Among this superset of factors, we selected a subset for inclusion in our analysis based on two criteria. First, we included any social factors that could be reliably identified in our hospital database, as these factors are generally present in data generated by hospitals during routine patient care. Second, we focused on drawing out factors from physician notes that showed variation in coding practices (e.g., factors that are often missing in ICD‐9 diagnosis codes). We hypothesized that these factors with additional information extracted from physician notes would be most likely to providing incremental information on readmission and therefore improve measurement of the association (O'Malley et al. 2005).
Based on our first criteria, we systematically selected the following available social factors: Level 1 factors: age and gender (from claims) and race or ethnicity (from the structured EHR) and Level 2 factors: insurance type (from claims) and marital status (from structured EHR). Level 3 factors were considered by subtype. For social environment, we included (poor) social support and housing instability. Sociobehavioral and psychosocial factors included substance abuse (alcohol and drugs) and smoking (tobacco use), fall risk, and diagnosis of depression. The sociocognitive factor language proficiency was included (primary spoken language) from the EHR. However, health literacy and community factors were not included because they did not appear in the hospital data.
Based on our second criteria, we further selected seven social factors to study using analysis of physician notes in addition to claims and EHR data: tobacco use, alcohol abuse, drug abuse, depression, housing instability, fall risk, and poor social support.
We also took a prevalence approach, including hospital discharge summaries for the 12 months preceding the index hospitalization to designate social factor presence, for all factors except substance abuse factors. For these, we required evidence of active use on an admission‐by‐admission basis.
Extracting Social Factors from Physician Notes
To extract social factor information from physician notes, we utilized MTERMS, an NLP system validated for identifying clinical terms within medical record text (Zhou et al. 2011). The protocols to accurately extract medications, clinical problems, allergies, and symptoms from clinical text have been published previously, and our methodological approach to customizing MTERMS for social factor identification is presented separately (Zhou et al. 2012; Goss et al. 2014; Zhou et al. 2014, 2015; Plasek et al. 2016). We have utilized the tool to identify hospitalized patients at high risk for depression, with high levels of predictive accuracy, precision, and recall as compared with gold standard manual chart review by physician mental health experts (Zhou et al. 2015). The lexicon of terms, methodology diagram, and temporal reasoning we utilized as well as validation statistics are presented in the Supplement (“List of Clinical Variables Used in Detailed Risk Adjustment,” “MTERMS NLP Diagnostic Characteristics in the Identification of SocioBehavioral Factors,” and Tables S1 and S2 in Appendix SA2). The trained MTERMS tool provided excellent overall accuracy in detecting the presence of the seven social factors, which enabled comparative use of the information in the physician narrative notes versus administrative and EHR data elements. In Tables S3 and S4 in Appendix SA2, we show the social factors, associated ICD‐9 codes, and associated terms in the structured EHR data.
Risk Adjustment
We utilized the presence of 29 Elixhauser comorbidities, using a 12‐month look back, as our primary risk‐adjustment approach with a sensitivity analysis replicating the CMS method using condition indicators in HWRR computations (CMS 2014a). Per CMS specifications, we limited our analysis to those conditions present on admission, to avoid confounding of conditions acquired as result of hospital care itself (CMS 2014a). We started with this baseline approach because as in HRRP condition‐specific readmission rates, publicly reported HWRRs are also adjusted for age, gender, discharge diagnosis, and diagnoses present in claims during the 12 months prior to admission (Centers 2014a; Guihan et al. 2008). Additional patient‐level variables available in the administrative claims including number of admissions in the past 12 months, discharge disposition, length of stay, and type of insurance were added to the model as in prior studies evaluating the impact of social factors using administrative data (Cohen and Demner‐Fushman 2014).
The availability of structured EHR data beyond the physician narrative notes enabled more extensive controls for patient clinical variables. We selected clinical variables including laboratory tests and high‐risk medications validated for risk adjustment in cardiovascular disease using EHR data (Vinson et al. 1990; Corti et al. 1995; Fried et al. 1998; Caggiano et al. 2005; Manoukian et al. 2007; Nordestgaard et al. 2007; Tabak, Johannes, and Silber 2007; Anchersen et al. 2009; Tzoulaki et al. 2009; Gamble et al. 2010; Solomon et al. 2010; Allaudeen et al. 2011; Donzé et al. 2013).
Statistical Analysis
In unadjusted analysis, we compared the characteristics of patients who experienced a 30‐day readmission versus patients not readmitted using Wilcoxon tests for continuous variables and chi‐square tests for categorical variables (Table 1). Our next step was to evaluate the prevalence of the seven social factors when adding information from physician notes in comparison with billing codes and structured EHR data. To do so, we created bivariate logistic regression models to evaluate the relative frequency, unadjusted readmission rates, and unadjusted odds of readmission for patients with the seven social factors, identified through billing codes with and without structured EHR data versus physician notes, as well as for the combined sources (Table 2). We plotted the incremental number of admitted patients identified through the physician notes for each social factor by data source (Figure 1).
Table 1.
Characteristics of the Sample by Readmission Status
| Characteristics | Total Number of Hospital Admissions N = 93,606 (%) | p Value | |
|---|---|---|---|
| Not Readmitted N = 76,660 (82%) | Readmitted N = 16,946 (18%) | ||
| Age, years | |||
| 18–39 | 3,678 (5) | 1,328 (8) | <.001 |
| 40–54 | 9,155 (12) | 2,286 (13) | |
| 55–64 | 13,800 (18) | 3,367 (20) | |
| 65–74 | 19,347 (25) | 4,163 (25) | |
| 75–80 | 18,436 (24) | 3,515 (21) | |
| >80 | 12,244 (16) | 2,287 (14) | |
| Sex | |||
| Female | 32,775 (43) | 7,456 (44) | <.001 |
| Race/ethnicity | |||
| Asian | 1,552 (2) | 379 (2) | <.001 |
| Black | 5,335 (7) | 1,575 (9) | |
| Hispanic | 4,025 (5) | 1,023 (6) | |
| White | 61,881 (81) | 13,260 (78) | |
| Other/unknown | 3,867 (5) | 709 (4) | |
| Marital status | |||
| Currently single | 38,036 (50) | 9,040 (53) | <.001 |
| Married or domestic partner | 38,624 (50) | 7,906 (47) | |
| Insurance/payor category | |||
| Medicare | 48,362 (63) | 10,792 (64) | <.001 |
| Medicaid | 4,246 (6) | 1,283 (8) | |
| Commercial | 15,647 (20) | 2,978 (18) | |
| Most frequent Elixhauser comorbidities | |||
| Fluid and electrolytes | 30,582 (40) | 11,830 (70) | <.001 |
| Cardiac arrhythmias | 45,557 (59) | 12,811 (76) | |
| Hypertension | 54,849 (72) | 13,389 (79) | |
| Elixhauser comorbidities with largest differences | |||
| Congestive heart failure | 31,716 (41) | 9,130 (54) | <.001 |
| Cardiac arrhythmias | 45,557 (59) | 12,811 (76) | |
| Hypertension | 54,849 (72) | 13,389 (79) | |
| Discharge dispositions | |||
| Home | 12,158 (16) | 1,853 (11) | <.001 |
| Home care | 10,885 (14) | 2,992 (18) | |
| Post‐acute care facilities | 7,488 (10) | 2,141 (13) | |
| Hospital transfer | 2 (0) | 2 (0) | |
| Missing | 46,117 (60) | 9,958 (59) | |
| Use of agent | |||
| Antithrombotic | 3,914 (5) | 1,148 (7) | <.001 |
| Chemotherapeutic | 92 (0) | 75 (0) | |
| Hypoglycemics | 2,807 (4) | 970 (6) | |
| Insulins | 1,583 (2) | 632 (4) | |
| Narcotic opioids | 4,997 (7) | 1,744 (10) | |
| Abnormal laboratory value | |||
| LDL | 3,460 (5) | 958 (6) | .0014 |
| HDL | 12,871 (17) | 3,505 (21) | |
| LDH | 6,733 (9) | 3,222 (19) | |
| B‐type natriuretic | 16,905 (22) | 6,082 (36) | <.001 |
| A1c | 3,197 (4) | 1,030 (6) | |
| Troponin† | 17,441 (23) | 5,697 (34) | |
| Medication count | |||
| 1–5 | 1,798 (2) | 355 (2) | <.001 |
| 6–10 | 3,758 (5) | 429 (3) | |
| 11–20 | 19,098 (25) | 3,580 (21) | |
| >20 | 52,006 (68) | 12,582 (74) | |
| Length of stay | |||
| 0–3 | 30,123 (39) | 5,280 (31) | <.001 |
| 4–5 | 15,880 (21) | 3,708 (22) | |
| 6+ | 30,657 (40) | 7,958 (50) | |
| Number of admissions in the past year | |||
| 0 | 48,171 (63) | 250 (1) | <.001 |
| 1 | 5,502 (7) | 205 (1) | |
| 2–3 | 17,386 (23) | 10,328 (61) | |
| 4+ | 5,601 (7) | 6,163 (36) | |
†Troponin refers to both the Troponin T and Troponin I assays depending on admitting hospital laboratory use.
HDL, high‐density lipoprotein; HgbA1c, hemoglobin A1c; LDH, lactate dehydrogenase; LDL, low‐density lipoprotein.
Table 2.
Unadjusted Frequency of Social Factors and Association with Readmission by Data Source Used in Identification (N = 93,606 Admissions)
| Characteristic | ICD‐9 Diagnoses | ICD‐9 Plus Structured EHR† Data | Physician Notes | All Sources (ICD‐9 + EHR† data + Physician Notes)‡ | ||||||||
|---|---|---|---|---|---|---|---|---|---|---|---|---|
| No. of Patients (%) | Readmission Rate, % | Odds Ratio (95% CI)§ | No. of Patients (%) | Readmission Rate, % | Odds Ratio (95% CI)§ | No. of Patients (%) | Readmission Rate, % | Odds Ratio (95% CI)§ | No. of Patients (%) | Readmission Rate, % | Odds Ratio (95% CI)§ | |
| Tobacco Use | 11,359 (12) | 20.8 | 1.37* (1.32, 1.41) | 13,791 (15) | 20.3 | 1.33* (1.27, 1.39) | 23,727 (25) | 21.9 | 1.466* (1.41,1.52) | 27,763 (30) | 21.0 | 1.39* (1.34,1.44) |
| Alcohol Abuse | 6,899 (7) | 20.4 | 1.34* (1.26, 1.42) | 7,461 (8) | 20.2 | 1.317* (1.24, 1.40) | 8,790 (9) | 20.9 | 1.377* (1.31, 1.45) | 11,070 (12) | 20.0 | 1.30* (1.24 1.37) |
| Drug Abuse | 5,952 (6) | 25.3 | 1.77* (1.67, 1.88) | 6,042 (6) | 24.3 | 1.67* (1.67, 1.88) | 8,959 (10) | 25.4 | 1.78* (1.69, 1.87) | 11,272 (12) | 25.6 | 1.79* (1.71, 1.87) |
| Depression | 18,615 (20) | 24.0 | 1.65* (1.58, 1.71) | 20,469 (22) | 23.6 | 1.61* (1.55, 1.67) | 20,358 (22) | 24.5 | 1.69* (1.62, 1.76) | 26,904 (29) | 23.9 | 1.64* (1.59, 1.70) |
| Housing Instability | 1,298 (1) | 29.9 | 2.22* (1.97, 2.49) | 1,309 (1) | 29.9 | 2.22* (1.98, 2.50) | 763 (1) | 34.0 | 2.69* (2.32, 3.12) | 1,551 (2) | 29.4 | 2.17* (1.95, 2.42) |
| Fall Risk | 2,209 (2) | 18.3 | 1.17** (1.06, 1.30) | 2,302 (2) | 18.7 | 1.20* (1.08, 1.32) | 23,737 (25) | 21.8 | 1.45* (1.40, 1.50) | 24,261 (26) | 21.6 | 1.44* (1.39, 1.50) |
| Poor Social Support | 342 (0) | 14.2 | 0.86 (0.64, 1.14) | 342 (0) | 14.0 | 0.85 (0.64, 1.14) | 14,872 (16) | 21.3 | 1.41* (1.36, 1.48) | 15,004 (16) | 21.3 | 1.41* (1.35, 1.47) |
*p < .001, **p < .01.
†EHR refers specifically to problem lists (diagnoses) and health maintenance registries in the EHR.
‡All sources include patients identified through ICD‐9 diagnoses, problem lists and health maintenance registries in the EHR, and text analysis of physician discharge summary notes.
§Unadjusted OR and 95% confidence intervals (CIs) were computed from series of logistic regressions of a readmission indicator on an indicator variable for a patient social factor that was determined based on a data source. Each social factor and data source represents one unadjusted logistic model.
Figure 1.
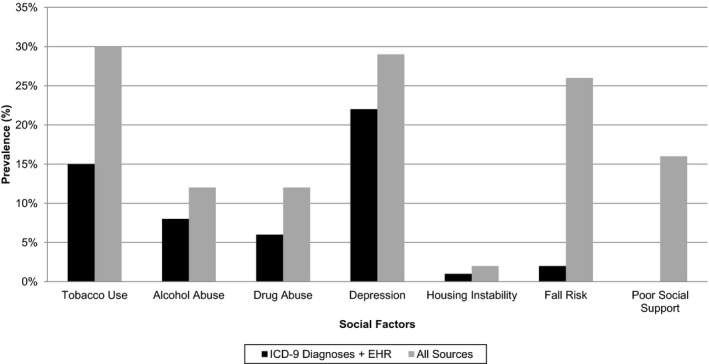
-
1Notes: The black bars indicate the prevalence in the sample for each social factor in ICD‐9 codes plus structured EHR, and the gray bars indicate the prevalence when using all sources including physician notes.
For our primary outcome, risk‐adjusted 30‐day all‐cause, unplanned readmission rates, we created multivariable logistic regression models evaluating the association with the seven social factors simultaneously (Unadjusted). All models included hospital fixed effects to account for hospital‐specific differences that could impact readmissions. These factors were relevant because of baseline differences in the hospitals in the sample, two were academic medical centers while others were geographically distinct community hospitals, and fixed effects mitigated differences attributable to hospital rather than patient factors.
To examine the robustness of the association between readmissions and the social factors to increasing levels of risk adjustment, we created adjusted models by incrementally adding variables for risk adjustment (Table 3). First, we added controls for age, gender, discharge diagnosis, and Elixhauser comorbidities or condition indicators per CMS specifications in the HRRP model (Model 1) to the unadjusted model (Elixhauser et al. 1998; CMS 2014b). Second, we added readily available administrative data on sociodemographic factors and utilization, including the following administrative data elements: insurance type, number of hospital admissions in the past 12 months, discharge disposition, and length of stay (Model 2). Third, we added social factor data only available in the EHR: patient race, primary spoken language, marital status, and veteran status (Model 3). Finally, we added extensive risk adjustment made possible by the EHR data (Model 4). Model 4 evaluated the association between readmission and the seven social factors identified through all data sources together with detailed clinical risk adjustment.
Table 3.
Risk‐Adjusted Association between Social Factors and Readmission
| Model | Model Description | Tobacco Use | Alcohol Abuse | Drug Abuse | Depression | Housing Instability | Fall Risk | Poor Social Support | C‐Statistic | |||||||
|---|---|---|---|---|---|---|---|---|---|---|---|---|---|---|---|---|
| RR% | OR (95% CI) | RR% | OR (95% CI) | RR% | OR (95% CI) | RR% | OR (95% CI) | RR% | OR (95% CI) | RR% | OR (95% CI) | RR% | OR (95% CI) | |||
| Unadjusted | seven social variables | 20.9 | 1.16* (1.10, 1.22) | 17.6 | 0.93 (0.86, 1.01) | 24.4 | 1.41* (1.31, 1.52) | 24.7 | 1.43* (1.35, 1.53) | 24.6 | 1.43* (1.19, 1.71) | 22.6 | 1.28* (1.21, 1.33) | 21.9 | 1.22* (1.15, 1.30) | 0.59 |
| Model 1 | Baseline CMS Model plus seven social variables | 19.8 | 1.08** (1.03, 1.14) | 17.9 | 0.95 (0.87, 1.05) | 22.2 | 1.25* (1.15, 1.36) | 21.4 | 1.19* (1.11, 1.27) | 25.7 | 1.52* (1.25, 1.84) | 20.2 | 1.11* (1.06, 1.17) | 20.6 | 1.13* (1.07, 1.20) | 0.65 |
| Model 2 | Baseline CMS Model plus seven social variables plus socioeconomic variables available in administrative data | 19.1 | 1.03 (0.99, 1.08) | 18.5 | 0.99 (0.91, 1.08) | 20.4 | 1.12*** (1.03, 1.21) | 20.8 | 1.15* (1.07, 1.22) | 23.4 | 1.33** (1.14, 1.57) | 19.2 | 1.04 (1.00, 1.09) | 19.9 | 1.09** (1.03, 1.15) | 0.67 |
| Model 3 | Model 2 plus socioeconomic variables available in structured EHR data | 19.1 | 1.04 (0.99, 1.08) | 18.5 | 0.99 (0.91, 1.08) | 20.4 | 1.12*** (1.04, 1.21) | 20.9 | 1.15* (1.08, 1.23) | 23.6 | 1.35** (1.15, 1.58) | 19.3 | 1.04 (1.00, 1.09) | 20.0 | 1.09** (1.03, 1.16) | 0.68 |
| Model 4 | Model 3 plus detailed risk adjustment with clinical data | 19.2 | 1.04 (1.00, 1.08) | 18.1 | 0.97 (0.89, 1.05) | 20.2 | 1.10*** (1.03, 1.18) | 20.6 | 1.14* (1.07, 1.20) | 24.5 | 1.42* (1.25, 1.61) | 19.1 | 1.03 (0.99, 1.08) | 20.0 | 1.10*** (1.04, 1.15) | 0.69 |
*p =< .001, **p =< 0.01, ***p =< 0.05.
RR %, readmission rate %.
Our final step was to examine the incremental impact of physician notes and structured EHR data beyond claims alone on the association between the social factors and readmission. Accordingly, we examined the changes in the risk‐adjusted association between 30‐day readmission and the social factors as additional information from ICD‐9 diagnosis codes, EHR data (i.e., problem list and health maintenance registries), and physician notes was incorporated on the detailed risk‐adjustment model (i.e., Model 4 from above; Table 4).
Table 4.
Association between Social Factors and Readmission after Detailed Risk Adjustment†
| Characteristic | ICD‐9 Diagnoses | ICD‐9 Diagnoses + EHR‡ | All Sources (ICD‐9 Diagnoses + EHR† + Physician Notes)§ | ||||||
|---|---|---|---|---|---|---|---|---|---|
| No. of Patients (%) | Readmission Rate, % | Odds Ratio (95% CI) | No. of Patients (%) | Readmission Rate, % | Odds Ratio (95% CI) | No. of Patients (%) | Readmission Rate, % | Odds Ratio (95% CI) | |
| Tobacco use | 11,359 (12) | 19.1 | 1.03 (0.98, 1.09) | 13,791 (15) | 18.7 | 1.01 (0.96, 1.06) | 27,763 (30) | 19.2 | 1.04 (1.00, 1.08) |
| Alcohol abuse | 6,899 (7) | 18.5 | 0.99 (0.75, 1.31) | 7,461 (8) | 18.2 | 0.97 (0.82, 1.16) | 11,272 (12) | 18.1 | 0.97 (0.89, 1.05) |
| Drug abuse | 5,952 (6) | 20.7 | 1.14 (0.88, 1.49) | 6,042 (6) | 20.6 | 1.14 (0.90, 1.44) | 11,070 (12) | 20.2 | 1.10¶ (1.03, 1.18) |
| Depression | 18,615 (20) | 25.4 | 1.49* (1.24, 1.79) | 20,469 (22) | 21.5 | 1.20* (1.08, 1.33) | 26,904 (29) | 20.6 | 1.14¶ (1.07, 1.20) |
| Housing instability | 1,298 (1) | 25.6 | 1.50* (1.31, 1.72) | 1,309 (1) | 25.7 | 1.51* (1.32, 1.73) | 1,551 (2) | 24.5 | 1.42¶ (1.25, 1.61) |
| Fall risk | 2,209 (2) | 17.6 | 0.94 (0.84, 1.05) | 2,302 (2) | 17.9 | 0.96 (0.86, 1.07) | 24,261 (29) | 19.1 | 1.03 (0.99, 1.08) |
| Poor social support | 342 (0) | 13.4 | 0.68* (0.50, 0.93) | 342 (0) | 13.5 | 0.68 (0.50, 0.93) | 15,004 (16) | 20.0 | 1.10¶ (1.04, 1.15) |
| C‐statistic | 0.68 | 0.68 | 0.69 | ||||||
*p =< .05.
†Each column represents a logistic regression of a readmission indicator on a patient‐level variable indicating presence of the social factor based on ICD‐9 diagnosis codes, ICD‐9 diagnosis codes plus diagnoses in the EHR, or all sources including clinical text analysis of the physician notes. Each column model includes controls for age, sex, discharge disposition, and Elixhauser comorbidity diagnoses represented within the 12 months prior to admission, insurance type, number of hospital admissions in the past 12 months, discharge disposition, length of stay, patient race, primary spoken language, marital status, and veteran status, HDL, LDL, LDH, Triglycerides, B Natriuretic Peptide, Hemoglobin A1c, Troponin, PT‐INR, Glucose, WBC, BUN, Sodium, Creatinine, Bilirubin, Albumin, use of an antithrombotic agent, chemotherapeutic agent, hypoglycemic agent, insulin, or narcotic opioid agent.
‡EHR refers specifically to problem lists (diagnoses) and health maintenance registries in the EHR.
§All sources include patients identified through ICD‐9 diagnoses, problem lists and health maintenance registries in the EHR, and text analysis of physician notes.
¶We used the Holm–Bonferroni correction to determine significance.
Because our primary purpose was to investigate the relationship between the seven social factors and readmissions with detailed clinical risk adjustment, we accounted for multiple testing in evaluating this relationship using the Holm–Bonferroni correction in our final models (Herv'e 2010).
Sensitivity Analysis
We performed several sensitivity analyses on the final model. First, we excluded index admissions that were also readmissions as in the more stringent definition used by CMS in the HRRP (Krumholz et al. 2011; CMS 2014a). Second, we tested the analysis while including patients with a diagnosis of cancer in the sample. Third, we added primary diagnosis codes based on single‐level clinical classifications software (CCS) from the AHRQ (HCUP CCS 2016). Attempts to include multilevel CCS codes resulted in nonconvergence of the models. Finally, instead of using hospital fixed effects, we tested standard errors clustered at the hospital level.
The Partners Institutional Review Board approved all aspects of this study. In all analyses, we used Huber–White robust standard errors to account for heteroscedasticity and clustering at the patient level. All analyses were performed with SAS 9.2 (SAS Institute, Cary, North Carolina, USA).
Results
Patient Characteristics
Of the 93,606 index hospitalizations across 49,319 unique patients, 16,946 (18.1 percent) resulted in a readmission while 76,660 (81.9 percent) did not (Table 1). As compared with patients not readmitted, readmitted patients tended to be slightly younger (mean age 66.3 years vs. 69.0 years), marginally more likely to be female (44 vs. 43 percent), and more likely to be black (9 vs. 7 percent) or Hispanic (6 vs. 5 percent).
Frequency of Social Factors and Individual Associations
Table 2 demonstrates that the frequency increased for six of seven social characteristics (except housing instability) when using physician note analysis versus ICD‐9 codes or ICD‐9 codes plus structured EHR data, and all seven characteristics when combining sources (ICD‐9 codes, structured EHR data, and physician notes). The physician notes identified 23,727 patient admissions with tobacco use (resulting overall frequency of 30 versus 15 percent using ICD‐9 codes and structured EHR), 8,790 patient admissions with alcohol abuse (12 vs. 8 percent), 8,959 patient admissions with drug abuse (12 vs. 6 percent), 20,358 patient admissions with depression (29 vs. 22 percent), 763 patient admissions with housing instability (2 vs. 1 percent), 23,737 patient admissions with fall risk (26 vs. 2 percent), and 14,872 patient admissions with poor social support (16 vs. <1 percent). The incremental increase in prevalence for each social factor is shown in Figure 1. The largest increases were a 24 percentage point jump in prevalence for fall risk, a 16 percentage point increase for poor social support, and a 15 percentage point gain for tobacco use.
The unadjusted readmission rates in bivariate models were largely similar among patients detected when adding physician notes versus ICD‐9 diagnoses with and without structured EHR data, with the largest difference in poor social support (21.3 percent readmission rate in physician notes vs. 14.0 percent in ICD‐9 diagnoses and structured EHR).
Social Factors and Readmission Risk
Unadjusted analyses examining the seven social factors simultaneously demonstrated a significantly increased likelihood of readmission for each factor except alcohol abuse (Table 3). The adjusted analysis demonstrated an increased readmission risk for patients with tobacco use (OR 1.08; 95 percent CI 1.03–1.13; p = .004), drug abuse (OR 1.25; 95 percent CI 1.15–1.36; p < .001), depression (OR 1.19; 95 percent CI 1.11–1.27; p < .001), housing instability (OR 1.52; 95 percent CI 1.25–1.84; p < .001), fall risk (OR 1.11; 95 percent CI 1.06–1.17; p < .001), and poor social support (OR 1.13; 95 percent CI 1.07–1.20; p < .001) when added to the Baseline CMS Model (Model 1). Models 2–4 show the effects of successively including additional patient characteristics to the unadjusted model, with all seven social factors included simultaneously, on the association between the social factors and readmission. The effects were robust to adding socioeconomic variables that were readily available in the administrative data (Model 2) and EHR data (Model 3) for drug abuse, depression, housing instability, and poor social support, although effect sizes did decrease with the added data elements. In the combined adjusted analysis with extensive risk adjustment including laboratory test results and high‐risk medication use (Model 4), we found that four factors were significantly associated with increased readmission risk: housing instability (OR 1.42; 95 percent CI 1.25–1.61; p < .001), followed by depression (OR 1.14; 95 percent CI 1.07–1.20; p < .001), drug use (OR 1.10; 95 percent CI 1.03–1.18; p = .05), and poor social support (OR 1.10; 95 percent CI 1.04–1.15; p < .001).
Social Factors and Readmission Risk by Data Source
The final set of models evaluated the relationship between readmission and the seven social factors based on the data source from which they were identified (Table 4). First, patients with social factors were identified through ICD‐9 codes alone, then based on added structured data from the EHR, and finally when also adding in the large number of patients identified through the clinical text analysis. When using ICD‐9 codes alone, the three statistically significant factors were depression (OR 1.49; 95 percent CI 1.24–1.79; p < .001), housing instability (OR 1.50; 95 percent CI 1.31–1.72; p < .001), and poor social support (OR 0.68, 95 percent CI 0.50–0.93; p = .01). After adding patients incrementally identified as having social factors in the structured EHR data, the association for depression got smaller (OR 1.20; 95 percent CI 1.08–1.33; p < .001) while housing instability and poor social support remained constant. However, when further adding patients with social factors incrementally identified through physician notes, the number of significant factors increased from three to four. In addition to depression (OR 1.14; 95 percent CI 1.07–1.20; p < .001) and housing instability (OR 1.42; 95 percent CI 1.25–1.61; p < .001), drug use (OR 1.10; 95 percent CI 1.03–1.18; p = .05) became significant. Further, poor social support changed from being associated with decreased readmission risk when using ICD‐9 codes alone (OR 0.68, 95 percent CI 0.50–0.93; p < .001) or ICD‐9 codes and structured EHR data (OR 0.68, 95 percent CI 0.50–0.93; p = .02) to increased readmission risk when patients identified through physician notes (OR 1.10; 95 percent CI 1.04–1.15; p < .001) were included. Model discrimination improved marginally and was not statistically significant.
In sensitivity analyses, we found no changes in effect sizes or statistical significance when we excluded index admissions that were also readmissions, although because of the drop in sample size the 95 percent CI confidence intervals did get larger. Adding patients with cancer to the sample resulted in stronger effects for all social characteristics except housing instability, for which the OR dropped from 1.42 to 1.29 (95 percent CI CI 1.16–1.44, p < .001), although still significant. Changing risk‐adjustment approaches, adding primary diagnoses, using randomly selected single admissions per patient, and clustering at patient–hospital level did not change the results meaningfully.
Discussion
Using comprehensive claims and EHR data from a large multihospital academic health system, we found that patients with social risk factors detected through physician notes are substantially more prevalent than currently identified through ICD‐9 billing codes alone. Furthermore, the incrementally identified patients were at high readmission risk and enabled better detection of readmitted patients. While these results suggest that using information from physician notes may also lead to better performance of predictive models, this step remains to be studied in further work.
The magnitude of the increase in frequency of the social characteristics when information from clinical text was used was unexpected and striking. The large proportions of patients (an additional 24 percent of the entire study population was identified as being at risk for falls and an additional 16 percent as experiencing poor social support) indicate that these social issues may be more prevalent than hospitals are able to detect through analysis of problem lists and ICD‐9 codes. Furthermore, depression and substance abuse, frequently coded as diagnoses in billing codes, were also highly underrepresented versus physician narrative assessments, suggesting that physicians and hospitals may be leaving available reimbursement dollars unearned.
The magnitude and direction of the associations we found are consistent with several studies that have considered the impact of various social factors using more representative, nonclinical data, while controlling for demographic variables, including Medicaid insurance (Elixhauser et al. 1998; Philbin and DiSalvo 1999), unmarried status (Roe‐Prior 2007; Tabak, Johannes, and Silber 2007), low socioeconomic status (Philbin et al. 2001; Tsuchihashi et al. 2001; Rathore et al. 2006), tobacco use (Philbin and DiSalvo 1999), and drug use (Amarasingham et al. 2010). Comorbid mood disorder, particularly depression, has been borderline (Philbin et al. 2001; Roe‐Prior 2007) or not associated (Philbin et al. 1998; Rathore et al. 2006), although in our study, we found a significant positive effect. Our findings are also similar to one study on social support in heart failure patients (Tsuchihashi et al. 2001), and another study that uses an alternate definition of housing instability through home address changes (Amarasingham et al. 2010). To our knowledge, only one other study utilized electronic health records in an automated fashion to study readmissions, but it did not use social information from physician notes (Amarasingham et al. 2010).
Our study is differentiated because it relies exclusively on data available to hospitals. Secondly, given our use of physician notes in the EHR, we are able to compute a more comprehensive estimated prevalence of the social factors that was higher than that apparent through billing codes. This gives a more complete representation of a health system's patient population characteristics, as assessed and documented by physicians. While using clinical text has been validated by our team and others for identifying depression (Watson et al. 2011; Perlis et al. 2012; Zhou et al. 2015), and for homelessness within Veterans Affairs (Gundlapalli et al. 2013), it has not been used systematically to identify a comprehensive set of social factors, nor in studying how these factors are associated with readmissions, to our knowledge.
Our study has limitations beyond those listed above. As noted before, we estimate the association between social factors and readmission, not the causal relationship. While we found significantly higher prevalence of selected social characteristics with higher readmission risk, model discrimination did not improve significantly and results should not be construed as better predictive model performance. However, our results suggest the potential value of information in physician notes and training models to maximize discrimination and testing with methods such as reclassification is a natural next step. Next, we were unable to account for readmissions to other hospitals because of single‐institution data. However, we accept this trade‐off methodologically because single institutions readily have access to their own data in real time. Another concern is that physician documentation in narrative notes at one health system may not be representative of others. Finally, our study is within a single multihospital geographically localized institution, so our results may not be generalizable.
In the era of expanding accountable care, understanding patient characteristics and tailoring population management programs to patient needs is critical. The importance of social characteristics in influencing outcomes such as readmission rates is well established (Calvillo‐King et al. 2013). A more comprehensive and accurate understanding of which patients experience social circumstances could greatly aid in developing and targeting customized care management and support services to reduce risk (Akosah et al. 2005), as has been shown in select cases for cardiac care. Until recently, analyzing medical record data including physician assessments was a manual, time‐consuming, and poorly replicable task. Our study results from a single health system, while not necessarily generalizable across the nation, show that a health system may use its own data in an automated and reliable fashion to direct care management activities. While the mechanism between social characteristics and readmission is undoubtedly very complex, better understanding and more effectively targeted services may each constitute a small advance toward reducing disparities and improving patient outcomes.
Supporting information
Appendix SA1: Author Matrix.
Appendix SA2:
Table S1: MTERMS NLP Performance in the Identification of Social Factors – Derivation Set (n = 500).
Table S2: MTERMS NLP Performance in the Identification of Social Factors – Validation Set (n = 600).
Table S3: ICD‐9 Codes for Each Social Factor.
Table S4: Lexicon of Terms Used to Identify Each Social Factor in the Clinical Text of the Physician Note.
Table S5: Risk‐Adjusted Association between Social Factors Detected in Physician Notes and Readmission.
Table S6: Unrestricted NLP Set: Unadjusted Frequency of Social Factors and Association with Readmission by Data Source Used in Identification (N = 93,606 Admissions).
Table S7: Unrestricted NLP Set: Risk‐Adjusted Association between Social Factors and Readmission.
Table S8: Unrestricted NLP Set: Association between Social Factors and Readmission after Detailed Risk Adjustment.
Figure S1: Methods Overview of NLP Approach to Identification of Social Factors.
Figure S2: NLP Social Factor Identification Algorithm.
Acknowledgments
Joint Acknowledgement/Disclosure Statement: This project was funded by the Partners Siemens Research Council, which had no role in the design and conduct of the study; collection, management, analysis, and interpretation of the data; preparation, review, or approval of the manuscript; or decision to submit the manuscript for publication. Dr. Navathe serves as advisor to Navvis and Company Navigant Inc., Lynx Medical, Indegene Inc., and Sutherland Global Services and receives an honorarium from Elsevier Press, which have no relationship with this study. The other authors have no potential conflicts of interest to disclose.
Disclosures: None.
Disclaimer: None.
References
- Akosah, K. O. , Schaper A. M., Haus L. M., Mathiason M. A., Barnhart S. I., and McHugh V. L.. 2005. “Improving Outcomes in Heart Failure in the Community: Long‐Term Survival Benefit of a Disease‐Management Program.” Chest 127 (6): 2042–8. [DOI] [PubMed] [Google Scholar]
- Allaudeen, N. , Vidyarthi A., Maselli J., and Auerbach A.. 2011. “Redefining Readmission Risk Factors for General Medicine Patients.” Journal of Hospital Medicine 6 (2): 54–60. [DOI] [PubMed] [Google Scholar]
- Amarasingham, R. , Moore B. J., Tabak Y. P., Drazner M. H., Clark C. A., Zhang S., Reed W. G., Swanson T. S., Ma Y., and Halm E. A.. 2010. “An Automated Model to Identify Heart Failure Patients at Risk for 30‐Day Readmission or Death Using Electronic Medical Record Data.” Medical Care 48 (11): 981–8. [DOI] [PubMed] [Google Scholar]
- Anchersen, K. , Clausen T., Gossop M., Hansteen V., and Waal H.. 2009. “Prevalence and Clinical Relevance of Corrected QT Interval Prolongation during Methadone and Buprenorphine Treatment: A Mortality Assessment Study.” Addiction 104 (6): 993–9. [DOI] [PubMed] [Google Scholar]
- Arbaje, A. I. , Wolff J. L., Yu Q., Powe N. R., Anderson G. F., and Boult C.. 2008. “Postdischarge Environmental and Socioeconomic Factors and the Likelihood of Early Hospital Readmission among Community‐Dwelling Medicare Beneficiaries.” Gerontologist 48 (4): 495–504. [DOI] [PubMed] [Google Scholar]
- Barnett, M. L. , Hsu J., and McWilliams J. M.. 2015. “Patient Characteristics and Differences in Hospital Readmission Rates.” Journal of American Medical Association Internal Medicine 175 (11): 1803–12. [DOI] [PMC free article] [PubMed] [Google Scholar]
- Bernheim, S. M. , Spertus J. A., Reid K. J., Bradley E. H., Desai R. A., Peterson E. D., Rathore S. S., Normand S. L., Jones P. G., Rahimi A., and Krumholz H. M.. 2007. “Socioeconomic Disparities in Outcomes After Acute Myocardial Infarction.” American Heart Journal 153 (2): 313–9. [DOI] [PubMed] [Google Scholar]
- Billings, J. , and Mijanovich T.. 2007. “Improving the Management of Care for High‐Cost Medicaid Patients.” Health Affairs (Millwood) 26 (6): 1643–54. [DOI] [PubMed] [Google Scholar]
- Billings, J. , Dixon J., Mijanovich T., and Wennberg D.. 2006. “Case Finding for Patients at Risk of Readmission to Hospital: Development of Algorithm to Identify High Risk Patients.” British Medical Journal 333 (7563): 327. [DOI] [PMC free article] [PubMed] [Google Scholar]
- Boult, C. , Dowd B., McCaffrey D., Boult L., Hernandez R., and Krulewitch H.. 1993. “Screening Elders for Risk of Hospital Admission.” Journal American Geriatric Society 41 (8): 811–7. [DOI] [PubMed] [Google Scholar]
- Bradley, E. H. , Sipsma H., Curry L., Mehrotra D., Horwitz L. I., and Krumholz H.. 2013a. “Quality Collaboratives and Campaigns to Reduce Readmissions: What Strategies Are Hospitals Using?” Journal of Hospital Medicine 8 (11): 601–8. [DOI] [PMC free article] [PubMed] [Google Scholar]
- Bradley, E. H. , Curry L., Horwitz L., Sipsma H., Wang Y., Walsh M. N., Goldmann D., White N., Piña I., and Krumholz H. M.. 2013b. “Hospital Strategies Associated With 30‐Day Readmission Rates for Patients with Heart Failure.” Circulation: Cardiovascular Quality and Outcomes 6: 444–50. [DOI] [PMC free article] [PubMed] [Google Scholar]
- Bradley, E. H. , Sipsma H., Horwitz L. I., Ndumele C. D., Brewster A. L., Curry L. A., and Krumholz H. M.. 2015. “Hospital Strategy Uptake and Reductions in Unplanned Readmission Rates for Patients with Heart Failure: A Prospective Study.” Journal of General Internal Medicine 30 (5): 605–11. [DOI] [PMC free article] [PubMed] [Google Scholar]
- Caggiano, V. , Weiss R. V., Rickert T. S., and Linde‐Zwirble W. T.. 2005. “Incidence, Cost, and Mortality of Neutropenia Hospitalization Associated with Chemotherapy.” Cancer 103 (9): 1916–24. [DOI] [PubMed] [Google Scholar]
- Calvillo‐King, L. , Arnold D., Eubank K. J., Lo M., Yunyongying P., Stieglitz H., and Halm E. A.. 2013. “Impact of Social Factors on Risk of Readmission or Mortality in Pneumonia and Heart Failure: Systematic Review.” Journal of General Internal Medicine 28 (2): 269–82. [DOI] [PMC free article] [PubMed] [Google Scholar]
- Centers for Medicaid and Medicare Services (CMS ). 2014a. “2014 Measure Updates and Specifications Report Hospital‐Wide All‐Cause Unplanned Readmission – Version 3.0” [accessed on January 28, 2016]. Available at http://altarum.org/sites/default/files/uploaded-publication-files/Rdmsn_Msr_Updts_HWR_0714_0.pdf
- Centers for Medicaid and Medicare Services (CMS ). 2014b. “2014 Measures Updates and Specifications Report Hospital‐Level 30‐Day Risk‐Standardized Readmission Measures” [accessed on January 28, 2016]. Available at http://www.astellashealthcarereformonestopshop.com/documents/Rdmsn_Updts_AMIPNCOPDSTK_032114.pdf
- Cohen, K. B. , and Demner‐Fushman D.. 2014. Biomedical Natural Language Processing. Philadelphia, PA: John Benjamins. [Google Scholar]
- Coleman, E. A. , Smith J. D., Frank J. C., Min S. J., Parry C., and Kramer A. M.. 2004. “Preparing Patients and Caregivers to Participate in Care Delivered Across Settings: The Care Transitions Intervention.” Journal of American Geriatric Society 52 (11): 1817–25. [DOI] [PubMed] [Google Scholar]
- Corrigan, J. M. , and Martin J. B.. 1992. “Identification of Factors Associated with Hospital Readmission and Development of a Predictive Model.” Health Services Research 27 (1): 81–101. [PMC free article] [PubMed] [Google Scholar]
- Corti, M. C. , Guralnik J. M., Salive M. E., Harris T., Field T. S., Wallace R. B., Berkman L. F., Seeman T. E., Glynn R. J., Hennekens C. H., and Havlik R. J.. 1995. “HDL Cholesterol Predicts Coronary Heart Disease Mortality in Older Persons.” Journal of American Medical Association 274 (7): 539–44. [PubMed] [Google Scholar]
- Di Cesare, M. , Khang Y. H., Asaria P., Blakely T., Cowan M. J., Farzadfar F., Guerrero R., Ikeda N., Kyobutungi C., Msyamboza K. P., Oum S., Lynch J. W., Marmot M. G., Ezzati M., and Lancet NCD Action Group . 2013. “Inequalities in Non‐Communicable Diseases and Effective Responses.” The Lancet 381 (9866): 585–97. [DOI] [PubMed] [Google Scholar]
- Donzé, J. , Aujesky D., Williams D., and Schnipper J.. 2013. “Potentially Avoidable 30‐Day Hospital Readmissions in Medical Patients: Derivation and Validation of a Prediction Model.” Journal of American Medical Association Internal Medicine 173 (8): 632–8. [DOI] [PubMed] [Google Scholar]
- Elixhauser, A. , Steiner C., Harris D. R., and Coffey R. M.. 1998. “Comorbidity Measures for Use With Administrative Data.” Medical Care 36 (1): 8–27. [DOI] [PubMed] [Google Scholar]
- Evans, R. L. , Hendricks R. D., Lawrence K. V., and Bishop D. S.. 1988. “Identifying Factors Associated With Health Care Use: A Hospital‐Based Risk Screening Index.” Social Science & Medicine 27 (9): 947–54. [DOI] [PubMed] [Google Scholar]
- Foraker, R. E. , Rose K. M., Suchindran C. M., Chang P. P., McNeill A. M., and Rosamond W. D.. 2011. “Socioeconomic Status, Medicaid Coverage, Clinical Comorbidity, and Rehospitalization or Death After an Incident Heart Failure Hospitalization: Atherosclerosis Risk in Communities Cohort (1987 to 2004).” Circulation. Heart Failure 4 (3): 308–16. [DOI] [PMC free article] [PubMed] [Google Scholar]
- Fried, L. P. , Kronmal R. A., Newman A. B., Bild D. E., Mittelmark M. B., Polak J. F., Robbins J. A., and Gardin J. M.. 1998. “Risk Factors for 5‐Year Mortality in Older Adults: The Cardiovascular Health Study.” Journal of American Medical Association 279 (8): 585–92. [DOI] [PubMed] [Google Scholar]
- Gamble, J. M. , Simpson S. H., Eurich D. T., Majumdar S. R., and Johnson J. A.. 2010. “Insulin Use and Increased Risk of Mortality in Type 2 Diabetes: A Cohort Study.” Diabetes, Obesity & Metabolism 12 (1): 47–53. [DOI] [PubMed] [Google Scholar]
- Goss, F. R. , Plasek J. M., Lau J. J., Seger D. L., Chang F. Y., and Zhou L.. 2014. “An Evaluation of a Natural Language Processing Tool for Identifying and Encoding Allergy Information in Emergency Department Clinical Notes.” AMIA Annual Symposium Proceedings, pp. 580–8. [PMC free article] [PubMed] [Google Scholar]
- Guihan, M. , Garber S. L., Bombardier C. H., Goldstein B., Holmes S. A., and Cao L.. 2008. “Predictors of Pressure Ulcer Recurrence in Veterans with Spinal Cord Injury.” Journal of Spinal Cord Medicine 31 (5): 551–9. [DOI] [PMC free article] [PubMed] [Google Scholar]
- Gundlapalli, A. V. , Carter M. E., Palmer M., Ginter T., Redd A., Pickard S., Shen S., South B., Divita G., Duvall S., Nguyen T. M., D'Avolio L. W., and Samore M.. 2013. “Using Natural Language Processing on the Free Text of Clinical Documents to Screen for Evidence of Homelessness among US Veterans.” AMIA Annual Symposium Proceedings, pp. 537–46. [PMC free article] [PubMed]
- Hammill, B. G. , Curtis L. H., Fonarow G. C., Heidenreich P. A., Yancy C. W., Peterson E. D., and Hernandez A. F.. 2011. “Incremental Value of Clinical Data Beyond Claims Data in Predicting 30‐Day Outcomes after Heart Failure Hospitalization.” Circulation Cardiovascular Quality Outcomes 4 (1): 60–7. [DOI] [PubMed] [Google Scholar]
- Hawkins, N. M. , Jhund P. S., McMurray J. J., and Capewell S.. 2012. “Heart Failure and Socioeconomic Status: Accumulating Evidence of Inequality.” European Journal of Heart Failure 14 (2): 138–46. [DOI] [PubMed] [Google Scholar]
- Häyrinen, K. , Saranto K., and Nykänen P.. 2008. “Definition, Structure, Content, Use and Impacts of Electronic Health Records: A Review of the Research Literature.” International Journal of Medical Informatics 77 (5): 291–304. [DOI] [PubMed] [Google Scholar]
- HCUP CCS . 2016. Clinical Classifications Software (CCS) for ICD‐9‐CM. Rockville, MD: Agency for Healthcare Research and Quality; [accessed on November 3, 2015]. Available at www.hcup-us.ahrq.gov/toolssoftware/ccs/ccs.jsp [Google Scholar]
- Herrin, J. , St Andre J., Kenward K., Joshi M. S., Audet A. M., and Hines S. C.. 2015. “Community Factors and Hospital Readmission Rates.” Health Services Research 50 (1): 20–39. [DOI] [PMC free article] [PubMed] [Google Scholar]
- Herv'e, A. 2010. “Holm's Sequential Bonferroni Procedure” In Encyclopedia of Research Design, edited by Salkind N., pp 1–8. Thousand Oaks, CA: Sage. [Google Scholar]
- Hong, C. S. , Siegel A. L., and Ferris T. G.. 2014. “Caring for High‐Need, High‐Cost Patients: What Makes for a Successful Care Management Program?” Issue Brief (Commonwealth Fund) 19: 1–9. [PubMed] [Google Scholar]
- Horwitz, L. I. , Partovian C., Lin Z., Herrin J. N., Conover M., Montague J., Dillaway C., Bartczak K., Suter L. G., Ross J. S., Bernheim S. M., Krumholz H. M., and Drye E. E.. 2014. “Development and Use of an Administrative Claims Measure for Profiling Hospital‐Wide Performance on 30‐Day Unplanned Readmission.” Annals of Internal Medicine 161 (10): S66–75. [DOI] [PMC free article] [PubMed] [Google Scholar]
- Howell, S. , Coory M., Martin J., and Duckett S.. 2009. “Using Routine Inpatient Data to Identify Patients at Risk of Hospital Readmission.” Boston Medical Center Health Services Research 9: 96. [DOI] [PMC free article] [PubMed] [Google Scholar]
- Howie‐Esquivel, J. , and Spicer J. G.. 2012. “Association of Partner Status and Disposition With Rehospitalization in Heart Failure Patients.” American Journal of Critical Care 21 (3): e65–73. [DOI] [PubMed] [Google Scholar]
- Hu, J. , Gonsahn M. D., and Nerenz D. R.. 2014. “Socioeconomic Status and Readmissions: Evidence from an Urban Teaching Hospital.” Health Affairs 33 (5): 778–85. [DOI] [PubMed] [Google Scholar]
- Joynt, K. E. , Orav E. J., and Jha A. K.. 2011. “Thirty‐Day Readmission Rates for Medicare Beneficiaries by Race and Site of Care.” Journal of the American Medical Association 305 (7): 675–81. [DOI] [PMC free article] [PubMed] [Google Scholar]
- Kansagara, D. , Englander H., Salanitro A., Kagen D., Theobald C., Freeman M., and Kripalani S.. 2011. “Risk Prediction Models for Hospital Readmission: A Systematic Review.” Journal of American Medical Association 306 (15): 1688–98. [DOI] [PMC free article] [PubMed] [Google Scholar]
- Krumholz, H. , Parent E., Tu N., Vaccarino V., Wang Y., Radford M. J., and Hennen J.. 1997. “Readmission after Hospitalization for Congestive Heart Failure among Medicare Beneficiaries.” Archives of Internal Medicine 157 (1): 99–104. [PubMed] [Google Scholar]
- Krumholz, H. M. , Chen Y. T., Wang Y., Vaccarino V., Radford M. J., and Horwitz R. I.. 2000. “Predictors of Readmission among Elderly Survivors of Admission with Heart Failure.” American Heart Journal 139 (1): 72–7. [DOI] [PubMed] [Google Scholar]
- Krumholz, H. , Normand S. T., Keenan P., Lin Z., Drye E., Bhat K., Wang Y., Ross J., Schuur J., Stauffer B., Bernheim S., Epstein A., Herrin J., Federer J., Mattera J., Wang Y., Mulvey G., Schreiner G., and YNHH‐CORE . 2008a. “Hospital 30‐Day Heart Failure Readmission Measure: Methodology” [accessed on November 3, 2015]. Available at http://www.qualitynet.org/dcs/ContentServer?c=Page&pagename=QnetPublic%2FPage%2FQnetTier3&cid=1219069855841
- Krumholz, H. M. , Normand S.‐L. T., Keenan P. S., Desai M. M., Lin Z., Dyre E. E., Bhat K. R., and Schreiner G. C.. 2008b. “Hospital 30‐Day Pneumonia Readmission Measure.”
- Krumholz, H. M. , Normand S. T., Keenan P. S., Desai M. M., Lin Z., Dyre E. E., Curtis J. P., Bhat K. R., and Schreiner G. C.. 2008c. “Hospital 30‐Day Acute Myocardial Infarction Readmission Measure: Methodology” [accessed on November 3, 2015]. Available at http://www.qualitynet.org/dcs/ContentServer?c=Page&pagename=QnetPublic%2FPage%2FQnetTier3&cid=1219069855841
- Krumholz, H. M. , Merrill A. R., Schone E. M., Schreiner G. C., Chen J., Bradley E. H., Wang Y., Wang Y., Lin Z., Straube B. M., Rapp M. T., Normand S. T., and Drye E. E.. 2009. “Patterns of Hospital Performance in Acute Myocardial Infarction and Heart Failure 30‐Day Mortality and Readmission.” Circulation: Cardiovascular Quality and Outcomes 2 (5): 407–13. [DOI] [PubMed] [Google Scholar]
- Krumholz, H. M. , Lin Z., Drye E. E., Desai M. M., Han L. F., Rapp M. T., Mattera J. A., and Normand S. L.. 2011. “An Administrative Claims Measure Suitable for Profiling Hospital Performance Based on 30‐Day All‐Cause Readmission Rates among Patients with Acute Myocardial Infarction.” Circulation 4 (2): 243–52. [DOI] [PMC free article] [PubMed] [Google Scholar]
- Kuper, H. , Marmot M., and Hemingway H.. 2002. “Systematic Review of Prospective Cohort Studies of Psychosocial Factors in the Etiology and Prognosis of Coronary Heart Disease.” Seminars in Vascular Medicine 2 (3): 267–314. [DOI] [PubMed] [Google Scholar]
- Lindenauer, P. K. , Normand S., Drye E. E., Lin Z., Goodrich K., Desai M. M., Bratzler D. W., O'Donnell W. J., Metersky M. L., and Krumholz H. M.. 2011. “Development, Validation, and Results of a Measure of 30‐Day Readmission Following Hospitalization for Pneumonia.” Journal of Hospital Medicine 6 (3): 142–50. [DOI] [PubMed] [Google Scholar]
- Manoukian, S. V. , Feit F., Mehran R., Voetlz M. D., Ebrahimi R., Hamon M., Dangas G. D., Lincoff A. M., White H. D., Moses J. W., King S. B. 3rd, Ohman E. M., and Stone G. W.. 2007. “Impact of Major Bleeding on 30‐Day Mortality and Clinical Outcomes in Patients with Acute Coronary Syndromes: An Analysis from the ACUITY Trial.” Journal of the American College of Cardiology 49 (12): 1362–8. [DOI] [PubMed] [Google Scholar]
- Marcantonio, E. R. , McKean S., Goldfinger M., Kleefield S., Yurkofsky M., and Brennan T. A.. 1999. “Factors Associated with Unplanned Hospital Readmission Among Patients 65 Years of Age and Older in a Medicare Managed Care Plan.” American Journal of Medicine 107 (1): 13–7. [DOI] [PubMed] [Google Scholar]
- Marmot, M. 2002. “The Influence of Income on Health: Views of an Epidemiologist.” Health Affairs 21 (2): 31–46. [DOI] [PubMed] [Google Scholar]
- Marmot, M. 2005. “Social Determinants of Health Inequalities.” The Lancet 365 (9464): 1099–104. [DOI] [PubMed] [Google Scholar]
- McGregor, M. , Reid R., Schulzer M., Fitzgerald J., Levy A., and Cox M.. 2006. “Socioeconomic Status and Hospital Utilization among Younger Adult Pneumonia Admissions at a Canadian Hospital.” BMC Health Services Research 6: 152. [DOI] [PMC free article] [PubMed] [Google Scholar]
- Naylor, M. D. , Aiken L. H., Kurtzman E. T., Olds D. M., and Hirshman K. B.. 2011. “The Care Span: The Importance of Transitional Care in Achieving Health Reform.” Health Affairs 30 (4): 746–54. [DOI] [PubMed] [Google Scholar]
- Nordestgaard, B. G. , Benn M., Schnohr P., and Tybjaerg‐Hansen A.. 2007. “Nonfasting Triglycerides and Risk of Myocardial Infarction, Ischemic Heart Disease, and Death in Men and Women.” Journal of American Medical Association 298 (3): 299–308. [DOI] [PubMed] [Google Scholar]
- O'Malley, K. J. , Cook K. F., Price M., Wildes K. R., Hurdle J. F., and Ashton C. M.. 2005. “Measuring Diagnoses: ICD Code Accuracy.” Health Services Research 40 (5): 1620–39. [DOI] [PMC free article] [PubMed] [Google Scholar]
- Perlis, R. H. , Iosifescu D. V., Castro V. M., Murphy S. N., Gainer V. S., Minnier J., Cai T., Goryachev S., Zeng Q., Gallagher P. J., Fava M., Weilburg J. B., Churchill S. E., Kohane I. S., and Smoller J. W.. 2012. “Using Electronic Medical Records to Enable Large‐Scale Studies in Psychiatry: Treatment Resistant Depression as a Model.” Psychological Medicine 42 (1): 41–50. [DOI] [PMC free article] [PubMed] [Google Scholar]
- Philbin, E. F. , and DiSalvo T. G.. 1999. “Prediction of Hospital Readmission for Heart Failure: Development of a Simple Risk Score Based on Administrative Data.” Journal of American College of Cardiology 33 (6): 1560–6. [DOI] [PubMed] [Google Scholar]
- Philbin, E. F. , Dec G. W., Jenkins P. L., and DiSalvo T. G.. 2001. “Socioeconomic Status as an Independent Risk Factor for Hospital Readmission for Heart Failure.” American Journal of Cardiology 87 (12): 1367–71. [DOI] [PubMed] [Google Scholar]
- Plasek, J. M. , Goss F. R., Lai K. H., Lau J. J., Seger D. L., Blumenthal K. G., Wickner P. G., Slight S. P., Chang F. Y., Topaz M., Bates D. W., and Zhou L.. 2016. “Food Entries in a Large Allergy Data Repository.” Journal of American Medical Informatics Association 23 (e1): e79–87. [DOI] [PMC free article] [PubMed] [Google Scholar]
- Rathore, S. S. , Masoudi F. A., Wang Y., Curtis J. P., Foody J. M., Havranek E. P., and Krumholz H. M.. 2006. “Socioeconomic Status, Treatment, and Outcomes among Elderly Patients Hospitalized with Heart Failure: Findings from the National Heart Failure Project.” American Heart Journal 152 (2): 371–8. [DOI] [PMC free article] [PubMed] [Google Scholar]
- Roe‐Prior, P . 2007. “Sociodemographic Variables Predicting Poor Post‐Discharge Outcomes for Hospitalized Elders with Heart Failure.” Medsurg Nursing 16 (5): 317–21. [PubMed] [Google Scholar]
- Rosenbloom, S. T. , Denny J. C., Xu H., Lorenzi N., Stead W. W., and Johnson K. B.. 2011. “Data From Clinical Notes: A Perspective on the Tension Between Structure and Flexible Documentation.” Journal of American Medical Informatics Association 18 (2): 181–6. [DOI] [PMC free article] [PubMed] [Google Scholar]
- Silverstein, M. D. , Qin H., Mercer S. Q., Fong J., and Haydar Z.. 2008. “Risk Factors for 30‐Day Hospital Readmission in Patients ≥65 Years of Age.” Proceedings (Baylor University Medical Center) 21 (4): 363–72. [DOI] [PMC free article] [PubMed] [Google Scholar]
- Solomon, D. H. , Rassen J. A., Glynn R. J., Garneau K., Levin R., Lee J., and Schneeweiss S.. 2010. “The Comparative Safety of Opioids for Nonmalignant Pain in Older Adults.” Archives Internal Medicine 170 (22): 1979–86. [DOI] [PubMed] [Google Scholar]
- Stansfeld, S. A. 2006. “Social Support and Social Cohesion.” Social Determinants of Health 2: 148–71. [Google Scholar]
- Tabak, Y. P. , Johannes R. S., and Silber J. H.. 2007. “Using Automated Clinical Data for Risk Adjustment: Development and Validation of Six Disease‐Specific Mortality Predictive Models for Pay‐For‐Performance.” Medical Care 45 (8): 789–805. [DOI] [PubMed] [Google Scholar]
- Tsuchihashi, M. , Tsutsui H., Kodama K., Kasagi F., Setoguchi S., Mohr M., Kubota T., and Takeshita A.. 2001. “Medical and Socioenvironmental Predictors of Hospital Readmission in Patients with Congestive Heart Failure.” American Heart Journal 142 (4): E7. [DOI] [PubMed] [Google Scholar]
- Tzoulaki, I. , Molokhia M., Curcin V., Little M. P., Millett C. J., Ng A., Hughes R. I., Khunti K., Wilkins M. R., Majeed A., and Elliot P.. 2009. “Risk of Cardiovascular Disease and All Cause Mortality among Patients with Type 2 Diabetes Prescribed Oral Antidiabetes Drugs: Retrospective Cohort Study Using UK General Practice Research Database.” British Medical Journal 339: b4731. [DOI] [PMC free article] [PubMed] [Google Scholar]
- Vinson, J. M. , Rich M. W., Sperry J. C., Shah A. S., and McNamara T.. 1990. “Early Readmission of Elderly Patients with Congestive Heart Failure.” Journal of American Geriatric Society 38 (12): 1290–5. [DOI] [PubMed] [Google Scholar]
- Watson, A. J. , O'Rourke J., Jethwani K., Cami A., Stern T. A., Kvedar J. C., Chueh H. C., and Zai A. H.. 2011. “Linking Electronic Health Record‐Extracted Psychosocial Data in Real‐Time to Risk of Readmission for Heart Failure.” Psychosomatics 52 (4): 319–27. [DOI] [PMC free article] [PubMed] [Google Scholar]
- Zeng, X. , and Bell P. D.. 2011. “Determination of Problematic ICD‐9‐CM Subcategories for Further Study of Coding Performance: Delphi Method.” Perspectives in Health Information Management 8: 1b. [PMC free article] [PubMed] [Google Scholar]
- Zhou, L. , Plasek J. M., Mahoney L. M., Karipineni N., Chang F., Yan X., Chang F., Dimaggio D., Goldman D. S., and Rocha R. A.. 2011. “Using Medical Text Extraction, Reasoning and Mapping System (MTERMS) to Process Medication Information in Outpatient Clinical Notes.” AMIA Annual Symposium Proceedings, pp. 1639–48. [PMC free article] [PubMed] [Google Scholar]
- Zhou, L. , Plasek J. M., Mahoney L. M., Chang F., Dimaggio D., and Rocha R. A.. 2012. “Mapping Partners Master Drug Dictionary to RxNorm Using an NLP‐Based Approach.” Journal Biomedical Informatics 2012 (45): 626–33. [DOI] [PubMed] [Google Scholar]
- Zhou, L. , Lu Y., Vitale C. J., Mar P. L., Chang F., Dhopeshwarkar N., and Rocha R. A.. 2014. “Representation of Information about Family Relatives as Structured Data in Electronic Health Records.” Applied Clinical Informatics 5 (2): 349–67. [DOI] [PMC free article] [PubMed] [Google Scholar]
- Zhou, L. , Baughman A. W., Lei V. J., Lai K. H., Navathe A. S., Chang F., Sordo M., Topaz M., Zhong F., Murrali M., Navathe S., and Rocha R. A.. 2015. “Identifying Patients with Depression Using Free‐Text Clinical Documents.” Studies in Health Technology and Informatics 216: 629–33. [PubMed] [Google Scholar]
Associated Data
This section collects any data citations, data availability statements, or supplementary materials included in this article.
Supplementary Materials
Appendix SA1: Author Matrix.
Appendix SA2:
Table S1: MTERMS NLP Performance in the Identification of Social Factors – Derivation Set (n = 500).
Table S2: MTERMS NLP Performance in the Identification of Social Factors – Validation Set (n = 600).
Table S3: ICD‐9 Codes for Each Social Factor.
Table S4: Lexicon of Terms Used to Identify Each Social Factor in the Clinical Text of the Physician Note.
Table S5: Risk‐Adjusted Association between Social Factors Detected in Physician Notes and Readmission.
Table S6: Unrestricted NLP Set: Unadjusted Frequency of Social Factors and Association with Readmission by Data Source Used in Identification (N = 93,606 Admissions).
Table S7: Unrestricted NLP Set: Risk‐Adjusted Association between Social Factors and Readmission.
Table S8: Unrestricted NLP Set: Association between Social Factors and Readmission after Detailed Risk Adjustment.
Figure S1: Methods Overview of NLP Approach to Identification of Social Factors.
Figure S2: NLP Social Factor Identification Algorithm.