

Abstract
Objective
To assess the impact of proxy survey responses on cancer care experience reports and quality ratings.
Data Sources/Study Setting
Secondary analysis of data from Cancer Care Outcomes Research and Surveillance (CanCORS). Recruitment occurred from 2003 to 2005.
Study Design
The study was a cross‐sectional observational study. The respondents were patients with incident colorectal or lung cancer or their proxies.
Data Collection/Extraction Methods
Analyses used linear regression models with an independent variable for proxy versus patient responses as well as study site and clinical covariates. The outcomes were experiences with medical care, nursing care, care coordination, and care quality rating. Multiple imputation was used for missing data.
Principal Findings
Among 6,471 respondents, 1,011 (16 percent) were proxies. The proportion of proxy respondents varied from 6 percent to 28 percent across study sites. Adjusted proxy scores were modestly higher for medical care experiences (+1.28 points [95 percent CI:+ 0.05 to +2.51]), but lower for nursing care (−2.81 [95 percent CI: −4.11 to −1.50]) and care coordination experiences (−2.98 [95 percent CI: −4.15 to −1.81]). There were no significant differences between adjusted patient and proxy ratings of quality.
Conclusions
Proxy responses have small but statistically significant differences from patient responses. However, if ratings of care are used for financial incentives, such differences could be exaggerated across practices or areas if proxy use varies.
Keywords: Care experience, care quality, proxy, cancer
There is growing interest in evaluating the patient experience and perceived quality of care. In the United States, the Consumer Assessment of Health Plans Survey (CAHPS) covers a wide range of health care conditions and contexts, and it is used in pay for performance (Anhang Price et al. 2014). In the United Kingdom, patient care experience is a focus for quality improvement efforts (Department of Health 2012). Patient experience also plays an important role in quality assessment (Anhang Price et al. 2014), and patient experience reports and quality ratings are associated with technical quality measures for hospital care (Isaac et al. 2010). These trends have extended to cancer care (Basch et al. 2014). In July 2016, the Centers for Medicare and Medicaid Services initiated the Oncology Care Model, a new payment model for physician practices administering chemotherapy that will include financial and performance accountability, with performance based in part on patient experience surveys (Centers for Medicare and Medicaid Services 2016).
In major national health and health care surveys, including CAHPS, proxy respondents are allowed if patients are unable to respond (Mosely and Wolinsky 1986; Todorov and Kirchner 2000; Zaslavsky et al. 2001; Perruccio and Badley 2004; Elliott et al. 2008). Proxy use can minimize missing data and improve representativeness, because proxies are typically required for sicker patients (Gruber‐Baldini et al. 2012). However, using proxy responses raises concerns about whether they affect estimates, an important concern when reports and ratings are used for payment and planning purposes.
Proxy responses have had varying effects on experience and satisfaction estimates. Among Medicare beneficiaries, proxies have given slightly higher ratings (Zaslavsky et al. 2001) as well as more negative reports of care (Elliott et al. 2008). Similarly, a Norwegian study of hospital inpatients found proxy reports to be more negative (Bjertnaes 2014). However, in paired evaluations, proxy reports for adults in transitional unit care (Castle 2005), and multimorbid older adults receiving care for chronic illness (Giovannetti et al. 2013) were more favorable than patient reports, and not significantly different for patients receiving ICU care (Stricker et al. 2011).
In situations where proxy prevalence is low, proxy impact is likely to be minimal and thus of little practical significance. However, in contexts such as cancer, dementia, or palliative care, a higher prevalence and thus potential impact of proxies can be expected. To date, research evaluating the impact of proxy responses in these contexts is limited.
Proxy responses may also impact the case‐mix adjustment approach. Health status measures are important predictors of care satisfaction and experience (Hall, Milburn, and Epstein 1993; Young, Meterko, and Desai 2000; Wilson et al. 2002), and they are included in the CAHPS case‐mix adjustment model. Initial work identified self‐rated emotional health as the most significant predictor of care experiences (Zaslavsky et al. 2001). Other evaluations, including pediatric CAHPS (Kim, Zaslavsky, and Cleary 2005) and hospital CAHPS (O'Malley et al. 2005), also found a key role for self‐rated health status. Other studies likewise underscore the predictive importance of self‐rated health status (Hargraves et al. 2001), highlighting the importance of its inclusion in adjustment models. However, proxy reports of health status are known to differ from patient reports (Rothman et al. 1991; Magaziner et al. 1997; Sneeuw et al. 1998; Tamim, McCusker, and Dendukuri 2002; Sitoh et al. 2003; Giesinger et al. 2009). Thus, in addition to potentially impacting outcome variables directly, proxy responses may also indirectly impact outcomes by biasing case‐mix adjustment approaches.
We explored the impact of proxy responses for cancer patients using data from a large, clinically and demographically representative survey (Catalano et al. 2013) of patients with incident lung or colorectal cancer or their proxies. We first asked, how does the inclusion of proxy responses affect reports of patients’ experience of medical care, nursing care, and care coordination/responsiveness as well as patients’ overall rating of care quality? Second, how does the use of proxy data impact the relationship of patient health status and reports of experience and rating of care quality when health status is reported by proxy and included in the case‐mix adjustment model? Our initial hypothesis was that proxies would report more positive care experiences and higher care quality.
Methods
Data Source and Study Sample
Data were drawn from the Cancer Care Outcomes Research and Surveillance Consortium (CanCORS), which recruited patients diagnosed with lung or colorectal cancer in 2003–2005 (Ayanian et al. 2010; Catalano et al. 2013). Various aspects of the study including recruitment (Ayanian et al. 2004, 2010), survey instrument development (Malin et al. 2006), multiple imputation methodology (He et al. 2010), and analyses have been reported previously (Ayanian et al. 2010; Keating et al. 2010; Walling et al. 2015). CanCORS participants were recruited from multiple sites covering almost 30 million people (Ayanian et al. 2010), including five population‐based geographically defined regions, five integrated health care delivery systems, and 15 Veterans Affairs hospitals (Catalano et al. 2013).
Patients aged 21 or older were identified within weeks of cancer diagnosis and surveyed by telephone at approximately 4 to 7 months postdiagnosis by trained interviewers using computer‐assisted telephone interview software (Ayanian et al. 2010). The American Association for Public Opinion Research response rate was 51.0 percent, and the cooperation rate among patients for whom contact information was available was 59.9 percent (Catalano et al. 2013). Surveys, adapted from previously validated questionnaires, collected information on a range of topics, including patient characteristics, patient experience, and rating of care and health status (Malin et al. 2006). Proxies were interviewed if patients were too ill to participate or preferred to have a close relative or other caregiver respond, or if patients had died. Diagnosis and staging information was drawn from medical records, or from cancer registries. Partial and brief surveys were also conducted to maximize response rates. The 9,732 available and completed surveys were completed by 6,959 patients (72 percent), 1,035 proxies for living patients (11 percent), and 1,738 proxies for decedents (18 percent).
For this analysis, we studied patients and proxies for living patients who completed the full baseline survey, resulting in 6,471 respondents (N = 1,011 proxies and N = 5,460 patients) (Figure 1). The CanCORS core (v1.18) and survey datasets (v1.12) were used. The CanCORS study was approved by the institutional review boards of all participating institutions.
Figure 1.
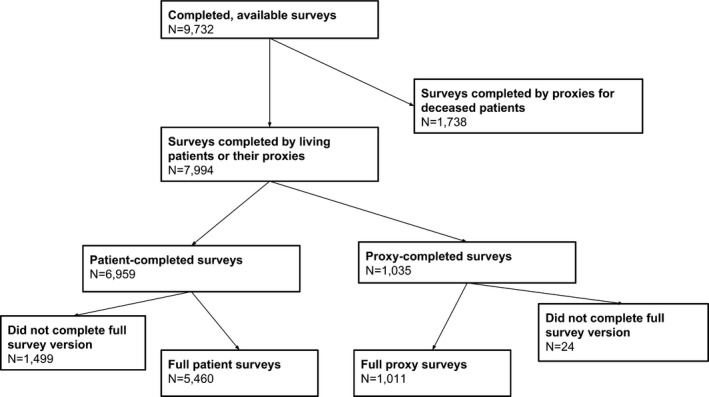
Selection of Study Sample
Outcome Measures
Care experience assessments were adapted from CAHPS and Picker Institute questionnaires (Malin et al. 2006) and assessed three domains: medical care, nursing care, and care coordination/responsiveness (Ayanian et al. 2010). We evaluated the internal consistency reliability of these measures in our analytical sample using Cronbach's α. Previous analyses using CanCORS data have operationalized these as composite 0–100 point scales, where higher scores indicate better experience (Ayanian et al. 2010; Martinez et al. 2015). The quality rating was a single item on a 1–5 scale (poor, fair, good, very good, excellent). To facilitate comparisons across models, this was converted to a 0–100 score by subtracting the minimum, dividing by the range, and multiplying by 100.
The items for each domain are provided in Table S1. Briefly, the five medical care and two nursing care items covered aspects of communication with these health professionals. The four care coordination/responsiveness items assessed how well providers worked together and whether patient disease and treatment problems were promptly addressed. In the original CanCORS analyses, this care coordination scale had six items. However, two of the items had particularly high rates of “not applicable” (n/a) responses: one asked how often patients were able to see wanted specialists (6.7 percent of responses) and another asked about physician awareness of anticancer treatments recommended by other doctors (14.8 percent of responses). These responses could not reliably contribute to the scale calculation and were thus omitted.
Overall, and across all outcomes, we excluded a small number of observations due to patients reporting “n/a” (≤0.1 percent for all outcomes save care coordination). For care coordination, 2 percent of respondents answered “n/a” to the item relating to knowing whom to ask for questions about disease/treatment. Between‐respondent differences for “n/a” were generally small (<2 percent), and not consistently in the same direction; proxy rates were higher for care coordination but lower for all other outcomes.
Covariates Used for the Case‐Mix Model
The primary independent variable was patient versus proxy. Covariates were selected to mirror the CAHPS case‐mix model as closely as possible. Cancer‐related covariates were selected based on the adjustment model in the UK Cancer Patient Experience Survey (Abel, Saunders, and Lyratzopoulos 2014), because the CAHPS cancer experience assessment is currently under development (Garfinkel et al. 2014) and current CAHPS models do not contain cancer‐specific covariates (e.g., cancer type and stage). Cancer stage was operationalized as potentially curable or incurable. For lung cancer, incurable included American Joint Committee on Cancer (AJCC) stage IIIB or IV, distant, or unstaged cancers. For colorectal cancer, incurable included AJCC stage IV, distant, or unstaged cancers. We also adjusted for sociodemographic factors, including age, race/ethnicity, educational attainment, and language of CanCORS survey (English, Spanish, or Chinese). We also included fixed effects for CanCORS study sites (Ayanian et al. 2010) and self‐ or proxy‐rated general and mental health. Both health ratings came from the SF‐12 survey: self‐rated health was the overall health perception item, and mental health was the “calm and peaceful” item. Previous CAHPS analyses have used this mental health item as a covariate (Zaslavsky et al. 2001).
Analytic Approach for Missing Data
Overall, missing data were infrequent (2.1 percent missingness across all covariates of interest). Multiple imputation using sequential regression imputation (He et al. 2010) was used for missing data. A total of five imputed datasets were created, and missing data in both proxy and patient surveys were imputed. As the questionnaire allowed for categories such as “n/a” and “don't know,” these categories were also allowed in the imputed data; there were a small number of patients (N = 28) and proxies (N = 8) with these responses in the multiply imputed datasets, and they were excluded from relevant analyses.
To account for multiply imputed data, for all analyses, linear regression models were utilized within each complete dataset and results were summarized with corresponding combination formulas. The R 2 was used to summarize the percent of variance explained by the models. R 2 estimates and their corresponding standard error across multiple datasets were combined using a previously suggested approach (Harel 2009; Chaurasia and Harel 2015). Interaction terms for site and proxy were tested in each model to examine whether the impact of proxies varied across sites. The significance and contribution of this term was evaluated using the partial F‐test (Raghunathan and Dong 2011).
Analytic Approach for Evaluation of Proxy Impact on Outcomes and Covariates
The impact of proxies in unadjusted analyses was obtained using simple linear regression models with the proxy variable as the only independent variable. The adjusted analyses included the proxy variable as well as the case‐mix covariates specified above. All covariates were entered simultaneously.
To evaluate the impact of proxy‐reported data on site‐ and respondent‐level scores, we used marginalized parameter estimates to compare adjusted and unadjusted site‐ and respondent‐level outcomes. For site‐specific scores, we compared marginalized adjusted estimates both with and without proxy‐reported data included.
Our evaluation of the impact of proxy‐reported data on other variables focused on self‐rated general and mental health status. We focused on health status because of their known importance as predictors of care experience and quality (Hall, Milburn, and Epstein 1993). Additionally, previous research has suggested that proxy and patient reports of patient health differ (Sneeuw, Sprangers, and Aaronson 2002; von Essen 2004). Thus, we compared fully adjusted models (e.g., all case‐mix variables included) with proxy data and a proxy variable in the model; adjusted models with proxy data but no proxy variable in the model; adjusted models without proxy data or a proxy variable. Finally, we also compared simple linear regression models with the general and mental health status rating variables as the sole covariates. These models were implemented both with and without proxy‐reported data.
Models were run separately for each outcome. Model diagnostics included residuals versus predicted plot, Q‐Q plot for residual normality, and Cook's d.
Sensitivity Analyses
We considered the impact of survey timing on responses by adding in a variable for the timing of survey relative to the date of diagnosis. As the proportion of respondents with the highest possible item/composite score (Elliott et al. 2009; AHRQ 2015) is of interest in CAHPS evaluations (Agency for Healthcare Research and Quality 2015), we assessed whether results were similar when the outcome was operationalized as a binary variable (highest score obtained/not obtained) rather than a continuous variable. We ran logistic regression models for each outcome and used the Hosmer–Lemeshow test and c‐statistic for model diagnostics. Because there is currently no gold standard approach for combining or evaluating these model diagnostics in multiply imputed data (Sullivan and Andridge 2012), we examined the estimated values for each of the imputed dataset.
Finally, as multiple imputation is not always used in surveys, we assessed whether our findings were similar under other commonly used approaches for missing outcome data. To this end, we employed the single imputation “half‐scale rule” (Carvajal et al. 2014) and complete case analysis. The “half‐scale rule,” which has been used in some CAHPS analyses, calculates the scale with available completed items for respondents who are missing less than half of the items on a scale (Fayers and Machin 2007). We examined the point and interval estimates for the proxy and health‐rating coefficients in the linear regression models described above using these approaches and compared them to multiple imputation. All analyses were conducted in SAS, version 9.4 (Cary, NC, USA), and calculations in R Studio, version 3.2.2 (Boston, MA, USA).
Results
Description of Study Sample and Outcome Measures
Proxy respondents comprised approximately 16 percent of the study sample (Table 1). Patients with proxy respondents tended to be older, less educated, non‐white, and more likely to complete a non‐English language survey. While the distribution of cancer types was similar across respondent types (48 percent lung cancer for proxies vs. 44 percent for patients), patients with proxy respondents were more likely to have advanced‐stage cancers (41 percent incurable for proxies vs. 31 percent for patients). Proxy reports of patient general health status were considerably poorer than patient reports; 19 percent proxies endorsed “poor,” the lowest category, compared with 5 percent of patients. Proxies also reported worse patient mental health status, but the discrepancies were smaller, with 6 percent of proxies and 2 percent of patients endorsing the lowest category. The prevalence of proxies varied by study site, from 6 to 28 percent (median 15 percent). Proxies were interviewed a median 161.5 days following diagnosis (IQR 74, range 57 days–830 days) versus a median of 147.2 days for patients (IQR 62, range 41 days–1,048 days).
Table 1.
Characteristics of Study Sample: Observed Data (N = 6,471)
| Characteristic | Overall, N (%) | Proxy‐Reported, N (%) | Patient‐Reported, N (%) |
|---|---|---|---|
| Patient age | |||
| ≤59 years old | 1,980 (30.6) | 131 (13.0) | 1,849 (33.9) |
| 60–69 years old | 1,827 (28.2) | 237 (23.4) | 1,590 (29.1) |
| 70–79 years old | 1,771 (27.4) | 330 (32.6) | 1,441 (26.4) |
| 80+ years old | 893 (13.8) | 313 (31.0) | 580 (10.6) |
| Patient educational attainment | |||
| <High school | 1,331 (20.6) | 410 (40.6) | 921 (16.9) |
| High school/vocational/some college (<4 years) | 3,603 (55.7) | 445 (44.0) | 3,158 (57.8) |
| College (4 years or degree)/postgraduate | 1,464 (22.6) | 120 (11.9) | 1,344 (24.6) |
| Missing (blank, refused, n/a, unknown) | 73 (1.1) | 36 (3.6) | 37 (0.7) |
| Patient race/ethnicity | |||
| White | 4,400 (68.0) | 599 (59.3) | 3,801 (69.6) |
| Latino | 479 (7.4) | 108 (10.7) | 371 (6.8) |
| African‐American | 886 (13.7) | 160 (15.8) | 726 (13.3) |
| Asian (incl. Native Hawaiian, Pacific Islander) | 370 (5.7) | 97 (9.6) | 273 (5.0) |
| Other (incl. Native American, multiracial) | 322 (5.0) | 44 (4.4) | 278 (5.1) |
| Missing (unknown) | 14 (0.2) | 3 (0.3) | 11 (0.2) |
| Patient cancer type | |||
| Lung | 2,907 (44.9) | 485 (48.0) | 2,422 (44.4) |
| Colorectal | 3,564 (55.1) | 526 (52.0) | 3,038 (55.6) |
| Survey language | |||
| English | 6,176 (95.4) | 939 (92.9) | 5,237 (95.9) |
| Spanish | 164 (2.5) | 37 (3.7) | 127 (2.3) |
| Chinese | 113 (1.8) | 33 (3.3) | 80 (1.5) |
| Missing (unknown) | 18 (0.3) | 2 (0.2) | 16 (0.3) |
| Patient general health status | |||
| Poor | 478 (7.4) | 190 (18.9) | 288 (5.3) |
| Fair | 1,241 (19.2) | 291 (28.8) | 950 (17.4) |
| Good | 2,125 (32.8) | 274 (27.1) | 1,851 (33.9) |
| Very good | 1,746 (27.0) | 168 (16.6) | 1,578 (28.9) |
| Excellent | 797 (12.3) | 65 (6.4) | 732 (13.4) |
| Missing (blank, refused, n/a, unknown) | 84 (1.3) | 23 (2.3) | 61 (1.1) |
| Patient mental health (“felt calm and peaceful”) | |||
| All of the time | 1,331 (20.6) | 124 (12.3) | 1,207 (22.1) |
| Most of the time | 2,594 (40.1) | 335 (33.1) | 2,259 (41.4) |
| Some of the time | 1,569 (24.3) | 280 (27.7) | 1,289 (23.6) |
| A little of the time | 711 (11.0) | 185 (18.3) | 526 (9.6) |
| None of the time | 187 (2.9) | 60 (5.9) | 127 (2.3) |
| Missing (blank, refused, n/a, unknown) | 79 (1.2) | 27 (2.7) | 52 (1.0) |
| Patient cancer stage/curability | |||
| Incurablea | 2,089 (32.3) | 410 (40.6) | 1,679 (30.8) |
| Potentially curable | 4,382 (67.7) | 601 (59.5) | 3,781 (69.3) |
| Respondent type | |||
| Proxy | 1,011 (15.6) | 1,011 (100) | 5,460 (100) |
| Patient | 5,460 (84.4) | ||
| CanCORS site | |||
| 1 | 933 (14.4) | 65 (6.4) | 868 (15.9) |
| 2 | 1,345 (20.8) | 206 (20.4) | 1,139 (20.9) |
| 3 | 857 (13.2) | 238 (23.5) | 619 (11.3) |
| 4 | 1,359 (21.0) | 209 (20.7) | 1,150 (21.1) |
| 5 | 567 (8.8) | 75 (7.4) | 492 (9.0) |
| 6 | 755 (11.7) | 124 (12.3) | 631 (11.6) |
| 7 | 655 (10.1) | 94 (9.3) | 561 (10.3) |
Lung cancer: distant, unstaged, stage IIIB or above; colorectal cancer: distant, unstaged, stage IV.
Among the analytic cohort of N = 6,435 (N = 1,003 proxies and N = 5,432 patients) in the imputed data, nearly all respondents had complete, valid responses for the outcomes: N = 6,432 for medical care (Cronbach's α = 0.80) and nursing care experience (Cronbach's α = 0.84) and N = 6,431 for care quality rating. For care coordination (Cronbach's α = 0.75), N = 6,311 had complete data. As described above, this relatively higher level of an incomplete outcome was due to “n/a” responses to the question about whether the patient knew whom to ask when they had any questions related to their disease or treatment. For the sensitivity analyses using the observed (not multiply imputed) data, the analytic cohort for the half‐scale rule and complete cases analyses was N = 6,333 as these approaches do not consider covariate imputation.
Impact of Proxy‐Reported Data on Outcomes
In unadjusted analyses, proxy scores for care experiences and quality ratings were significantly lower on average than patient scores (Table 2). However, scores were generally high, with experience scores close to 90 (100 maximum) for all outcomes; quality rating scores were close to 80 (100 maximum). For all outcomes, over 50 percent of respondents gave the highest possible score. The unadjusted average proxy medical care score was 87.04 (SE = 0.54), compared with 89.25 (SE = 0.23) for patients. For nursing care experience, the average proxy score was 88.47 (SE = 0.56), versus 91.47 (SE = 0.24) for patients. For care coordination, the average scores were 85.06 (SE = 0.52) and 89.96 (SE = 0.22), respectively. Finally, the average proxy quality rating was 77.29 (SE = 0.71), versus 83.92 (SE = 0.30) for patients. The proxy variable explained ≤1 percent of the variation in the outcome in unadjusted analyses.
Table 2.
Proxy and Patient Scores and Differences: Unadjusted and Adjusted Models in the Multiply Imputed Analytic Cohort (N = 6,435)
| Outcome | Unadjusted | Adjusted |
|---|---|---|
| Medical care (N = 6,432) | ||
| Mean proxy score (standard error) | 87.04 (0.54) | 89.98 (0.56) |
| Mean patient score (standard error) | 89.25 (0.23) | 88.70 (0.22) |
| Patient–proxy difference (95% CI) | −2.20 (−3.36 to −1.05) | 1.28 (0.05 to 2.51) |
| R 2 (95% CI) | 0.002 (0.002–0.003) | 0.10 (0.09–0.11) |
| Nursing care (N = 6,432) | ||
| Mean proxy score (standard error) | 88.47 (0.56) | 88.63 (0.60) |
| Mean patient score (standard error) | 91.47 (0.24) | 91.44 (0.24) |
| Proxy coefficient (95% CI) | −3.00 (−4.21 to −1.80) | −2.81 (−4.11 to −1.50) |
| R 2 (95% CI) | 0.004 (0.003–0.005) | 0.06 (0.06–0.07) |
| Care coordination (N = 6,311) | ||
| Mean proxy score (standard error) | 85.06 (0.52) | 86.71 (0.54) |
| Mean patient score (standard error) | 89.96 (0.22) | 89.68 (0.22) |
| Proxy coefficient (95% CI) | −4.90 (−6.01 to −3.79) | −2.98 (−4.15 to −1.81) |
| R 2 (95% CI) | 0.01 (0.01–0.01) | 0.12 (0.11–0.13) |
| Quality rating (N = 6,431) | ||
| Mean proxy score (standard error) | 77.29 (0.71) | 82.78 (0.72) |
| Mean patient score (standard error) | 83.92 (0.30) | 82.91 (0.29) |
| Proxy coefficient (95% CI) | −6.63 (−8.13 to −5.13) | −0.13 (−1.69 to 1.43) |
| R 2 (95% CI) | 0.01 (0.01–0.01) | 0.14 (0.13–0.15) |
“Unadjusted” indicates that this is the only variable in the model, while “adjusted” means the model accounts for all other covariates: cancer type, cancer stage, age, race/ethnicity, educational attainment, language of CanCORS survey, CanCORS site, patient general health, patient mental health.
After adjustment for demographic and clinical characteristics, proxy scores were significantly higher than patient scores for medical care (+1.28 points on average, 95 percent CI +0.05 to +2.51), significantly lower for nursing care (−2.81 points on average, 95 percent CI −4.11 to −1.50) and care coordination (−2.98 points on average, 95 percent CI −4.15 to −1.81), and did not differ significantly for quality ratings (−0.13 points on average, 95 percent CI −1.69 to +1.43) (Table 2). In terms of adjusted marginalized means, the proxy score for medical care was 89.98 (SE = 0.56), compared with 88.70 (SE = 0.22) for patients. For nursing care, the proxy score was 88.63 (SE = 0.60), while the patient score was 91.44 (SE = 0.24). For care coordination, the scores were 86.71 (SE = 0.54) and 89.68 (SE = 0.22), respectively. For quality rating, the scores were 82.78 (SE = 0.72) for proxies and 82.91 (SE = 0.29) for patients.
Adjusted analyses explained a relatively low proportion of variation for these outcomes, with R 2 values ranging from 6 to 14 percent. The interaction of proxy and site was not statistically significant in any model.
Average site‐specific scores were likewise high (86–93 points for the experience outcomes and 81–88 for the quality outcome). Adjusted site scores were minimally different from unadjusted scores, regardless of whether or not proxy responses were included (data not shown).
Impact of Proxy‐Reported Data on Reports of Patient Health Status Covariates
The exclusion or inclusion of proxy data and a proxy variable in the regression model changed the estimates for general health (Table 3) and mental health (Table 4) only slightly, in both unadjusted and adjusted regression analyses. Both aspects of self‐rated health explained more of the variation in the outcomes than respondent status, although for all outcomes R 2 was <10 percent. Excluding proxy data did not substantially lower the variation explained for the adjusted or the unadjusted models, although it slightly increased the absolute value of the self‐rated health coefficients.
Table 3.
The Impact of Proxy Data on General Health Status Coefficients: Unadjusted and Adjusted Models in the Multiply Imputed Analytic Cohort (N = 6,435)
| Outcome | Unadjusted (with Proxy Data) | Unadjusted (without Proxy Data) | Adjusted (with Proxy Data and Coefficient) | Adjusted (with Proxy Data, No Proxy Coefficient) | Adjusted (without Proxy Data) |
|---|---|---|---|---|---|
| Medical care | |||||
| N = 6,432 | N = 5,429 | ||||
| R 2 = 0.04 (0.04–0.05) | R 2 = 0.04 (0.04–0.05) | ||||
| Poor | −11.65 (−13.55 to −9.76) | −12.61 (−14.85 to −10.37) | −8.61 (−10.62 to −6.61) | −8.33 (−10.33 to −6.34) | −8.79 (−11.08 to −6.51) |
| Fair | −8.67 (−10.16 to −7.17) | −8.66 (−10.24 to −7.08) | −5.75 (−7.32 to −4.19) | −5.64 (−7.20 to −4.08) | −5.35 (−6.99 to −3.71) |
| Good | −4.06 (−5.42 to −2.70) | −4.06 (−5.45 to −2.67) | −2.30 (−3.68 to −0.92) | −2.29 (−3.67 to −0.91) | −2.07 (−3.48 to −0.65) |
| Very good | −1.79 (−3.19 to −0.39) | −2.00 (−3.43 to −0.58) | −0.91 (−2.30 to 0.47) | −0.92 (−2.30 to 0.47) | −0.97 (−2.39 to 0.44) |
| Excellent | Reference | Reference | Reference | Reference | Reference |
| Nursing care | |||||
| N = 6,432 | N = 5,429 | ||||
| R 2 = 0.01 (0.01–0.01) | R 2 = 0.01 (0.01–0.01) | ||||
| Poor | −5.60 (−7.61 to −3.60) | −4.24 (−6.59 to −1.90) | −3.04 (−5.17 to −0.90) | −3.65 (−5.77 to −1.53) | −1.95 (−4.37 to 0.46) |
| Fair | −4.80 (−6.38 to −3.23) | −4.54 (−6.19 to −2.89) | −2.56 (−4.22 to −0.91) | −2.81 (−4.46 to −1.15) | −2.40 (−4.13 to −0.67) |
| Good | −2.73 (−4.18 to −1.28) | −2.56 (−4.03 to −1.09) | −1.47 (−2.95 to 0.002) | −1.51 (−2.98 to −0.03) | −1.27 (−2.77 to 0.23) |
| Very good | −1.72 (−3.20 to −0.24) | −1.82 (−3.33 to −0.32) | −1.07 (−2.54 to 0.40) | −1.05 (−2.52 to 0.42) | −1.09 (−2.58 to 0.41) |
| Excellent | Reference | Reference | Reference | Reference | Reference |
| Care coordination | |||||
| N = 6,311 | N = 5,339 | ||||
| R 2 = 0.04 (0.04–0.05) | R 2 = 0.04 (0.03–0.04) | ||||
| Poor | −12.13 (−13.97 to −10.29) | −10.94 (−13.08 to −8.79) | −8.41 (−10.36 to −6.47) | −9.05 (−10.98 to −7.12) | −7.80 (−9.99 to −5.62) |
| Fair | −8.98 (−10.43 to −7.53) | −8.56 (−10.07 to −7.05) | −5.87 (−7.37 to −4.37) | −6.12 (−7.62 to −4.62) | −5.77 (−7.33 to −4.21) |
| Good | −4.15 (−5.48 to −2.82) | −4.15 (−5.50 to −2.80) | −2.47 (−3.80 to −1.13) | −2.50 (−3.84 to −1.16) | −2.55 (−3.91 to −1.19) |
| Very good | −2.54 (−3.91 to −1.18) | −2.94 (−4.32 to −1.55) | −1.76 (−3.10 to −0.42) | −1.73 (−3.07 to −0.39) | −2.12 (−3.48 to −0.76) |
| Excellent | Reference | Reference | Reference | Reference | Reference |
| Quality rating | |||||
| N = 6,431 | N = 5,428 | ||||
| R 2 = 0.09 (0.08–0.09) | R 2 = 0.07 (0.07–0.08) | ||||
| Poor | −23.41 (−25.86 to −20.96) | −21.81 (−24.67 to −18.95) | −19.33 (−21.93 to −16.73) | −19.36 (−21.93 to −16.78) | −17.70 (−20.66 to −14.74) |
| Fair | −18.00 (−19.90 to −16.09) | −17.29 (−19.31 to −15.27) | −14.28 (−16.28 to −12.29) | −14.30 (−16.29 to −12.31) | −13.67 (−15.78 to −11.55) |
| Good | −11.65 (−13.39 to −9.90) | −11.62 (−13.42 to −9.82) | −9.38 (−11.16 to −7.61) | −9.38 (−11.16 to −7.61) | −9.23 (−11.07 to −7.40) |
| Very good | −5.90 (−7.69 to −4.10) | −6.31 (−8.15 to −4.48) | −4.88 (−6.66 to −3.10) | −4.88 (−6.66 to −3.10) | −5.14 (−6.97 to −3.31) |
| Excellent | Reference | Reference | Reference | Reference | Reference |
“Unadjusted” refers to only this variable in the model, while “adjusted” means all other variables are included in the model.
Table 4.
The Impact of Proxy Data on Mental Health Status Coefficients: Unadjusted and Adjusted Models in the Multiply Imputed Analytic Cohort (N = 6,435)
| Outcome | Unadjusted (with Proxy Data) | Unadjusted (without Proxy Data) | Adjusted (with Proxy Data and Coefficient) | Adjusted (with Proxy Data, No Proxy Coefficient) | Adjusted (without Proxy Data) |
|---|---|---|---|---|---|
| Medical care | N = 6,432 | N = 5,429 | N = 6,432 | N = 6,432 | N = 5,429 |
| R 2 = 0.04 (0.04–0.05) | R 2 = 0.05 (0.04–0.05) | ||||
| Most of the time | −2.49 (−3.59 to −1.39) | −2.26 (−3.39 to −1.12) | −2.03 (−3.14 to −0.92) | −1.97 (−3.07 to −0.86) | −1.85 (−2.99 to −0.71) |
| Some of the time | −7.42 (−8.65 to −6.20) | −7.20 (−8.48 to −5.93) | −5.97 (−7.23 to −4.71) | −5.87 (−7.13 to −4.61) | −5.97 (−7.28 to −4.65) |
| A little of the time | −9.28 (−10.79 to −7.76) | −9.67 (−11.33 to −8.01) | −6.90 (−8.50 to −5.31) | −6.75 (−8.34 to −5.17) | −7.47 (−9.19 to −5.76) |
| None of the time | −12.78 (−15.34 to −10.22) | −15.15 (−18.13 to −12.17) | −9.20 (−11.80 to −6.59) | −9.01 (−11.61 to −6.41) | −11.77 (−14.77 to −8.78) |
| All of the time | Reference | Reference | Reference | Reference | Reference |
| Nursing care | N = 6,432 | N = 5,429 | N = 6,432 | N = 6,432 | N = 5,429 |
| R 2 = 0.03 (0.02–0.03) | R 2 = 0.03 (0.02–0.03) | ||||
| Most of the time | −2.81 (−3.97 to −1.64) | −2.66 (−3.85 to −1.47) | −2.47 (−3.65 to −1.29) | −2.60 (−3.79 to −1.42) | −2.35 (−3.56 to −1.42) |
| Some of the time | −6.29 (−7.57 to −5.00) | −5.89 (−7.23 to −4.55) | −5.70 (−7.04 to −4.35) | −5.91 (−7.25 to −4.57) | −5.50 (−6.90 to −4.10) |
| A little of the time | −8.61 (−10.21 to −7.02) | −8.67 (−10.41 to −6.93) | −7.76 (−9.45 to −6.07) | −8.10 (−9.78 to −6.41) | −8.17 (−9.99 to −6.35) |
| None of the time | −9.47 (−12.15 to −6.78) | −10.81 (−13.94 to −7.68) | −8.29 (−11.06 to −5.52) | −8.71 (−11.48 to −5.94) | −10.20 (−13.38 to −7.02) |
| All of the time | Reference | Reference | Reference | Reference | Reference |
| Care coordination | N = 6,311 | N = 5,339 | N = 6,311 | N = 6,311 | N = 5,339 |
| R 2 = 0.05 (0.05–0.06) | R 2 = 0.05 (0.04–0.05) | ||||
| Most of the time | −2.97 (−4.04 to −1.91) | −2.74 (−3.83 to −1.65) | −2.14 (−3.19 to −1.08) | −2.27 (−3.33 to −1.22) | −1.92 (−3.00 to −0.83) |
| Some of the time | −7.73 (−8.90 to −6.56) | −6.82 (−8.04 to −5.60) | −5.88 (−7.08 to −4.67) | −6.09 (−7.30 to −4.89) | −5.28 (−6.53 to −4.03) |
| A little of the time | −10.63 (−12.09 to −9.17) | −10.31 (−11.90 to −8.72) | −7.69 (−9.21 to −6.17) | −8.03 (−9.55 to −6.51) | −7.91 (−9.55 to −6.26) |
| None of the time | −12.38 (−14.83 to −9.92) | −12.15 (−14.99 to −9.31) | −7.92 (−10.42 to −5.42) | −8.37 (−10.87 to −5.87) | −8.67 (−11.52 to −5.83) |
| All of the time | Reference | Reference | Reference | Reference | Reference |
| Quality rating | N = 6,431 | N = 5,428 | N = 6,431 | N = 6,431 | N = 5,428 |
| R 2 = 0.05 (0.05–0.06) | R 2 = 0.05 (0.04–0.05) | ||||
| Most of the time | −4.02 (−5.46 to −2.58) | −4.16 (−5.64 to −2.68) | −2.60 (−4.01 to −1.18) | −2.61 (−4.02 to −1.19) | −2.91 (−4.38 to −1.44) |
| Some of the time | −10.65 (−12.25 to −9.05) | −9.76 (−11.44 to −8.09) | −6.67 (−8.29 to −5.05) | −6.68 (−8.30 to −5.06) | −6.44 (−8.15 to −4.73) |
| A little of the time | −13.61 (−15.61 to −11.61) | −13.58 (−15.76 to −11.41) | −7.76 (−9.83 to −5.69) | −7.77 (−9.83 to −5.71) | −8.67 (−10.90 to −6.45) |
| None of the time | −19.32 (−22.73 to −15.92) | −18.95 (−22.83 to −15.07) | −11.50 (−14.90 to −8.10) | −11.52 (−14.92 to −8.12) | −12.32 (−16.18 to −8.46) |
| All of the time | Reference | Reference | Reference | Reference | Reference |
Question relates to frequency of feeling calm and peaceful.
“Unadjusted” refers to only this variable in the model, while “adjusted” means all other variables are included in the model.
For general health coefficients, the exclusion of proxy data produced small (<3 points) changes for any category. For mental health coefficients, excluding proxy data produced changes of <4 points for any category.
Results of Sensitivity Analyses
The robustness of the association of proxy responses in terms of significance and direction of effect for the proxy coefficient was supported by the logistic regression models (data not shown). Evaluation of model diagnostics suggested some violation of the assumptions of the linear models, in particular non‐normal residuals and a relationship between the predicted values and the residuals. These violations were smallest for medical care and care coordination models, and largest for nursing care and quality rating models. Logarithmic and square root transformations did not result in normally distributed data. Nonetheless, the logistic and linear models provided results that were similar.
The results of the linear models were similar regardless of the choice of imputation method. Findings regarding the value, significance, and direction of the proxy coefficient and the nonsignificance of the proxy*site interaction term were consistent across missing data approaches. For all experience outcomes, differences between the proxy coefficients by imputation approach were <1 point (Table S2). Finally, the results were only minimally affected by the addition of a survey timing variable. The absolute value of the parameter shifts were 0.01 points (medical care, care coordination), 0.05 points (nursing care), and 0.08 points (quality).
Discussion
In a survey of cancer patients with a relatively high prevalence of proxy responses and variation in the proportion of proxies across study sites, we found that reports of care experiences differed very little for proxy responses compared with patients’ responses, with higher (e.g., more positive) ratings of medical care experiences but lower (e.g., more negative) ratings of nursing care and care coordination experiences. Average proxy ratings of overall care quality did not differ significantly from average patient ratings. Additionally, mean scores across study sites were minimally affected by adjustment and the exclusion of proxy data. Although proxies tended to report worse patient general and mental health, the exclusion of these proxy‐reported health status variables produced minimal changes in the health coefficients in adjusted and unadjusted models, suggesting that proxy reports of these covariates have little impact. The results were robust to the method used for addressing missing data and how the outcome variable was operationalized.
Our overall finding that proxy responses differed only slightly from patients’ responses is consistent with previous research from populations where proxy reporting is less frequent (Zaslavsky et al. 2001). Consistent with evaluations in noncancer populations, proxy respondents tended to give slightly higher ratings of medical care experiences compared to patients (Zaslavsky et al. 2001). In stratified analyses using CanCORS data that also included reports from proxies for deceased patients and different case‐mix adjustment, similar findings of slightly better reported medical care experiences were noted for patients with lung cancer (+1.4 points on average) but not colorectal cancer (−0.4 points on average) versus proxies, although neither difference was significant (Ayanian et al. 2010).
The small proportion of outcome variation explained, as well as the small impact of case‐mix adjustment, is also consistent with previous work. The UK Cancer Patient Experience Survey found a median of 14 percent (range 3–25 percent) of variation in items explained by either clinical or sociodemographic case‐mix (Abel, Saunders, and Lyratzopoulos 2014). Studies in noncancer patient populations likewise report adjustment models explaining low proportions of outcome variation (Finkelstein et al. 1998; Zaslavsky et al. 2000, 2001; Hargraves et al. 2001).
While we did not rank care experiences and ratings across study sites because of the small number of sites, the marginalized estimates suggest that case‐mix adjustment using proxy data would have minimal impact on rankings across other types of sites, such as practices or health plans. This is consistent with other work where case‐mix adjustment produced minimal effects for overall estimates (Zaslavsky et al. 2001; Paddison et al. 2012; Abel, Saunders, and Lyratzopoulos 2014). However, while case‐mix adjustment may have only a small overall impact, it may have a larger impact on specific practices, hospitals, or sites. For example, some hospitals shifted into different performance categories after case‐mix adjustment (Abel, Saunders, and Lyratzopoulos 2014). In CanCORS, the distribution of outcome responses was highly skewed, with most respondents reporting favorable experiences and high‐quality care (Ayanian et al. 2010). This limited variation may be one reason for the small impact of proxy responses on outcomes. Ranking approaches in situations where the outcome distribution is skewed and variation is limited may artificially exacerbate differences between sites. Thus, differences in proxy prevalence across sites combined with small but significant differences have potential implications for specific sites or practices in national surveys of cancer experience.
While epidemiologic studies have considered proxy reporting of covariates (Nguyen, Wilcox, and Baird 2007) and exposures (Nelson et al. 1994; Schnitzer et al. 1995), there is limited information about situations in which proxies report both covariates and outcomes. In their evaluation of the impact of proxy reporting on care experience and quality in Medicare patients, Elliott and colleagues (Elliott et al. 2008) noted that proxy reporting of sociodemographic covariates may differ from patient report, but they did not consider self‐rated health. Epstein and colleagues evaluated the correlation of self‐ and proxy‐reported health status and satisfaction with care in a paired study of patients and proxies (Epstein et al. 1989). Our findings suggest that while proxy reports of patients' general and mental health differed from patient reports, these differences did not change the relationship between these covariates and the outcomes we examined, and the overall impact of proxy‐reported covariates on outcomes is likely minimal. It is likely that patient–proxy health status differences reflect the poorer health of patients with proxy respondents. However, this difference may also incorporate proxy reporting bias (Sneeuw, Sprangers, and Aaronson 2002). Such bias, if present, could be attenuated by our adjustment for cancer type and stage. Other clinical covariates such as performance status were not available, although performance status does not always significantly affect proxy–patient agreement for reports of health‐related quality of life (Jones et al. 2011). Future research in this area is needed. This study had several limitations. First, the response rate was 51 percent and little is known about nonrespondents; thus, the results may suffer from nonresponse bias, although the population has been shown to be demographically representative of individuals diagnosed with lung and colorectal cancer in the United States (Catalano et al. 2013). Relatedly, the exclusion of answers such as “n/a” resulted in some loss of information; the analytic cohort was ~2 percent smaller than the study sample, and some respondents did not have composite outcome scores. However, it is known that in practical applications of surveys, such as CAHPS, missing data or excluded items occur (Elliott et al. 2005; Carvajal et al. 2014). Second, the imputer and analyst differed, which could result in uncongeniality and biased multiple imputation analyses (Meng 1994). While we cannot exclude this possibility, the consistency of the results across imputation approaches is reassuring. Third, the model diagnostics suggested poor model performance and violation of the multivariate linear regression assumptions. Such issues are infrequently reported, and it is not known whether other case‐mix models also suffer from this problem. Given the goal of understanding the impact of proxy responses using standard models in a situation of higher proxy prevalence, as well as the interest in average experience and quality scores, it was deemed appropriate to present these findings. Additionally, the similar results from the logistic regression models provide support for the linear regression results despite the violations of the assumptions.
Other experience studies have reported ceiling effects (Jha et al. 2008; Ayanian et al. 2010). Experience reports from telephone interviews are more likely to be positive than those from written surveys (de Vries et al. 2005). Issues such as social desirability bias or positivity bias which may occur in telephone interviews may operate differentially for patients and proxies. These issues require further investigation.
Fourth, the CanCORS study sites are not equivalent to health plans or practices that may be evaluated using CAHPS‐type surveys. The study sites were used to illustrate the potential of proxy responses to impact estimates of interest (practice or plan‐level scores) when proxies may be more prevalent. Evaluation of nonresponse in CAHPS has indicated that both demographic factors (Zaslavsky, Zaborski, and Cleary 2002; Elliott et al. 2005; Klein et al. 2011) and plan factors (Zaslavsky, Zaborski, and Cleary 2002) play a role in nonresponse, indicating that nonresponse rates may vary across the analytic units of interest. With our findings about variation in proxy rates across study sites, it seems reasonable to expect similar variation across practices in evaluations such as the Oncology Care Model, where proxy rates may be higher than in traditional CAHPS surveys. Thus, the analysis can provide useful information about the potential for proxy responses to impact practices or other analytic units of interest.
Lastly, the study did not assess differences across proxy types (e.g., spouse/partner vs. child) or other information about proxies, such as the proxy's caregiving role or caregiver burden. While there is some indication that proxy‐related factors such as proxy–patient relationship may play a role (Elliott et al. 2008; Wehby et al. 2016), these factors are not consistently collected for publicly reported experience measures and, as such, are not typically included in case‐mix models. In light of the paper's aims, we examined the impact of proxy‐reported data using standard adjustment approaches. However, future analytic work with the dataset will further investigate the issue of proxy type. Understanding the factors that influence how proxies report on the patient's care experience and quality is an important area for future research.
This study's strengths include its large, clinically, and demographically representative population, one of the richest available datasets of its kind for patients with cancer. Additionally, it is one of the few studies to evaluate the role of proxy reporting with respect to experience and quality of care for patients with cancer. It is also one of the few studies to consider the impact of proxy reporting on outcomes as well as covariates, an issue that has received minimal attention in the research literature to date.
Conclusion
Proxy reports of care experiences and ratings of care quality have small but statistically significant differences from patient reports. While proxy‐reported health status differed from patient‐reported health status, likely reflecting a sicker population as well as possible reporting error, this did not affect the relationship between sociodemographic and clinical variables and the outcomes of interest. In similar datasets, using proxy reports of experience and quality outcomes as well as patients’ health status covariates is unlikely to shift estimates substantially, even in situations of high rates of proxy use. However, if rates of proxy use vary across practices or sites, adjusting for respondent type in the case‐mix model is likely to remain necessary.
Supporting information
Appendix SA1: Author Matrix.
Table S1. Care Experience* and Quality^ Item(s), by Domain.
Table S2. Proxy Coefficient for Outcomes in Adjusted Models by Imputation Type.
Acknowledgments
Joint Acknowledgment/Disclosure Statement: Jessica Roydhouse is supported by a Dissertation Support Grant from the Jayne Koskinas Ted Giovanis Foundation for Health and Policy, a private foundation dedicated to effecting change in health. The opinions, findings, and conclusions or recommendations expressed in this material are those of the author and not necessarily those of the Jayne Koskinas Ted Giovanis Foundation for Health and Policy, its directors, officers, or staff. Dr. Keating is supported by K24CA181510 from the National Cancer Institute (NCI). Dr. Mor is PI for HS‐0011 from the Agency for Healthcare Research and Quality. The CanCORS consortium was funded by the following NCI grants: U01CA093344, U01CA093332, U01CA093324, U01CA093348, U01CA093339, U01CA093326, and a Department of Veterans Affairs grant, CRS02‐164. Parts of this work were presented at the 9th Annual Meeting of the Cancer and Primary Care Research International (CaPRI) Network, the 22nd Annual NRSA Research Trainees Conference, the 2016 AcademyHealth Annual Research Meeting, and the ISPOR 21st Annual International Meeting.
Disclosures: None.
Disclaimer: None.
References
- Abel, G. A. , Saunders C. L., and Lyratzopoulos G.. 2014. “Cancer Patient Experience, Hospital Performance and Case Mix: Evidence from England.” Future Oncology 10 (9): 1589–98. [DOI] [PubMed] [Google Scholar]
- Agency for Healthcare Research and Quality . 2015. “Section 5: Determining Where to Focus Efforts to Improve Patient Experience” [accessed on July 5, 2015]. Available at http://www.ahrq.gov/cahps/quality-improvement/improvement-guide/5-determining-focus/index.html
- Anhang Price, R. , Elliott M. N., Zaslavsky A. M., Hays R. D., Lehrman W. G., Rybowski L., Edgman‐Levitan S., and Cleary P. D.. 2014. “Examining the Role of Patient Experience Surveys in Measuring Health Care Quality.” Medical Care Research and Review 71 (5): 522–54. [DOI] [PMC free article] [PubMed] [Google Scholar]
- Ayanian, J. Z. , Chrischilles E. A., Fletcher R. H., Fouad M. N., Harrington D. P., Kahn K. L., Kiefe C. I., Lipscomb J., Malin J. L., Potosky A. L., Provenzale D. T., Sandler R. S., van Ryn M., Wallace R. B., Weeks J. C., and West D. W.. 2004. “Understanding Cancer Treatment and Outcomes: The Cancer Care Outcomes Research and Surveillance Consortium.” Journal of Clinical Oncology 22 (15): 2992–6. [DOI] [PubMed] [Google Scholar]
- Ayanian, J. Z. , Zaslavsky A. M., Arora N. K., Kahn K. L., Malin J. L., Ganz P. A., van Ryn M., Hornbrook M. C., Kiefe C. I., He Y., Urmie J. M., Weeks J. C., and Harrington D. P.. 2010. “Patients’ Experiences with Care for Lung Cancer and Colorectal Cancer: Findings from the Cancer Care Outcomes Research and Surveillance Consortium.” Journal of Clinical Oncology 28 (27): 4154–61. [DOI] [PMC free article] [PubMed] [Google Scholar]
- Basch, E. , Snyder C., McNiff K., Brown R., Maddux S., Smith M. L., Atkinson T. M., Howell D., Chiang A., Wood W., Levitan N., Wu A. W., and Krzyzanowska M.. 2014. “Patient‐Reported Outcome Performance Measures in Oncology.” Journal of Oncology Practice 10 (3): 209–11. [DOI] [PMC free article] [PubMed] [Google Scholar]
- Bjertnaes, O. 2014. “Patient‐Reported Experiences with Hospitals: Comparison of Proxy and Patient Scores Using Propensity‐Score Matching.” International Journal for Quality in Health Care 26 (1): 34–40. [DOI] [PubMed] [Google Scholar]
- Carvajal, D. N. , Blank A. E., Lechuga C., Schechter C., and McKee M. D.. 2014. “Do Primary Care Patient Experiences Vary by Teaching Versus Nonteaching Facility?” Journal of the American Board of Family Medicine 27 (2): 239–48. [DOI] [PubMed] [Google Scholar]
- Castle, N. 2005. “Are Family Members Suitable Proxies for Transitional Care Unit Residents When Collecting Satisfaction Information?” International Journal for Quality in Health Care 17 (5): 439–45. [DOI] [PubMed] [Google Scholar]
- Catalano, P. J. , Ayanian J. Z., Weeks J. C., Kahn K. L., Landrum M. B., Zaslavsky A. M., Lee J., Pendergast J., and Harrington D. P., for the Cancer Care Outcomes Research Surveillance Consortium . 2013. “Representativeness of Participants in the Cancer Care Outcomes Research and Surveillance Consortium Relative to the Surveillance, Epidemiology, and End Results Program.” Medical Care 51 (2): e9–15. [DOI] [PMC free article] [PubMed] [Google Scholar]
- Centers for Medicare and Medicaid Services . 2016. “Oncology Care Model” [accessed on June 15, 2016]. Available at https://innovation.cms.gov/initiatives/oncology-care/
- Chaurasia, A. , and Harel O.. 2015. “Partial F‐Tests with Multiply Imputed Data in the Linear Regression Framework via Coefficient of Determination.” Statistics in Medicine 34 (3): 432–43. [DOI] [PubMed] [Google Scholar]
- Department of Health . 2012. The NHS Outcomes Framework 2013–14. London: National Health Service, Department of Health. [Google Scholar]
- Elliott, M. N. , Edwards C., Angeles J., Hambarsoomians K., and Hays R. D.. 2005. “Patterns of Unit and Item Nonresponse in the CAHPS Hospital Survey.” Health Services Research 40 (6 Pt 2): 2096–119. [DOI] [PMC free article] [PubMed] [Google Scholar]
- Elliott, M. N. , Beckett M. K., Chong K., Hambarsoomians K., and Hays R. D.. 2008. “How Do Proxy Responses and Proxy‐Assisted Responses Differ from What Medicare Beneficiaries Might Have Reported about Their Health Care?” Health Services Research 43 (3): 833–48. [DOI] [PMC free article] [PubMed] [Google Scholar]
- Elliott, M. N. , Zaslavsky A. M., Goldstein E., Lehrman W., Hambarsoomians K., Beckett M. K., and Giordano L.. 2009. “Effects of Survey Mode, Patient Mix, and Nonresponse on CAHPS Hospital Survey Scores.” Health Services Research 44 (2 Pt 1): 501–18. [DOI] [PMC free article] [PubMed] [Google Scholar]
- Epstein, A. M. , Hall J. A., Tognetti J., Son L. H., and Conant L. Jr. 1989. “Using Proxies to Evaluate Quality of Life: Can They Provide Valid Information about Patients’ Health Status and Satisfaction with Medical Care?” Medical Care 27 (3 Suppl): S91–8. [PubMed] [Google Scholar]
- von Essen, L. 2004. “Proxy Ratings of Patient Quality of Life–Factors Related to Patient‐Proxy Agreement.” Acta Oncologica 43 (3): 229–34. [DOI] [PubMed] [Google Scholar]
- Fayers, P. , and Machin D.. 2007. Quality of Life: The Assessment, Analysis and Interpretation of Patient‐Reported Outcomes. West Sussex, UK: John Wiley and Sons. [Google Scholar]
- Finkelstein, B. S. , Singh J., Silvers J. B., Neuhauser D., and Rosenthal G. E.. 1998. “Patient and Hospital Characteristics Associated with Patient Assessments of Hospital Obstetrical Care.” Medical Care 36(8 Suppl.): AS68–78. [DOI] [PubMed] [Google Scholar]
- Garfinkel, S. , Evensen C., Frentzel E., Keller S., Yost K., Crofton C., Teleki S., and Arora N.. 2014. Developing CAHPS for Cancer Care Prototype Survey: Progress and Next Steps. San Diego, CA: AcademyHealth Annual Research Meeting. [Google Scholar]
- Giesinger, J. M. , Golser M., Erharter A., Kemmler G., Schauer‐Maurer G., Stockhammer G., Muigg A., Hutterer M., Rumpold G., and Holzner B.. 2009. “Do Neurooncological Patients and Their Significant Others Agree on Quality of Life Ratings?” Health and Quality of Life Outcomes 7: 87. [DOI] [PMC free article] [PubMed] [Google Scholar]
- Giovannetti, E. R. , Reider L., Wolff J. L., Frick K. D., Boult C., Steinwachs D., and Boyd C. M.. 2013. “Do Older Patients and Their Family Caregivers Agree about the Quality of Chronic Illness Care?” International Journal for Quality in Health Care 25 (5): 515–24. [DOI] [PMC free article] [PubMed] [Google Scholar]
- Gruber‐Baldini, A. L. , Shardell M., Lloyd K. D., and Magaziner J.. 2012. “Uses of Proxies and Informants” In The Epidemiology of Aging, edited by Newman A. B., and Cauley J. A. Dordrecht, NL: Springer. [Google Scholar]
- Hall, J. A. , Milburn M. A., and Epstein A. M.. 1993. “A Causal Model of Health Status and Satisfaction with Medical Care.” Medical Care 31 (1): 84–94. [DOI] [PubMed] [Google Scholar]
- Harel, O. 2009. “The Estimation of R2 and Adjusted R2 in Incomplete Data Sets Using Multiple Imputation.” Journal of Applied Statistics 36 (10): 1109–18. [Google Scholar]
- Hargraves, J. L. , Wilson I. B., Zaslavsky A., James C., Walker J. D., Rogers G., and Cleary P. D.. 2001. “Adjusting for Patient Characteristics When Analyzing Reports from Patients about Hospital Care.” Medical Care 39 (6): 635–41. [DOI] [PubMed] [Google Scholar]
- He, Y. , Zaslavsky A. M., Landrum M. B., Harrington D. P., and Catalano P.. 2010. “Multiple Imputation in a Large‐Scale Complex Survey: A Practical Guide.” Statistical Methods in Medical Research 19 (6): 653–70. [DOI] [PMC free article] [PubMed] [Google Scholar]
- Isaac, T. , Zaslavsky A. M., Cleary P. D., and Landon B. E.. 2010. “The Relationship Between Patients’ Perception of Care and Measures of Hospital Quality and Safety.” Health Services Research 45 (4): 1024–40. [DOI] [PMC free article] [PubMed] [Google Scholar]
- Jha, A. K. , Orav E. J., Zheng J., and Epstein A. M.. 2008. “Patients’ Perception of Hospital Care in the United States.” New England Journal of Medicine 359 (18): 1921–31. [DOI] [PubMed] [Google Scholar]
- Jones, J. M. , McPherson C. J., Zimmermann C., Rodin G., Le L. W., and Cohen S. R.. 2011. “Assessing Agreement Between Terminally Ill Cancer Patients’ Reports of Their Quality of Life and Family Caregiver and Palliative Care Physician Proxy Ratings.” Journal of Pain and Symptom Management 42 (3): 354–65. [DOI] [PubMed] [Google Scholar]
- Keating, N. L. , Beth Landrum M., Arora N. K., Malin J. L., Ganz P. A., van Ryn M., and Weeks J. C.. 2010. “Cancer Patients’ Roles in Treatment Decisions: Do Characteristics of the Decision Influence Roles?” Journal of Clinical Oncology 28 (28): 4364–70. [DOI] [PMC free article] [PubMed] [Google Scholar]
- Kim, M. , Zaslavsky A. M., and Cleary P. D.. 2005. “Adjusting Pediatric Consumer Assessment of Health Plans Study (CAHPS) Scores to Ensure Fair Comparison of Health Plan Performances.” Medical Care 43 (1): 44–52. [PubMed] [Google Scholar]
- Klein, D. J. , Elliott M. N., Haviland A. M., Saliba D., Burkhart Q., Edwards C., and Zaslavsky A. M.. 2011. “Understanding Nonresponse to the 2007 Medicare CAHPS Survey.” Gerontologist 51 (6): 843–55. [DOI] [PubMed] [Google Scholar]
- Magaziner, J. , Zimmerman S. I., Gruber‐Baldini A. L., Hebel J. R., and Fox K. M.. 1997. “Proxy Reporting in Five Areas of Functional Status. Comparison with Self‐Reports and Observations of Performance.” American Journal of Epidemiology 146 (5): 418–28. [DOI] [PubMed] [Google Scholar]
- Malin, J. L. , Ko C., Ayanian J. Z., Harrington D., Nerenz D. R., Kahn K. L., Ganther‐Urmie J., Catalano P. J., Zaslavsky A. M., Wallace R. B., Guadagnoli E., Arora N. K., Roudier M. D., and Ganz P. A.. 2006. “Understanding Cancer Patients’ Experience and Outcomes: Development and Pilot Study of the Cancer Care Outcomes Research and Surveillance Patient Survey.” Supportive Care in Cancer 14 (8): 837–48. [DOI] [PubMed] [Google Scholar]
- Martinez, K. A. , Snyder C. F., Malin J. L., and Dy S. M.. 2015. “Patient‐Reported Quality of Care and Pain Severity in Cancer.” Palliative and Supportive Care 13 (4): 875–84. [DOI] [PMC free article] [PubMed] [Google Scholar]
- Meng, X.‐L. 1994. “Multiple‐Imputation Inferences with Uncongenial Sources of Input.” Statistical Science 9 (4): 538–73. [Google Scholar]
- Mosely 2nd, R. R. , and Wolinsky F. D.. 1986. “The Use of Proxies in Health Surveys. Substantive and Policy Implications.” Medical Care 24 (6): 496–510. [DOI] [PubMed] [Google Scholar]
- Nelson, L. M. , Longstreth W. T. Jr, Koepsell T. D., Checkoway H., and van Belle G.. 1994. “Completeness and Accuracy of Interview Data from Proxy Respondents: Demographic, Medical, and Life‐Style Factors.” Epidemiology 5 (2): 204–17. [DOI] [PubMed] [Google Scholar]
- Nguyen, R. H. , Wilcox A. J., and Baird D. D.. 2007. “Can Men Provide Accurate Confounder Data about Their Partners for Time‐to‐Pregnancy Studies?” Annals of Epidemiology 17 (3): 186–90. [DOI] [PubMed] [Google Scholar]
- O'Malley, A. J. , Zaslavsky A. M., Elliott M. N., Zaborski L., and Cleary P. D.. 2005. “Case‐mix Adjustment of the CAHPS Hospital Survey.” Health Services Research 40 (6 Pt 2): 2162–81. [DOI] [PMC free article] [PubMed] [Google Scholar]
- Paddison, C. , Elliott M., Parker R., Staetsky L., Lyratzopoulos G., Campbell J. L., and Roland M.. 2012. “Should Measures of Patient Experience in Primary Care Be Adjusted for Case Mix? Evidence from the English General Practice Patient Survey.” BMJ Quality and Safety 21 (8): 634–40. [DOI] [PMC free article] [PubMed] [Google Scholar]
- Perruccio, A. V. , and Badley E. M.. 2004. “Proxy Reporting and the Increasing Prevalence of Arthritis in Canada.” Canadian Journal of Public Health 95 (3): 169–73. [PubMed] [Google Scholar]
- Raghunathan, T. , and Dong Q.. 2011. Analysis of Variance From Multiply Imputed Data Sets. Ann Arbor, MI: University of Michigan. [Google Scholar]
- Rothman, M. L. , Hedrick S. C., Bulcroft K. A., Hickam D. H., and Rubenstein L. Z.. 1991. “The Validity of Proxy‐Generated Scores as Measures of Patient Health Status.” Medical Care 29 (2): 115–24. [DOI] [PubMed] [Google Scholar]
- Schnitzer, P. G. , Olshan A. F., Savitz D. A., and Erickson J. D.. 1995. “Validity of Mother's Report of Father's Occupation in a Study of Paternal Occupation and Congenital Malformations.” American Journal of Epidemiology 141 (9): 872–7. [DOI] [PubMed] [Google Scholar]
- Sitoh, Y. Y. , Lau T. C., Zochling J., Cumming R. G., Lord S. R., Schwarz J., March L. M., Sambrook P. N., and Cameron I. D.. 2003. “Proxy Assessment of Health‐Related Quality of Life in the Frail Elderly.” Age and Ageing 32 (4): 459–61. [DOI] [PubMed] [Google Scholar]
- Sneeuw, K. C. , Sprangers M. A., and Aaronson N. K.. 2002. “The Role of Health Care Providers and Significant Others in Evaluating the Quality of Life of Patients With Chronic Disease.” Journal of Clinical Epidemiology 55 (11): 1130–43. [DOI] [PubMed] [Google Scholar]
- Sneeuw, K. C. , Aaronson N. K., Sprangers M. A., Detmar S. B., Wever L. D., and Schornagel J. H.. 1998. “Comparison of Patient and Proxy EORTC QLQ‐C30 Ratings in Assessing the Quality of Life of Cancer Patients.” Journal of Clinical Epidemiology 51 (7): 617–31. [DOI] [PubMed] [Google Scholar]
- Stricker, K. H. , Kimberger O., Brunner L., and Rothen H. U.. 2011. “Patient Satisfaction With Care in the Intensive Care Unit: Can We Rely on Proxies?” Acta Anaesthesiologica Scandinavica 55 (2): 149–56. [DOI] [PubMed] [Google Scholar]
- Sullivan, D. M. , and Andridge R. R.. 2012. Hosmer‐Lemeshow Goodness of Fit Test for Multiply Imputed Data. Washington, DC: Eastern North American Region International Biometric Society Spring Meeting. [Google Scholar]
- Tamim, H. , McCusker J., and Dendukuri N.. 2002. “Proxy Reporting of Quality of Life Using the EQ‐5D.” Medical Care 40 (12): 1186–95. [DOI] [PubMed] [Google Scholar]
- Todorov, A. , and Kirchner C.. 2000. “Bias in Proxies’ Reports of Disability: Data from the National Health Interview Survey on Disability.” American Journal of Public Health 90 (8): 1248–53. [DOI] [PMC free article] [PubMed] [Google Scholar]
- de Vries, H. , Elliott M. N., Hepner K. A., Keller S. D., and Hays R. D.. 2005. “Equivalence of Mail and Telephone Responses to the CAHPS Hospital Survey.” Health Services Research 40 (6 Pt 2): 2120–39. [DOI] [PMC free article] [PubMed] [Google Scholar]
- Walling, A. M. , Weeks J. C., Kahn K. L., Tisnado D., Keating N. L., Dy S. M., Arora N. K., Mack J. W., Pantoja P. M., and Malin J. L.. 2015. “Symptom Prevalence in Lung and Colorectal Cancer Patients.” Journal of Pain and Symptom Management 49 (2): 192–202. [DOI] [PMC free article] [PubMed] [Google Scholar]
- Wehby, G. L. , Jones M. P., Ullrich F., Lou Y., and Wolinsky F. D.. 2016. “Does the Relationship of the Proxy to the Target Person Affect the Concordance between Survey Reports and Medicare Claims Measures of Health Services Use?” Health Services Research 51 (1): 314–27. [DOI] [PMC free article] [PubMed] [Google Scholar]
- Wilson, I. B. , Ding L., Hays R. D., Shapiro M. F., Bozzette S. A., and Cleary P. D.. 2002. “HIV Patients’ Experiences with Inpatient and Outpatient Care: Results of a National Survey.” Medical Care 40 (12): 1149–60. [DOI] [PubMed] [Google Scholar]
- Young, G. J. , Meterko M., and Desai K. R.. 2000. “Patient Satisfaction with Hospital Care: Effects of Demographic and Institutional Characteristics.” Medical Care 38 (3): 325–34. [DOI] [PubMed] [Google Scholar]
- Zaslavsky, A. M. , Zaborski L. B., and Cleary P. D.. 2002. “Factors Affecting Response Rates to the Consumer Assessment of Health Plans Study Survey.” Medical Care 40 (6): 485–99. [DOI] [PubMed] [Google Scholar]
- Zaslavsky, A. M. , Hochheimer J. N., Schneider E. C., Cleary P. D., Seidman J. J., McGlynn E. A., Thompson J. W., Sennett C., and Epstein A. M.. 2000. “Impact of Sociodemographic Case Mix on the HEDIS Measures of Health Plan Quality.” Medical Care 38 (10): 981–92. [DOI] [PubMed] [Google Scholar]
- Zaslavsky, A. M. , Zaborski L. B., Ding L., Shaul J. A., Cioffi M. J., and Cleary P. D.. 2001. “Adjusting Performance Measures to Ensure Equitable Plan Comparisons.” Health Care Financing Review 22 (3): 109–26. [PMC free article] [PubMed] [Google Scholar]
Associated Data
This section collects any data citations, data availability statements, or supplementary materials included in this article.
Supplementary Materials
Appendix SA1: Author Matrix.
Table S1. Care Experience* and Quality^ Item(s), by Domain.
Table S2. Proxy Coefficient for Outcomes in Adjusted Models by Imputation Type.