

Abstract
Background/Objectives
The clinical relevance of the metabolically healthy overweight/obese (MHO) phenotype is controversial and the relationships between weight change and the development of cardiometabolic risk factors is unknown. Therefore, we aim to: 1) Assess the long-term risk of developing one or more components of the metabolic syndrome in MHO adults compared with metabolically healthy normal weight (MHNW); 2) Evaluate risk of a composite of death, CVD, and risk of developing type 2 diabetes between adults defined according to baseline BMI and metabolic health.
Subjects/Methods
Retrospective cohort study of adults 18–65 years of age seen at our institution between 1998 and 2000 who lived in Olmsted County. Metabolically healthy was defined as the absence of all components of the metabolic syndrome (except for waist circumference). Main outcome was the development of metabolic risk factors. The secondary outcome was a composite of mortality, CVD and heart failure.
Results
Of the 18071 individuals with complete data at baseline, 1805 (10%) were MHO (mean age 38 ± 11 years) and 3048 were MHNW (mean age 35 ± 11 years). After a median follow up of 15 years, IQR 10–17, 80% of MHO vs. 68% of MHNW developed at least one cardiometabolic risk factor (p < 0.001). In multivariate analysis, MHO individuals who gained ≥ 10% of their body weight were more likely to have developed metabolic complications compared to MHO individuals that did not gain weight (p=0.001 for 10–15%, p< 0.001 for > 15% weight gain). The risk for the secondary composite endpoint was similar between MHO and MHNW, number of events 218/1805 vs. 217/3048 for MHO and MHNW, respectively, (HR: 1.16, 95% CI 0.96–1.40).
Conclusions
MHO are more likely to develop metabolic complications than MHNW, especially if they gain weight.
Keywords: Obesity, weight gain, metabolic health, cardiovascular disease, diabetes
Introduction
Obesity is associated with cardio-metabolic complications such as, hyperglycemia, diabetes and hypertriglyceridemia (1). However, some overweight and obese individuals have no clinical evidence of these complications. This condition has been termed “metabolically healthy overweight/obesity” (MHO), and there is debate as to whether people with the MHO phenotype are at increased risk for cardiovascular disease (CVD), diabetes or premature mortality.
The definition of MHO varies between studies (2–4); with some investigators requiring the absence of all components of the metabolic syndrome, while others define metabolic health as the absence of 2 or more components with or without the HOMA index, inflammatory markers or hepatic triglyceride content as part of the diagnostic criteria (5). Given the significant variability in definitions, it is not surprising that the reported prevalence of MHO ranges between 3% and 44% (6).
Likewise, the long-term clinical implications of the MHO phenotype, such as CVD and mortality risk, have been debated. Observational studies report different risks for CVD and mortality in MHO compared to metabolically healthy normal weight (MHNW) adults (7–9). Some studies have found greater risk of CVD (7,10) in MHO than MHNW. It has been argued that the MHO phenotype is time dependent, and that over time the majority will develop metabolic complications(11). In contrast, other studies have found that MHO adults are not at increased risk for CVD and mortality compared to MHNW (8,12,13). However, the follow up evaluating the risk for metabolic complications in MHO has been somewhat limited (3,6,13). Furthermore, the role of weight gain as a factor in the causal pathway for the development of these complications is unknown.
Given these uncertainties our goal was to test the following null hypotheses: 1) MHO and MHNW adults are equally likely to develop cardiometabolic risk factors; 2) MHO and MHNW adults are at the same risk for CVD, mortality and diabetes. In order to test our hypotheses we examined: 1) the frequency of development of cardiometabolic risk factors in MHO and MHNW; 2) the relationship between weight gain and development of cardiometabolic risk factors; 3) the risk of a composite end point of death, CVD, CHF and diabetes in MHO and MHNW compared to metabolically unhealthy normal weight and obese adults.
Subjects and Methods
Patient selection and clinical information
This study was approved by the Mayo Clinic Institutional Review Board. All adults, 18–65 years of age who were seen in ambulatory clinic visits at Mayo Clinic, Rochester between January, 1998 and December, 2000 and who lived in Olmsted County, Minnesota were identified. Only adults for whom all the components of the metabolic syndrome (except for waist circumference) and weight were measured in 1998–2000 were included in this retrospective study. Height was also required to calculate their BMI and was used if it was obtained between 1998 and 2015. We excluded individuals with a diagnosis of diabetes, cardiovascular disease (stroke, coronary disease or peripheral artery disease) or heart failure at baseline.
The Mayo Clinic Life Sciences System using the Data Discovery and Query Builder (DDQB) tool was used to identify adults seen between 1998 and 2000. This database captured all outpatient and inpatient visits to Mayo Clinic, Rochester MN. The Advanced Cohort Explorer (ACE), a clinical data repository, was used to obtain the study variables.
Definition of metabolic health
Individuals were categorized at baseline into one of four groups according to BMI as defined by the WHO (normal BMI 18.5–24.9 kg/m2, overweight/obese BMI ≥25 kg/m2) (14) and presence of metabolic syndrome components: 1)MHNW; 2) MHO; 3) metabolically unhealthy normal weight (MUNW); 4) metabolically unhealthy overweight or obese (MUO).
The International Diabetes Federation criteria for metabolic syndrome were used to define its components (15), which are: SBP ≥ 135 mmHg, DBP≥ 85 mm Hg, fasting glucose ≥ 5.6 mmol/l, triglycerides ≥ 1.69 mmol/l, and high density cholesterol (HDL-C) < 1.03 mmol/l in men and < 1.29 mmol/l in women. Metabolically unhealthy was defined if at least one of the components of the metabolic syndrome was present at baseline. Individuals were considered metabolically healthy if they had none of the components of the metabolic syndrome at baseline (except for waist circumference). Waist circumference was not included in our study because it was rarely measured at our institution. A diagnosis of hypertension, dyslipidemia and type 2 diabetes was identified using the International Classification of Diseases, Ninth Edition (ICD-9) diagnosis codes to identify those with normal metabolic factors (blood pressure, lipids) on pharmacologic therapy. Weight gain was defined as percent weight change at last follow up compared to weight at baseline. The presence of comorbidities, such as, chronic kidney disease (CKD), chronic liver disease, chronic obstructive pulmonary disease (COPD) and malignancy at baseline were determined based on ICD-9 diagnosis of codes. The diagnosis of malignancy at baseline was based on the presence of the 8 most prevalent cancers in general (Supplementary Information).
Definition of outcomes
Primary Outcome
Our primary outcome was the development of cardiometabolic risk factors among the MHO and MHNW. These were assessed only for individuals classified at baseline as MHO or MHNW and they were defined as the appearance of any of the components of the metabolic syndrome or a diagnosis of hypertension, type 2 diabetes, dyslipidemia, cardiovascular disease (CVD) or heart failure based on the ICD-9 diagnosis codes at follow up (Supplementary Information). CVD was defined as a new diagnosis of coronary artery disease, myocardial infarction, peripheral vascular disease (PVD), or stroke. Only individuals who had all the components of the metabolic syndrome assessed after at least 8 years of follow up after baseline were included in the analysis of cardiometabolic complications. Last date of follow up was November, 2015.
Secondary Outcomes
We evaluated differences in risk of a composite of death, CVD and heart failure, and differences in risk of type 2 diabetes between the groups defined according to BMI and metabolic health.
All 4 groups, MHNW, MUNW, MHO, MUO were included in the analysis of the secondary aim to compare their risk of death, CVD, or diabetes and the MHNW group was used as the reference group. We also performed a secondary analysis where we subdivided MHO and MUO into overweight and obese groups according to BMI. Individuals were followed until November, 2015.
Evaluation of extracted data
To ensure the accuracy of the variables extracted electronically using ACE we manually reviewed the medical records of patients with outlier values for blood pressure (n= 233 records), glucose (n=49 records), lipids (n= 17 records) and also randomly selected 160 records to assess the accuracy of weights and heights abstracted by ACE. We found 100% agreement between the two methods from the data we extracted (kappa=1.0). To be more confident that we obtained fasting glucose concentrations, only samples drawn between 6:00h and 10:00h were extracted.
The ICD-9 codes used for hypertension, diabetes, coronary artery disease, and congestive heart failure have been previously validated and found to have >90% predictive value (PPV) (16). The PPV for the ICD-9 codes used for stroke is > 75% (16,17). For PVD we used a combination of CPT-procedure codes in addition to ICD-9 codes (PPV > 90%) (18), because the accuracy of ICD-9 codes alone in identifying cases of PVD is lower.
Statistical Analysis
Continuous variables were expressed as mean ± standard deviation (SD) or median, interquartile range (IQR), when appropriate. Categorical variables were expressed as proportions. Logistic regression was used to examine the association between weight change and the development of cardiometabolic risk complications for MHO and MHNW groups given that data on metabolic syndrome components was cross-sectional. The model was adjusted for age, sex, BMI at baseline, smoking status at baseline, time of follow up, and comorbidities at baseline (CKD, COPD, chronic liver disease and malignancy).
In all 4 groups, for the composite outcome of CVD, heart failure and mortality, we used the date the first ICD-9 diagnosis code was made or date of death, when applicable. For the risk of diabetes, we used the date the first ICD-9 diagnosis code of type 2 diabetes was made. For individuals without an event, the date of last follow up was used as the censoring date. To determine the risk of death, CVD, heart failure, and diabetes we used survival analysis, with cox proportional hazards to determine the hazard ratio and 95% confidence interval. Cause-specific Hazard Ratios were used when CVD + heart failure, or diabetes were the outcomes analyzed given the competing risk of death. The multivariable model was adjusted for age, sex, smoking status and comorbidities at baseline (CKD, COPD, chronic liver disease and malignancy). Schoenfeld residuals plots were done to check for the proportional hazard assumption for each covariate in the cox regression models. The statistical software SAS 9.3 (SAS Institute Inc. Cary, NC) was used for arrangement of the data extracted and creation of the datasets, JMP 10.0.0 (JMP, Cary, NC, USA) was used for analyses, and R software for cumulative incidence plots.
Results
We identified 40 224 adults seen at our institution between January 1998 and December 2000 without history of CVD, CHF or diabetes and in whom BMI could be calculated. Of these, 18070 had all metabolic syndrome components (except waist circumference) measured at baseline and were included in the cohort. (Figure 1).
Figure 1.
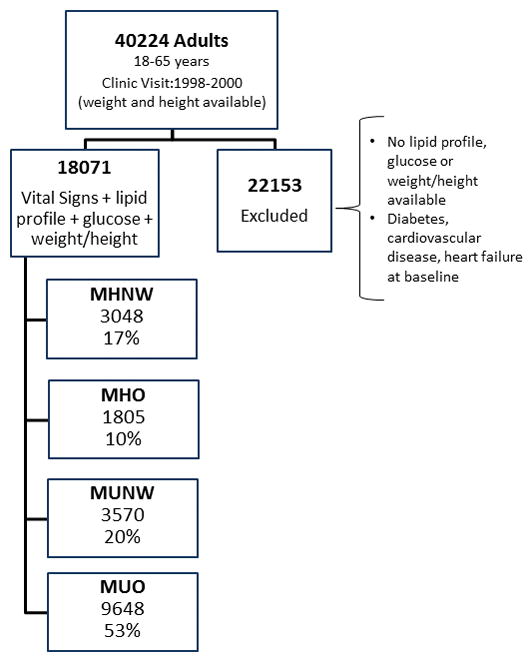
Adults classified according to body mass index category and metabolic health at baseline. DM refers to diabetes, CVD refers to cardiovascular disease, CHF refers to heart failure. MHNW refers to metabolically healthy normal weight, MHO refers to metabolically healthy overweight or obese, MUNW refers to metabolically unhealthy normal weight, MUO refers to metabolically unhealthy overweight or obese.
We excluded 22 154 individuals who did not have data for all of the variables required to define their metabolic risk. The excluded individuals were on average 5 years younger than the included participants and more likely to be of normal BMI (44%) than the included sample (37% normal BMI). Those in the excluded group with a lipid profile had fasting serum triglyceride concentrations that averaged 0.07 mmol/l less in normal BMI, 0.19 mmol/l less in overweight and 0.28 mmol/l less in obese categories compared with the included participants in the same BMI categories (Supplementary Table).
The prevalence of MHO in our study population was 10% (1805/18071) and their baseline characteristics are described in Table 1. Those in the MUO group were the oldest and the MHNW individuals were the youngest (p<0.001, for the comparison of age between groups).
Table 1.
Baseline Characteristics
| Groups According to BMI and Metabolic Risk Factors | |||||
|---|---|---|---|---|---|
| MHNW (3048) | MHO (1805) | MUNW (3570) | MUO (9648) | P-value | |
| Clinical Characteristics at Baseline in 18071 adults | |||||
| Age | 35±11 | 38±11 | 40±13 | 44±12 | <0.001 |
| Sex, Female n (%) | 2370 (78%) | 1134 (63%) | 2477 (69%) | 5242 (55%) | <0.001 |
| Race | |||||
| White, n (%) | 2367 (78%) | 1545 (85%) | 2865 (80%) | 8669 (89%) | |
| Black | 36 (1.2%) | 34 (1.9%) | 36 (1%) | 100 (1%) | |
| Asian | 119 (4%) | 27 (1.5%) | 173 (5%) | 133 (1.4%) | |
| Other/Unknown | 525 (17%) | 198 (11%) | 495 (14%) | 746 (8%) | |
| Smoker | 313 (10.3%) | 180 (10%) | 475 (13%) | 1090 (11%) | 0.007 |
| Liver disease | 4 (0.1%) | 15 (1%) | 21 (0.5%) | 127 (1.3%) | 0.001 |
| COPD | 9 (0.3%) | 6 (0.3%) | 11 (0.3) | 38 (0.4%) | 0.81 |
| CKD | 0 (0%) | 1 (0.1%) | 19 (0.5%) | 26 (0.3%) | 0.001 |
| Malignancy | 25 (0.8%) | 32 (1.8%) | 71 (2%) | 221 (2.2%) | 0.001 |
| Characteristics at baseline that define the groups a | |||||
| BMI (kg/m2) | 22.1 ± 1.7 | 28.8 ± 4.1 | 22.6 ± 1.7 | 31.5 ± 5.6 | <0.001 c |
| TG (mmol/l) | 0.93 ± 0.3 | 1.02 ± 0.3 | 1.44 ± 0.9 | 1.98 ± 1.3 | <0.001d |
| HDL-C (mmol/l) | 1.63 ± 0.3 | 1.53 ± 0.3 | 1.45 ± 0.4 | 1.29 ± 0.4 | <0.001d |
| Glucose (mmol/l) | 4.89 ± 0.3 | 5.00 ± 0.3 | 5.17 ± 0.6 | 5.4 ± 0.6 | <0.001d |
| SBP (mmHg) | 115 ± 10 | 118 ± 10 | 126 ± 16 | 131 ± 16 | <0.001d |
| DBP (mmHg) | 71 ± 7.5 | 73 ± 7.1 | 77 ± 10 | 82 ± 10 | <0.001d |
| Hypertension, n (%)b | 0 | 0 | 620 (17.4%) | 2911 (30.2%) | |
| Dyslipidemia, n (%)b | 0 | 0 | 1046 (29.3%) | 4116 (42.7%) | |
MHNW refers to metabolically healthy normal weight, MHO refers to metabolically healthy overweight or obese, MUNW refers to metabolically unhealthy normal weight, MUO refers to metabolically unhealthy overweight or obese.
BMI refers to body mass index, TG refers to triglycerides, HDL-C refers to high density lipoprotein cholesterol, SBP refers to systolic blood pressure, DBP refers to diastolic blood pressure, CKD refers to chronic kidney disease, COPD refers o chronic obstructive pulmonary disease.
Continuous variables expressed as mean ± SD
History of hypertension and dyslipidemia determined based on ICD-9 diagnosis code at baseline
P-value for the comparison between MHNW and MUNW, and between MHO and MUO
P-value for the comparison between MHNW and MHO, and between MUNW and MUO
Development of cardiometabolic risk factors/complications
Follow up data was available for 62% (1118/1805) of MHO and 48% (1462/3047) of MHNW for analysis of metabolic outcomes. After a mean follow up of 16 ± 2.2 years (median 15 years [IQR, 10–17]), 80% (898/1118) of MHO and 68% (1002/1462) of MHNW subjects developed one or more cardiometabolic risk factor or complications (p < 0.001, MHO vs. MHNW). Weight gain was significantly different between those who did and did not develop cardiometabolic risk factors/complications. MHO who developed cardiometabolic risk factors/complications gained 6 ± 14% of their body weight (4.9 ± 11.8 kg) compared to 5 ± 14% (3.9 ± 11.3 kg) for those that remained “healthy”. Likewise, MHNW who developed cardiometabolic risk factors/complications gained 10 ± 14% of their body weight (6.2 ± 8.9 kg) compared to 8 ± 12% (4.9 ± 7.1 kg) in MHNW that did not. The relationship between weight change and development of cardiometabolic complications was not linear therefore, percent of weight gain was converted into categories and those that did not gain or lost weight were designated the reference group (Table 2). Among the MHNW, the relationship between weight gain and development of cardiometabolic complications was the strongest for those who gained > 15% of their body weight (OR: 2.9, 95% CI 2–4.3) after adjusting for age at baseline, BMI at baseline, sex, duration of follow up, smoking status and comorbidities at baseline. For the MHO group those that gained ≥ 10% of their body weight were more likely to have developed metabolic complications than those who did not gain or lost weight (OR for 10–15% weight gain: 2.4, 95% CI 1.4–4.2, and OR for >15% weight gain: 2.5, 95% CI 1.6–3.96).
Table 2.
Development of metabolic complications in metabolically healthy normal weight (MHNW) and metabolically healthy overweight or obese (MHO) according to weight gain percent
| Percent weight gain | MHNW Na (%) | Odds ratiob (95% CI) | MHO Na (%) | Odds ratio (95% CI) |
|---|---|---|---|---|
| ≤ 0%c | 211(64%) | 270 (76%) | ||
| >0 & <5% | 183 (67%) | 1.17 (0.81–1.69) | 153 (79%) | 1.30 (0.83–2.07) |
| 5–10% | 169 (68%) | 1.45 (0.99–2.13) | 131 (80%) | 1.43 (0.89–2.33) |
| 10–15% | 115 (61%) | 1.23 (0.82–1.86) | 121 (85%) | 2.39 (1.39–4.25) |
| >15% | 282 (74%) | 2.96 (2.05–4.29) | 178 (81%) | 2.47 (1.57–3.96) |
N refers to number of individuals that developed metabolic complications.
Model adjusted for age at baseline, sex, BMI at baseline, time of follow up and smoking status, chronic kidney disease, chronic liver disease, chronic obstructive pulmonary disease, malignancy.
Reference group used for estimation of odds ratio.
Elopment ss <0% of their initiaoc complication in those that loss 0–5% of their body weight compared to those that loss <0% of tMetabolic complications were defined as the development of any of the components of the metabolic syndrome (except for waist circumference) or diagnosis of cardiovascular disease, heart failure or diabetes at least at 8 years follow up.
Among the metabolically healthy overweight/obese group, 40% of overweight patients became obese at follow up. In addition, more metabolically healthy patients that became obese developed cardiometabolic risk factors/complications compared to those who remained overweight (24% vs 21%; p=0.02).
Age was a confounder for the association between weight change and development of cardiometabolic risk factors/complications. There was a positive relationship between development of cardiometabolic risk factors/complications and age for both MHO and MHNW groups, but a modest negative correlation between age and weight gain, r=−0.36 (p < 0.001) and −0.35 (p < 0.001) for MHNW and MHO, respectively.
Risk of death, CVD and diabetes
The adjusted risk for the composite endpoint: mortality, CVD and CHF in MHO, MUNW, MUO compared to MHNW (reference group) is depicted in Figure 2. The risk for the composite endpoint in MHO was not significantly different from MHNW. However, MHO individuals who gained > 10% of their body weight were at greater risk for the composite endpoint compared to those that gained < 5% of their body weight (p= 0.003). There was no association between weight change and the composite endpoint for MHNW or MUO adults.
Figure 2.
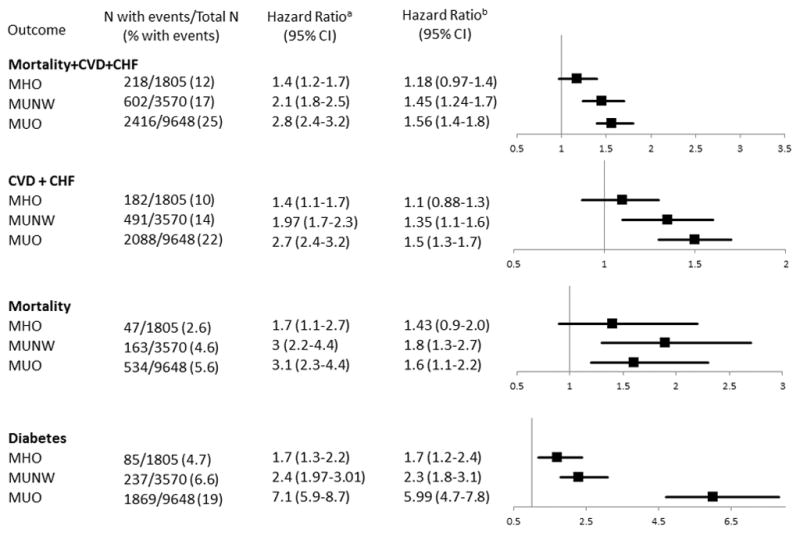
Risk of Death, CVD, CHF & Type 2 DM
CVD refers to cardiovascular disease, CHF refers to congestive heart failure. MHO refers to metabolically healthy overweight or obese, MUNW refers to metabolically unhealthy normal weight; MUO refers to metabolically unhealthy overweight or obese.
aUnivariate model. b Model adjusted for age, sex, smoking status at baseline, chronic kidney disease, chronic liver disease, chronic obstructive pulmonary disease and malignancy at baseline.
The risks for each component of the composite endpoint, in addition to the risk of type 2 diabetes are also shown in Figure 2. Cumulative Incidence and Kaplan Meier curves for the secondary endpoints are illustrated in Figure 3.
Figure 3.

Cardiovascular outcomes, diabetes and death from any cause between groups classified according to BMI and metabolic health.
Kaplan Meier Curves for the composite endpoint CVD, heart failure and death (Part A) and for the secondary endpoints death from any cause (Part C), cumulative incidence for CVD + CHF (Part B), and cumulative incidence for type 2 diabetes (Part D) of the groups classified according to BMI and metabolic health. The “cmprsk” package from R was used to estimate cumulative incidence. MHNW refers to metabolically healthy normal weight, MHO refers to metabolically healthy overweight or obese, MUNW refers to metabolically unhealthy normal weight; MUO refers to metabolically unhealthy overweight or obese.
There was an interaction between age and the groups defined according to metabolic health when the endpoint analyzed was CVD + CHF. For MHNW and MHO, age was more strongly associated with CVD + CHF than for MUNW and MUO (HR [95% CI] for MHNW 1.1 [1.07–1.1], MHO 1.1 [1.07–1.1], MUNW 1.06 [1.06–1.07], and MUO 1.06 [1.06–1.07]).
The results for the composite endpoint did not change if metabolically healthy overweight individuals were analyzed separately from the metabolically healthy obese (Table 3).
Table 3.
Hazard ratio for composite of CVD, CHF and Mortality in overweight and obese compared to normal weight according to metabolic health status at baseline
| Groups according to BMI category and metabolic health | |||||||||
|---|---|---|---|---|---|---|---|---|---|
| Overweight | Obese | ||||||||
| MHNWa | Metabolically Healthy | Metabolically Unhealthy | Metabolically Healthy | Metabolically Unhealthy | |||||
| Outcome | N (%) | N (%) | HR (95% CI) | N (%) | HR (95% CI) | N (%) | HR (95% CI) | N (%) | HR (95% CI) |
| Unadjusted Analysis | |||||||||
| Mortality, CVD + CHF | 217 (7.1) | 158 (12) | 1.42 (1.16–1.74) | 1116 (24) | 2.64 (2.29–3.07) | 60 (13) | 1.49 (1.11–1.97) | 1300 (26.4) | 2.88 (2.50–3.33) |
| Diabetes | 65 (2.1) | 54 (4) | 1.58 (1.10–2.27) | 599 (13) | 4.61 (3.59–6.01) | 31 (6.9) | 2.56 (1.65–3.89) | 1270 (25.8) | 10.13 (7.97–13.13) |
| Adjusted Analysis | |||||||||
| Mortality, CVD + CHF | 217 (7.1) | 158 (12) | 1.14 (0.92–1.39) | 1116 (24) | 1.38 (1.19–1.61) | 60 (13) | 1.24 (0.92–1.64) | 1300 (26.4) | 1.72 (1.48–2.00) |
| Diabetes | 65 (2.1) | 54 (4) | 1.45 (1.01–2.08) | 599 (13) | 3.6 (2.80–4.71) | 31 (6.9) | 2.39 (1.54–3.63) | 1270 (25.8) | 8.35 (6.55–10.84) |
Reference group
Adjusted analysis is adjusted by age, sex, smoking status, chronic kidney disease, chronic liver disease, chronic obstructive pulmonary disease, malignancy
MHNW refers to metabolically healthy normal weight. HR refers to hazard ratio, CVD refers to cardiovascular disease, CHF refers to heart failure.
There was a progressive increase in risk of type 2 diabetes with MUO individuals having the highest risk, followed by the MUNW, and the MHO group.
Discussion
In this retrospective cohort study we examined the long-term risk for metabolic complications in MHO compared to MHNW. We also evaluated the risk of death, CVD and type 2 diabetes in MHNW, MHO, MUNW and MUO. Our main findings were: 1) Over ¾ of MHO individuals and over 2/3 of MHNW individuals with available follow up developed cardiometabolic risk factors/complications; 2) Weight gain was associated with development of cardiometabolic risk factors/complications in MHO (if they gained ≥ 10% of their body weight) and in MHNW individuals (if they gained >15% of their body weight); 3) For those who were MHO at baseline, the risk for CVD and death was similar to MHNW during follow up, but those who were MUO and MUNW at baseline had significantly greater risk.
The relevance of classifying overweight and obese individuals as metabolically healthy or metabolically unhealthy has been questioned. Tomiyama et al.(19) reported that 47% of overweight and 29% of obese individuals are potentially misclassified as unhealthy when using BMI as a surrogate marker of metabolic health. However, this was a cross sectional study, and such statement implies a relatively permanent metabolically healthy state. In contrast, recent cohort studies have reported that 30–50% of MHO individuals develop metabolic risk factors, but these studies did not assess risk in a comparative group (MHNW) or included overweight/obese individuals with a metabolic risk factor present at baseline (2,3,20). In addition, duration of follow up in most studies is < 10 years, which may be insufficient for assessing CVD and mortality risk. In a prospective study with 20 years follow up complete data for metabolic complications was available for only 16% of the MHO at baseline (20). In our cohort, 76% of MHO at baseline had follow up of at least 10 years and 42% had follow up of at least 15 years.
Our results support the notion that an individual’s metabolic phenotype is dynamic, especially if weight gain occurs. This is evidence by the finding that 68% of MHNW, developed a metabolic abnormality during follow-up.
Weight gain is associated with development of cardiometabolic risk factors (21,22), but there is limited evidence for an association between weight gain and the development of these risk factors in MHO (2,23). Cui et al. (23) reported that weight loss in MHO and MHNW individuals was associated with small or no changes in cardiometabolic risk factors and that > 3% weight gain at 3 years was associated with increases in blood pressure, as well as blood glucose and triglyceride concentrations in MHO. Schroder et al (2) found that increases in BMI in overweight, but not obese, were significantly associated with transitioning from MHO to a metabolically abnormal phenotype at 10 years. We found that after an average of 16 years of follow up, MHO and MHNW who gained weight were more likely to develop risk factors/complications. Those MHNW and MHO who gained > 15% and ≥ 10% of their body weight, respectively, were at significantly greater risk than those that did not gain weight. This might imply that normal weight adults need to gain more relative (but not absolute) weight than overweight/obese adults to develop metabolic risk factors/complications.
As expected, older age at baseline was associated with development of metabolic complications; however, age was negatively correlated with weight gain in all 4 groups. This finding has been described in other observational studies, where those in their 20’s gain more weight at 10 years compared to those in their 40’s (24).
We found no difference in mortality or CVD between MHO and MHNW adults. In contrast, two systematic reviews and meta-analysis reported higher risk of CVD for MHO individuals and discrepant results for mortality risk (7,10). However, the authors note significant heterogeneity among the studies included in the pooled analysis, probably because some studies included people with 1 or 2 components of the metabolic syndrome as MHO. The lack of difference between MHO and MHNW could not be attributed to the combination of overweight and obese individuals as a group because no difference was seen between overweight and obese when analyzed separately with regards to secondary outcomes. It is possible that the young age of these groups may have results in relatively fewer events and as such a difference may not be appreciated.
It is not surprising that the presence of any metabolic syndrome components would increase CVD risk. Therefore, differences in risk estimates for CVD and mortality in studies, including ours, are likely explained by different criteria used to define metabolic health. Future studies should focus on establishing clinically applicable criteria to define metabolic health with the goal of using a standardized definition to be able to compare risk among populations. We argue that the presence of any one of the metabolic syndrome risk factors should exclude someone from being considered “metabolically healthy”. Moreover we acknowledge that the absence of metabolic syndrome risk factors does not necessarily equal “metabolic health”, there are other subtle metabolic alterations such as, increased intrahepatic triglyceride fat content, and increased plasma free fatty acids that can be present in the absence of the more traditionally used metabolic factors which can explain the increased risk of cardiometabolic complications in MHO adults. Given the retrospective nature of this study, these alternative metabolic alterations could not be assessed.
Public Health Implications
Our findings suggest that both MHO and MHNW develop cardiometabolic complications in the long-term and weight gain is one of the determinants of cardiometabolic outcomes for both groups. Therefore, based on the results of our study, public health policies to avoid weight gain and promote weight loss should not be restricted to individuals with obesity related metabolic complications, but in fact, should be directed to overweight and obese adults in general. Furthermore, public health interventions on healthy lifestyle and weight maintenance should be also directed at normal weight individuals.
Strengths and Limitations
The main strength of our study is the large numbers of individuals identified at baseline with long-term follow up available. Our overall median follow up time was 15 years (IQR, 10–17). However, there are also limitations. Because this is a retrospective single-institution study, there is risk for selection bias, as sicker individuals or those with a significant family history are more likely to have been seen and had all components of metabolic syndrome assessed. This is evidenced by the higher baseline triglyceride concentration for those who were included in our study compared with those excluded. In an attempt to minimize selection bias, particularly referral bias, we only included adults living within Olmsted County. We only included adults with all the components of the metabolic syndrome examined at baseline, and this approach allowed us to identify those who were metabolically healthy. Although, some individuals had some of the components assessed with metabolic risk factors that would classify them as metabolically unhealthy at baseline, those were not included in the analysis to decrease selection bias towards the metabolically unhealthy.
Differences in fat distribution are associated with metabolic abnormalities in overweight and obese individuals. Obese individuals with fat distributed predominantly in the upper body and visceral area have increased insulin resistance in the adipose tissue, and more metabolic abnormalities, such as, hypertriglyceridemia compared to obese individuals with fat distributed predominantly in the lower body (25,26). Information on body composition, fat distribution and anthropometric values such as waist circumference were not available for analysis, therefore we were not able to assess for differences in fat distribution among overweight-obese and development of cardiometabolic complications. Likewise, socioeconomic status and lifestyle related factors, such as lack of physical activity and alcohol consumption are also potential confounders that were not obtainable from our data sources. Lastly, despite the use of multivariate models to account for potential confounders, unmeasured confounding is possible, given the retrospective nature of our study.
Conclusion
When metabolic health is defined as the absence of the components of the metabolic syndrome (except for waist circumference); the majority of MHO and MHNW will develop metabolic complications over an average of 16 years of follow-up, although MHO are more likely than MHNW. Weight gain is associated with the development of these complications. Compared to MHNW group, MHO are at greater future risk of type 2 diabetes. However, we found that mortality and CVD risk is not increased among the MHO compared to the MHNW.
Supplementary Material
Acknowledgments
Sources of support: This manuscript was supported by CTSA Grant Number TL1 TR000137 from the National Center for Advancing Translational Science (NCATS), grants DK040484 and DK045343 from the U.S. Public Health Service and the Mayo Foundation. Its contents are solely the responsibility of the authors and do not necessarily represent the official views of the NIH.
We would like to thank Dr. Arlene Calvo and Morgan Hess-Holtz from the University of South Florida Health Panama for their help with cumulative incidence analysis.
This manuscript was supported by CTSA Grant Number TL1 TR000137 from the National Center for Advancing Translational Science (NCATS), grant DK050456 from the U.S. Public Health Service and the Mayo Foundation.
Its contents are solely the responsibility of the authors and do not necessarily represent the official views of the NIH.
Footnotes
Conflict of Interest: The authors declare they have no conflict of interest.
Clinical Trial Registry: N/A
Supplementary information is available at International Journal of Obesity website.
Contributor Information
Ana Elena Espinosa De Ycaza, Division of Endocrinology, Diabetes, Metabolism and Nutrition, Department of Internal Medicine, Mayo Clinic, 200 First Street SW, Rochester, MN 55905 USA. Facultad de Medicina, Universidad de Panamá, Panama City, Republic of Panama.
Diane Donegan, Division of Endocrinology, Diabetes, Metabolism and Nutrition, Department of Internal Medicine, Mayo Clinic, 200 First Street SW, Rochester, MN 55905 USA.
Michael D. Jensen, Division of Endocrinology, Diabetes, Metabolism and Nutrition, Department of Internal Medicine, Mayo Clinic, 200 First Street SW, Rochester, MN 55905 USA. Endocrine Research Unit, Mayo Clinic, Rochester, Minnesota
References
- 1.Jensen MD, Ryan DH, Apovian CM, Ard JD, Comuzzi AG, Donato KA, et al. 2013 AHA/ACC/TOS guideline for the management of overweight and obesity in adults: a report of the American College of Cardiology/American Heart Association Task Force on Practice Guidelines and The Obesity Society. Circulation. 2014;129:S102–S138. doi: 10.1161/01.cir.0000437739.71477.ee. [DOI] [PMC free article] [PubMed] [Google Scholar]
- 2.Schroder H, Ramos R, Baena-Diez JM, Mendez MA, Canal DJ, Fito M, et al. Determinants of the transition from a cardiometabolic normal to abnormal overweight/obese phenotype in a Spanish population. Eur J Nutr. 2014;53:1345–1353. doi: 10.1007/s00394-013-0635-2. [DOI] [PubMed] [Google Scholar]
- 3.Appleton SL, Seaborn CJ, Visvanathan R, Hill CL, Gill TK, Taylor AW, et al. Diabetes and cardiovascular disease outcomes in the metabolically healthy obese phenotype: a cohort study. Diabetes Care. 2013;36:2388–2394. doi: 10.2337/dc12-1971. [DOI] [PMC free article] [PubMed] [Google Scholar]
- 4.Hinnouho GM, Czernichow S, Dugravot A, Nabi H, Brunner EJ, Kivimaki M, et al. Metabolically healthy obesity and the risk of cardiovascular disease and type 2 diabetes: the Whitehall II cohort study. Eur Heart J. 2015;36:551–559. doi: 10.1093/eurheartj/ehu123. [DOI] [PMC free article] [PubMed] [Google Scholar]
- 5.Senechal M, Wicklow B, Wittmeier K, Hay J, MacIntosh AC, Eskicioglu P, et al. Cardiorespiratory fitness and adiposity in metabolically healthy overweight and obese youth. Pediatrics. 2013;132:e85–92. doi: 10.1542/peds.2013-0296. [DOI] [PubMed] [Google Scholar]
- 6.Velho S, Paccaud F, Waeber G, Vollenweider P, Marques-Vidal P. Metabolically healthy obesity: different prevalences using different criteria. Eur J Clin Nutr. 2010;64:1043–1051. doi: 10.1038/ejcn.2010.114. [DOI] [PubMed] [Google Scholar]
- 7.Kramer CK, Zinman B, Retnakaran R. Are metabolically healthy overweight and obesity benign conditions?: A systematic review and meta-analysis. Ann Intern Med. 2013;159:758–769. doi: 10.7326/0003-4819-159-11-201312030-00008. [DOI] [PubMed] [Google Scholar]
- 8.Morkedal B, Vatten LJ, Romundstad PR, Laugsand LE, Janszky I. Risk of myocardial infarction and heart failure among metabolically healthy but obese individuals: HUNT (Nord-Trondelag Health Study), Norway. J Am Coll Cardiol. 2014;63:1071–1078. doi: 10.1016/j.jacc.2013.11.035. [DOI] [PubMed] [Google Scholar]
- 9.Ogorodnikova AD, Kim M, McGinn AP, Muntner P, Khan U, Wildman RP. Incident cardiovascular disease events in metabolically benign obese individuals. Obesity (Silver Spring) 2012;20:651–659. doi: 10.1038/oby.2011.243. [DOI] [PMC free article] [PubMed] [Google Scholar]
- 10.Zheng R, Zhou D, Zhu Y. The long-term prognosis of cardiovascular disease and all-cause mortality for metabolically healthy obesity: a systematic review and meta-analysis. J Epidemiol Community Health. 2016;70:1024–1031. doi: 10.1136/jech-2015-206948. [DOI] [PubMed] [Google Scholar]
- 11.Soriguer F, Gutierrez-Repiso C, Rubio-Martin E, Garcia-Fuentes E, Almaraz MC, Colomo N, et al. Metabolically healthy but obese, a matter of time? Findings from the prospective Pizarra study. J Clin Endocrinol Metab. 2013;98:2318–2325. doi: 10.1210/jc.2012-4253. [DOI] [PubMed] [Google Scholar]
- 12.Al Suwaidi J. Is there an increased cardiovascular risk in metabolically healthy obese individuals? Lessons from the HUNT (Nord-Trondelag Health) study. Glob Cardiol Sci Pract. 2014;2014:44–47. doi: 10.5339/gcsp.2014.24. [DOI] [PMC free article] [PubMed] [Google Scholar]
- 13.Hamer M, Stamatakis E. Metabolically healthy obesity and risk of all-cause and cardiovascular disease mortality. J Clin Endocrinol Metab. 2012;97:2482–2488. doi: 10.1210/jc.2011-3475. [DOI] [PMC free article] [PubMed] [Google Scholar]
- 14.Obesity: preventing and managing the global epidemic. Report of a WHO consultation. World Health Organ Tech Rep Ser. 2000;894:i–xii. 1–253. [PubMed] [Google Scholar]
- 15.Alberti KG, Zimmet P, Shaw J. The metabolic syndrome--a new worldwide definition. Lancet. 2005;366:1059–1062. doi: 10.1016/S0140-6736(05)67402-8. [DOI] [PubMed] [Google Scholar]
- 16.Birman-Deych E, Waterman AD, Yan Y, Nilasena DS, Radford MJ, Gage BF. Accuracy of ICD-9-CM codes for identifying cardiovascular and stroke risk factors. Med Care. 2005;43:480–485. doi: 10.1097/01.mlr.0000160417.39497.a9. [DOI] [PubMed] [Google Scholar]
- 17.Andrade SE, Harrold LR, Tjia J, Cutrona SL, Saczynski JS, Dodd KS, et al. A systematic review of validated methods for identifying cerebrovascular accident or transient ischemic attack using administrative data. Pharmacoepidemiol Drug Saf. 2012;21(Suppl 1):100–128. doi: 10.1002/pds.2312. [DOI] [PMC free article] [PubMed] [Google Scholar]
- 18.Mell MW, Pettinger M, Proulx-Burns L, Heckbert SR, Allison MA, Criqui MH, et al. Evaluation of Medicare claims data to ascertain peripheral vascular events in the Women’s Health Initiative. J Vasc Surg. 2014;60:98–105. doi: 10.1016/j.jvs.2014.01.056. [DOI] [PubMed] [Google Scholar]
- 19.Tomiyama AJ, Hunger JM, Nguyen-Cuu J, Wells C. Misclassification of cardiometabolic health when using body mass index categories in NHANES 2005–2012. Int J Obes (Lond) 2016;40:883–886. doi: 10.1038/ijo.2016.17. [DOI] [PubMed] [Google Scholar]
- 20.Bell JA, Hamer M, Sabia S, Singh-Manoux A, Batty GD, Kivimaki M. The natural course of healthy obesity over 20 years. J Am Coll Cardiol. 2015;65:101–102. doi: 10.1016/j.jacc.2014.09.077. [DOI] [PubMed] [Google Scholar]
- 21.Wei GS, Coady SA, Reis JP, Carnethon MR, Coresh J, D’Agostino RB, Sr, et al. Duration and Degree of Weight Gain and Incident Diabetes in Younger Versus Middle-Aged Black and White Adults: ARIC, CARDIA, and the Framingham Heart Study. Diabetes Care. 2015;38:2042–2049. doi: 10.2337/dc14-2770. [DOI] [PMC free article] [PubMed] [Google Scholar]
- 22.Franklin SS, Pio JR, Wong ND, Larson MG, Leip EP, Vasan RS, et al. Predictors of new-onset diastolic and systolic hypertension: the Framingham Heart Study. Circulation. 2005;111:1121–1127. doi: 10.1161/01.CIR.0000157159.39889.EC. [DOI] [PubMed] [Google Scholar]
- 23.Cui Z, Truesdale KP, Bradshaw PT, Cai J, Stevens J. Three-year weight change and cardiometabolic risk factors in obese and normal weight adults who are metabolically healthy: the atherosclerosis risk in communities study. Int J Obes (Lond) 2015;39:1203–1208. doi: 10.1038/ijo.2015.56. [DOI] [PubMed] [Google Scholar]
- 24.Lewis CE, Jacobs DR, Jr, McCreath H, Kiefe CI, Schreiner PJ, Smith DE, et al. Weight gain continues in the 1990s: 10-year trends in weight and overweight from the CARDIA study. Coronary Artery Risk Development in Young Adults. Am J Epidemiol. 2000;151:1172–1181. doi: 10.1093/oxfordjournals.aje.a010167. [DOI] [PubMed] [Google Scholar]
- 25.Jensen MD, Haymond MW, Rizza RA, Cryer PE, Miles JM. Influence of body fat distribution on free fatty acid metabolism in obesity. J Clin Invest. 1989;83:1168–1173. doi: 10.1172/JCI113997. [DOI] [PMC free article] [PubMed] [Google Scholar]
- 26.Ebbert JO, Jensen MD. Fat depots, free fatty acids, and dyslipidemia. Nutrients. 2013;5:498–508. doi: 10.3390/nu5020498. [DOI] [PMC free article] [PubMed] [Google Scholar]
Associated Data
This section collects any data citations, data availability statements, or supplementary materials included in this article.