

Abstract
Intestinal dysbiosis is implicated in alcoholic hepatitis (AH). However, changes in the circulating microbiome, its association with the presence and severity of AH and its functional relevance in AH is unknown. Qualitative and quantitative assessment of changes in the circulating microbiome were performed by sequencing bacterial DNA in subjects with moderate (n=18) or severe AH (n=19). These data were compared to heavy drinking controls (HDC) without obvious liver disease (n=19) and non-alcohol consuming controls (NAC, n=20). The data were related to endotoxin levels and markers of monocyte activation. Linear Discriminant Analysis (LDA) Effect Size (LEfSe) analysis, inferred metagenomics and predictive functional analysis using PICRUSt were performed. There was a significant increase in 16S copies/ng DNA both in MAH (p<0.01) and SAH (p<0.001) subjects. Compared to NAC, the relative abundance of phylum Bacteroidetes was significantly decreased in HDC, MAH, and SAH (p<0.001). In contrast, all alcohol consuming groups had enrichment with Fusobacteria; this was greatest for HDC and decreased progressively in MAH and SAH. Subjects with SAH had significantly higher endotoxemia (p=0.01). Compared to alcohol consuming groups, predictive functional metagenomics indicated an enrichment of bacteria with genes related to methanogenesis and denitrification. Also, both HDC and SAH showed activation of type III secretion system which has been linked to gram negative bacterial virulence. Metagenomics in SAH vs NAC predicted increased isoprenoid synthesis via mevalonate and anthranilate degradation, known modulators of gram positive bacterial growth and biofilm production respectively. In conclusion, heavy alcohol consumption appears to be the primary driver of changes in the circulating microbiome associated with a shift in its inferred metabolic functions.
Keywords: alcoholic hepatitis, circulating microbiome, heavy drinking alcoholics
INTRODUCTION
Alcohol related liver disease remains a leading cause of morbidity and mortality in many parts of the world and has been linked to a decline in population survival in the United States (1–3). The spectrum of liver disease associated with consumption of alcohol in harmful amounts includes a fatty liver to steatohepatitis with varying degrees of fibrosis to cirrhosis (4). While many patients with alcoholic steatohepatitis remain relatively asymptomatic, some individuals develop jaundice and worsening liver function and present with the clinical syndrome of alcoholic hepatitis (AH), which was defined as previously described (5).
AH is a serious form of alcohol-induced liver disease and is a common cause for liver-related hospitalization and mortality. The risk of mortality is dependent on the severity of AH which is usually assessed by the Maddrey’s discriminant function or the model for end-stage liver disease (MELD) score (6). Severe AH (MELD > 20 or Maddrey’s DF > 32) is associated with a 20–30% mortality in 4–6 weeks and up to 40% within 6 months (7–9). Current therapies are only modestly effective in affected individuals (10) underscoring the need to develop more effective preventive and therapeutic strategies against AH. This requires an in depth understanding of the pathogenesis of AH. While much is now known about the mechanisms of disease development in AH (11, 12), there are still gaps in knowledge particularly related to why only some individuals at risk develop AH and what determines the severity of the disease.
Recently, the role of the microbiome has gained attention as a contributor to the development of alcohol associated liver disease (13). Advances in molecular technology have now identified the presence of microbiota in the circulation of healthy humans by sequencing 16S rDNA bacterial genes (14). While many changes in the intestinal microbiome in those who consume large amounts of alcohol as well as those with alcohol-induced liver disease (including changes in intestinal fungi) have been described along with increased intestinal permeability, endotoxemia and activation of systemic inflammatory responses (15–19), there are no data on the circulating microbiome in patients with AH. Changes in the blood microbiota and gut-microbiome based metagenomics signature have recently been linked to liver fibrosis in obese and nonalcoholic fatty liver disease (20, 21).
As a first step in elucidating the potential role of the circulating microbiome in AH, we measured the circulating microbiome in those with moderate or severe AH and compared it to control individuals who consumed large amounts of alcohol but did not have clinical evidence of liver disease and another group of controls without liver disease who did not consume alcohol. The specific aims of this study were to determine the qualitative and quantitative changes in the microbial populations and their associated metagenome in circulation with: (1) heavy alcohol consumption, (2) the presence of AH, (3) severe AH (SAH) versus moderate AH (MAH), heavy drinking controls (HDC) and non-alcohol controls (NAC). We further related the changes in circulating microbiome to markers of monocyte activation and evaluated the interrelationship between circulating microbiome, markers of monocyte activation, and disease severity. We also evaluated the functional relevance of changes in the circulating microbiome using predictive functional metagenomics approach in this well-characterized cohort of subjects who were recruited by the Translational Research and Evolving Alcoholic Hepatitis Treatment (TREAT) consortium.
MATERIALS AND METHODS
This study was a collaborative effort between investigators from the TREAT consortium. The TREAT consortium includes three clinical sites and a data coordinating center and enrolls subjects in either a prospective registry (NCT02172898) or in to specific clinical trials for AH. Subjects with well characterized AH (MAH and SAH) and controls (HDC and NAC) were studied in this analysis. All subjects provided informed consent for these analyses and the protocols were approved at each of the participating sites by their institutional review boards. The study was conceived, executed, analyzed and written up by the investigators who take full responsibility for the contents of this manuscript.
Study cohort
AH was defined by hyperbilirubinemia along with an elevated AST without alternate cause in an individual with a history of heavy alcohol consumption for at least 6 months and with the last alcoholic beverage consumed within 6 weeks of presentation, as recently published (5). Where there was diagnostic uncertainty, a liver biopsy was performed if clinically indicated to confirm the diagnosis. Those with a MELD score > 20 were considered to have severe AH (6) whereas those with lower values were classified as moderate AH. These subjects were compared to those HDC subjects who had normal liver enzymes and bilirubin, and no clinical findings suggestive of alcoholic hepatitis. The NAC group had no clinical, laboratory or imaging evidence of liver disease. The exclusion criteria for this analysis included those with co-morbid alternate etiologies of liver disease such as hepatitis C etc., clinically overt and active infection (positive cultures, chest X-ray showing pneumonia).
Data collection and clinical evaluation
Demographic, medical history and clinical data were collected. Alcohol drinking questionnaires to determine the quantity and pattern of alcohol consumption included the ten question Alcohol Use Disorders Identification Test (AUDIT), the Time Line Follow-Back (TLFB), as well as NIAAA alcohol drinking 6 question survey. Blood samples were collected for complete blood counts, metabolic panel, hepatic panel, and coagulation tests. The tests were performed at the local pathology and chemistry lab at each site. The MELD, Child-Turcotte-Pugh (CTP) Score and Maddrey’s Discriminant Function (DF) were also recorded and patients were managed as clinically indicated based on the standard of care at each clinical center.
Circulating microbiome methodology
(see supplementary material)
Bioinformatics data processing and Statistical analysis
Linear Discriminant Analysis Effect Size (LEfSe) analysis was performed on the OTU table using the online Galaxy interface to identify bacterial taxa that were differentially abundant in groups (22). Using the LEfSe algorithm, bacterial taxa that were differentially abundant in pairwise analysis for groups were first identified and tested using the Kruskal Wallis test with adjustments for multiple comparisons (p<0.05). Principal components analyses were also performed. The identified features were then subjected to the linear discriminant analysis (LDA) model with a threshold logarithmic LDA score set at 2.0 and ranked. Respective cladograms were generated with genus at the lowest level. Quantitative plots of differential features were generated from genus level percent relative abundance data showing means with standard deviation using GraphPad Prism 6 software. Specific correlations were performed using Spearman’s coefficient. Venn diagrams were generated using the online tool jvenn (23).
Inferred metagenomics and predicted functional analysis was initiated by generating closed reference sequence clustering OTU’s in QIIME (24). The quality-filtered, demultiplexed sequences were clustered by 97% similarity. Representative sequences were picked and aligned to the sequences from the Greengenes reference collection (gg_otus_13_5.tar.gz) to assign taxonomy.
The resulting OTU table was used to generate inferred metagenome data using the online Galaxy interface for Phylogenetic Investigation of Communities by Reconstruction of Unobserved States (PICRUSt, version 1.0.0) with default settings as described (25). Briefly, the abundance values of each OTU were normalized to their respective predicted 16S rRNA copy numbers and then multiplied by the respective predicted gene counts for metagenome prediction. The resulting core output was a list of Kyoto Encyclopedia of Genes and Genomes (KEGG) orthologues and predicted gene count data for each sample. We used in house scripts to parse the output into KEGG module categories for functional pathways and structural complex hierarchies using the KEGG database (http://www.genome.jp/kegg/module.html). The output matrix containing the relative abundance of KEGG orthologous groups (KO) per sample was processed with the online Galaxy interface for LEfSe with a threshold logarithmic LDA score set at 2.0 and ranked. Respective cladograms were generated with modules at the lowest level. Quantitative plots of differential features were generated from normalized module level predicted gene data showing means with standard deviation. Pathway KO differential enrichment images were generated using KEGG Mapper (v2.8)(26).
RESULTS
A total of 76 subjects (No alcohol controls, NAC=20, Heavy drinking controls, HDC=19, Moderate Alcoholic Hepatitis, MAH=18, Severe Alcoholic Hepatitis, SAH=19) were studied. The study groups were age and BMI comparable with male predominance among alcohol groups. The laboratory profile and severity of disease measures are described in Table 1. As expected, when compared with non-drinking controls and HDC, more pronounced anemia, leukocytosis, thrombocytopenia, abnormal hepatic panel, hyperbilirubinemia, hypoalbuminemia and coagulopathy were seen in subjects with AH. Similarly, the MELD score, Child Pugh score and discriminant function, all measures of disease severity, were highest in those with severe AH.
Table 1.
Characteristics of the study cohort
| Parameters | Nonalcoholic Healthy Controls (NAC) | Heavy Drinking Controls (HDC) | Moderate Alcoholic Hepatitis (MAH) | Severe Alcoholic Hepatitis (SAH) | Overall P-value |
|---|---|---|---|---|---|
| Age (yrs) | 41.9 ± 10.7 | 41.7 ± 12.1 | 48.6 ± 9.2 | 44.5 ± 10.9 | 0.18 |
| Sex (M%) | 25 | 68 | 55 | 63 | |
| BMI (kg/m2) | 26 ± 48 | 27 ± 18 | 24.9 ± 3.9 | 28.7 ± 7 | 03 |
| Hemoglobin (g/dL) | 12.8 ± 1.3 | 12.3 ± 23 | 10 ± 2.1 | 9 5 ± 2 | <0.0001 |
| White 8lood Cells (109/L) | 6±1.5 | 8 ± 2.9 | 10.2 ± 7.7 | 12.3 ± 11.7 | 024 |
| Platelets (109/L) | 278 ± 78 | 266 ± 115 | 148 ± 82 | 156 ± 98 | 0.0004 |
| Creatinine (mg/dL) | 0.8 ± 0.13 | 0.81 ± 0.33 | 0.66 ± 0.19 | 0.95 ± 0.54 | 0.13 |
| AST (U/L) | 22 ± 3 | 26 ± 10 | 147 ± 91 | 109 ± 34 | <0.0001 |
| ALT (U/L) | 22 ± 10 | 21 ± 8 | 70 ± 65 | 47 ± 51 | 0.0096 |
| Alkaline Phosphatase (U/L) | 65 ± 16 | 64 ± 60 | 259 ± 184 | 181 ± 66 | <0.0001 |
| Total Bilirubin (mg/dL) | 0.6 ± 0.3 | 0.6 ± 0.4 | 4.8 ± 2.1 | 19.1 ± 9.6 | <0.0001 |
| Albumin (g/dL) | 4.3 ± 0.3 | 3.6 ± 0.6 | 2.9 ± 0.7 | 2.8 ± 0.6 | <0.0001 |
| Prothombin Time (sec) | 12.6 ± 2.5 | 17.1 ±3.9 | 23.5 ± 4.7 | <00001 | |
| INR | 1.1 ± 0.2 | 1.4 ± 0.4 | 2.1 ± 0.5 | <0 0001 | |
| MELD score | 7.9 ± 2.7 | 16 ±3.4 | 26.4 ± 3.8 | <0.0001 | |
| Discriminant Function | 13.2 ± 114 | 305 ± 186 | 699 ± 254 | <0.0001 | |
| Child Pugh Score | 5.5 ± 0.6 | 8.7 ± 1.6 | 10.5 ± 1.6 | <0.0001 |
Abbreviations: AST, aspartate aminotransferase; ALT, alanine aminotransferase; BMI, Body Mass Index; INR, International Normalized Ratio; MELD, Model for End Stage Liver Disease
Alcohol consumption and presence of AH is associated with Increased circulating bacterial DNA (Fig. 1a)
Fig 1. Whole blood sample 16S rDNA sequence, diversity analysis and relative taxonomic abundances.
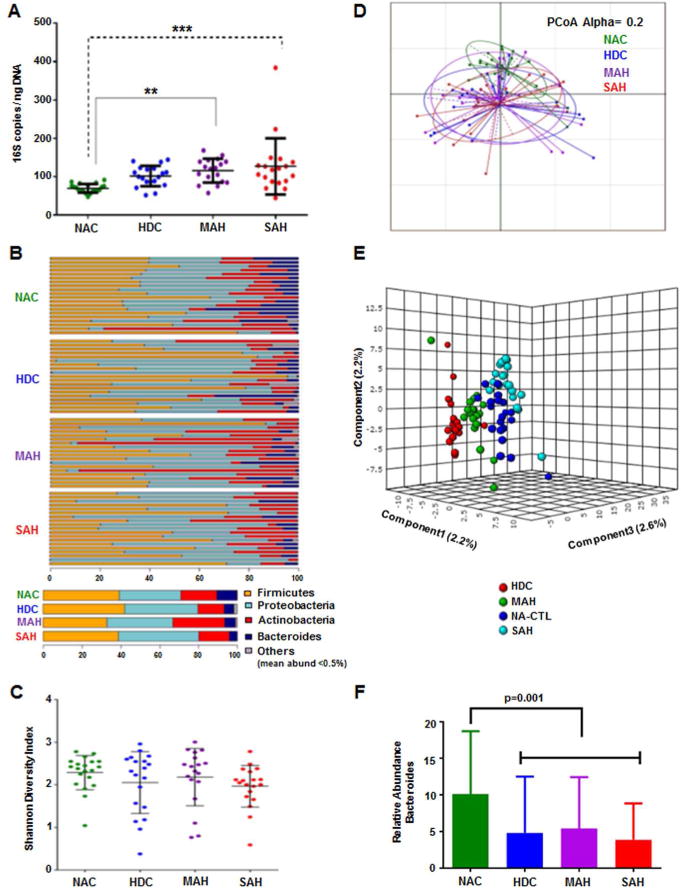
A: A scatter plot depicting 16S copies/ngDNA among the study groups. There is a step wise increase in 16S copies/ngDNA from NAC to HDC to MAH to SAH. Compared to NAC group, both MAH and SAH showed significantly higher 16S copies/ngDNA using Kruskal Wallis test.
B: Stacked column bar graphs depicting the individual sample phylum level taxonomic abundance by study group for 16S targeted sequence analysis. Taxa were identified by name for the most abundant phyla or merged into the “Other” category for below 0.5% abundance.
C: Plots of microbiome alpha diversity (Shannon index), representing the mean of species diversity per sample at the genus level with respect to alcohol use study groups, demonstrating a small but insignificant shift toward lower diversity in alcohol using subjects and corresponding to disease severity.
D: Principal Component Analysis (PCoA) unsupervised dimensional reduction plots depicting the relationships between the microbiomes with respect to alcohol use study groups based on weighted UniFrac methodology for β-diversity.
E: On Partial Least Square Discriminant Analysis the study groups are separated by supervised dimensionality reduction multivariate regression model.
F: Stacked column bar graphs depicting the average phylum level taxonomic abundance by study group for 16S targeted sequence analysis. Taxa were identified by name for the most abundant phyla or merged into the “Other” category for below 0.5% abundance. Significantly lower relative abundance of the phylum Bacteroidetes was seen in the alcoholic (HDC, MAH, SAH) vs. the nonalcoholic controls (NAC) using Kruskal Wallis test.
NAC = Non Alcoholic Controls, HDC = Heavy Drinking Controls, MAH = Moderate Alcoholic Hepatitis, SAH = Severe Alcoholic Hepatitis
Measurement of circulating 16S copies/ng DNA revealed a step wise increase from NAC to HDC to MAH to SAH (p< 0.01). Of note, compared to NAC, the mean 16S copies/ng DNA were significantly higher in both MAH (p<0.01) and SAH (p<0.001). These data demonstrate an increased circulating bacterial burden in subjects with moderate and severe alcoholic hepatitis.
Impact of alcohol consumption and presence of AH on bacterial diversity and distribution of microbiota in circulation
A detailed illustration of the relative abundance of bacteria at a phylum level for individual groups is shown in Fig. 1b. The overall diversity of the microbiome, as assessed by the Shannon Diversity Index (27), was not significantly different across the four study groups (Fig. 1c). Further, when Principal Coordinate Analysis (PCoA) was performed to compare samples based on the Generalized UniFrac distance metrics with alpha value of 0.2 (Fig. 1d), no statistically significant differences were observed among the study groups. The relative bacterial abundance did however cluster separately (Fig. 1e) and all alcohol-consuming groups had a statistically significant decrease in the relative abundance of the phylum Bacteroidetes (p< 0.0001, Fig 1f).
To further characterize the impact of alcohol consumption and presence of AH on the circulating microbiome, discriminative features cladograms (Fig. 2a) and abundance histograms (Fig 2b) based on an effect size cutoff of 2.0 for the logarithmic LDA score were plotted. Compared to NACs, the circulating microbiome of subjects consuming alcohol (HDC, MAH and SAH all combined) was significantly enriched with the obligate anaerobic non-spore forming Gram-negative bacilli phylum Fusobacteria and its subclasses Fusobacteriales and Leptotrichiaceae (Fig. 2a). Interestingly, the degree of enrichment was greatest in HDC followed by MAH and then SAH (data not shown). Other gram negative bacteria that were enriched in the alcohol-consuming groups (vs. NACs) included Neisseriaceae, Chitinophagaceae, Bradyrhizobiaceae, and Peptostreptococcaceae (Fig. 2a). Alcohol consuming groups were also enriched in gram positive taxa predominantly those under phyla Actinobacteria (genus Turicella and Microbacterium) and Firmicutes (genus Anaerococcus, Lachnospiraceae incertae sedis, and Clostridium XI) (Fig. 2b).
Fig. 2. Differential group taxonomic features relative to use of alcohol.
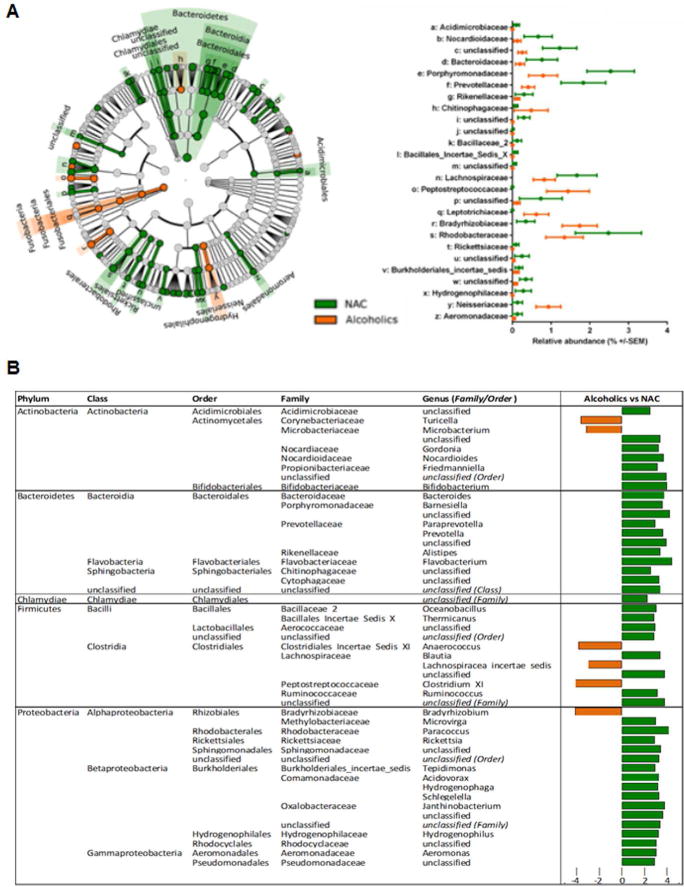
A: LDA Effect Size (LEfSe) cladograms of pairwise analysis for nonalcoholic controls (NAC) and combined alcoholic groups (HDC + MAH + SAH) for 16S rDNA sequence analysis of whole blood samples. The cladogram shows the taxonomic levels represented by rings with phyla at the innermost ring and genera at the outermost ring, and each circle is a member within that level. Taxa at each level are shaded green (NAC) or orange (Alcoholics) in which it is more abundant (P < 0.05; LDA score >2.0). The LEfSe analysis indicates differential signatures based on alcohol use by subjects.
B (Table): LDA effect size plots of pairwise analysis for the nonalcoholic controls (NAC) and combined alcoholic groups (HDC + MAH + SAH) for 16S rDNA sequence analysis of whole blood samples. The phylum and subsequent taxonomic levels are sorted alphabetically and the corresponding LDA score indicated in the furthest right column according to the group in which it is more abundant (P < 0.05; LDA score >2.0).
In addition, gender based comparison of circulating microbiota was also performed. In NAC group, Lachnospiraceae was enriched in males while in alcohol group (HDC, MAH and SAH) females were enriched in genus Actinomyces of phylum Actinobacteria and order Sphingomonadales and family Sphingomonadaceae belonging to the phylum Proteobacteria (supplementary figure 2A and 2B).
Alcohol consumption and presence of AH affect bacterial composition within specific phyla
The complex overlay of the differences in distribution of the microbiome across the study groups were next visualized using Venn diagrams (Fig. 3a). Overall NACs were enriched with 77 taxa compared to those consuming alcohol (Fig. 3a, panel 1, bar plot), but only 9 taxa had common enrichment when compared to all groups consuming alcohol (Fig. 3a, panel 1, Venn diagram). Conversely, the alcohol consuming groups were enriched in 43 taxa compared to the NACs (Fig. 3a, panel 2, bar plot) but only 4 common taxa were enriched in alcohol groups (Fig. 3a, panel 2, Venn diagram).
Fig. 3. Differential group taxonomic features relative to nonalcoholic control study group.
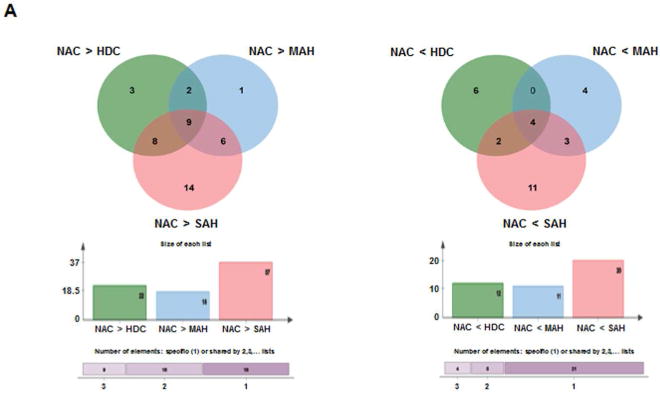
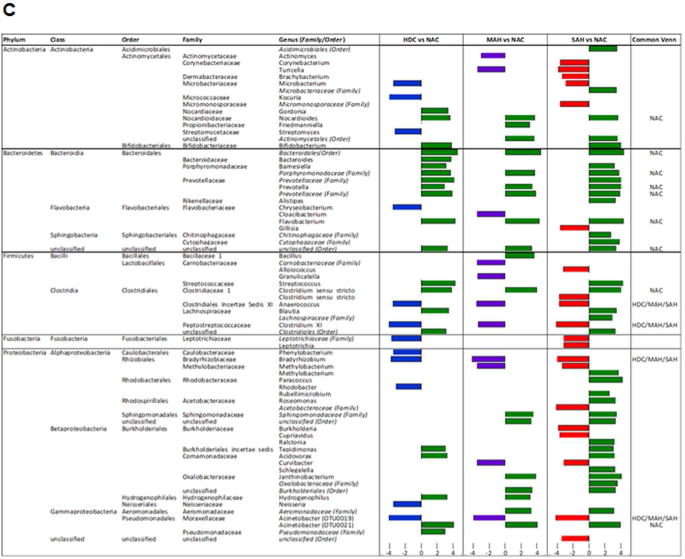
A: Venn diagrams indicating the number of common differential features (KW<0.05, LDA>2.0) from any taxonomic level (phylum to genus) that are enriched in the nonalcoholic group (NAC, left panel Venn) or enriched in the alcoholic groups (HDC + MAH + SAH, right panel Venn).
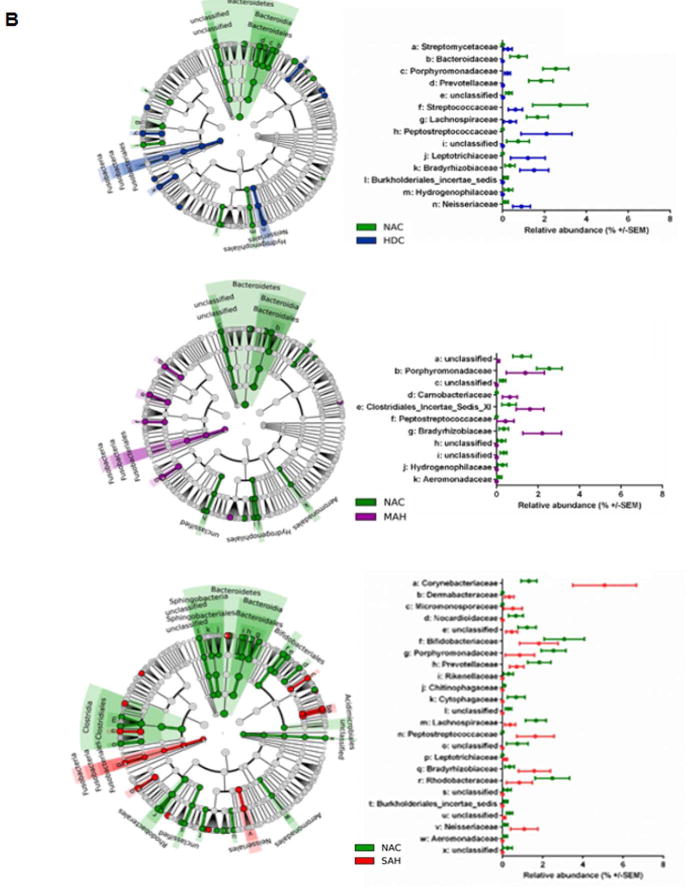
B: LDA Effect Size (LEfSe) cladograms of pairwise analysis for the nonalcoholic controls (NAC) and each individual alcoholic group (HDC, MAH, or SAH) for 16S rDNA sequence analysis of whole blood samples. The cladogram shows the taxonomic levels represented by rings with phyla at the innermost ring and genera at the outermost ring, and each circle is a member within that level. Taxa at each level are shaded green (NAC), blue (HDC), violet (MAH), or red (SAH) according to the alcohol use group in which it is more abundant (P < 0.05; LDA score >2.0).
C (Table): LDA effect size plots of pairwise analysis with nonalcoholic controls (NAC) and each individual alcoholic group (HDC, MAH, or SAH) for 16S rDNA sequence analysis of whole blood samples. The phylum and subsequent taxonomic levels are sorted alphabetically and the corresponding LDA scores for each pairwise analysis with the NAC group are indicated in columns to the right according to the group in which it is more abundant (P < 0.05; LDA score >2.0). The furthest right column indicates the nine common taxonomic features enriched in the NAC group and the four common taxonomic features enriched in the alcoholic groups.
The differential enrichment of specific bacteria at a family and genus level compared to NAC is shown in cladograms (Fig. 3b) and histograms respectively (Fig. 3c) based on a LDA score > 2 for pairwise comparisons. Certain families were enriched in more than one alcohol group: Peptostreptococcaceae (HDC, MAH and SAH), Leptotrichiaceae (HDC and SAH), Bradyrhizobiaceae (HDC, MAH and SAH), and Neisseriaceae (HDC and SAH). Specific enrichment for individual alcohol groups compared to NAC included Streptomycetaceae (HDC), Carnobacteriaceae and Clostridiales Incertae Sedis XI (MAH); and Corynebacteriaceae, Dermabacteraceae, and Micromonosporaceae (SAH).
Within the Actinobacteria phylum, Nocardioides was uniformly enriched in the NAC compared to all other alcohol groups (Fig. 3C). Specifically enriched genus for different alcohol groups vs. NAC group included Kocuria and Streptomyces (for HDC), Actinomyces (for MAH) and Corynebacterium and Brachybacterium (for SAH).
Within the phylum Bacteroidetes, the NAC group was uniformly enriched in genus Prevotella and Flavobacterium when compared to all other alcohol groups (Fig. 3c). Also, order Bacteroidales and families Porphyromonadaceae and Prevotellaceae were enriched in NAC vs. all other alcohol groups. In contrast, compared to the NAC, each of the alcohol study groups was specifically enriched in a particular genus: Chryseobacterium (HDC), Cloacibacterium (MAH) and Gillisia (SAH).
For the phylum Firmicutes, subjects within the NAC group were enriched in Clostridium sensustricto compared to all alcohol consuming groups. The genus Anaerococcus and Clostridium XI were also enriched in all alcohol-consuming groups compared to the NAC. Within the phylum Fusobacteria, both HDC and SAH groups were enriched in Leptotrichiaceae family whereas only the SAH group was enriched with Leptotricha.
Within the phylum Proteobacteria (Fig. 3c), Acinetobacter (OTU0021) was enriched in NAC vs. all alcohol groups while the genus Bradyrhizobium and Acinetobacter (OTU0019) were enriched in all alcohol groups vs. the NAC. On pairwise comparison, genus Phenylobacterium, Rhodobacter, and Neisseria were all enriched in HDC vs. NAC (Fig. 3c). Also, both MAH and SAH were enriched with genus Methylobacterium and Curvibacter. Notably SAH subjects compared to NAC were specifically enriched with genus Burkholderia and Cupriavidus.
Distinct Circulating Microbiome Enrichment in Alcoholic Hepatitis (Fig. 4a and 4b)
Fig. 4. Distinct Circulating Microbiome Enrichment in Alcoholic Hepatitis.
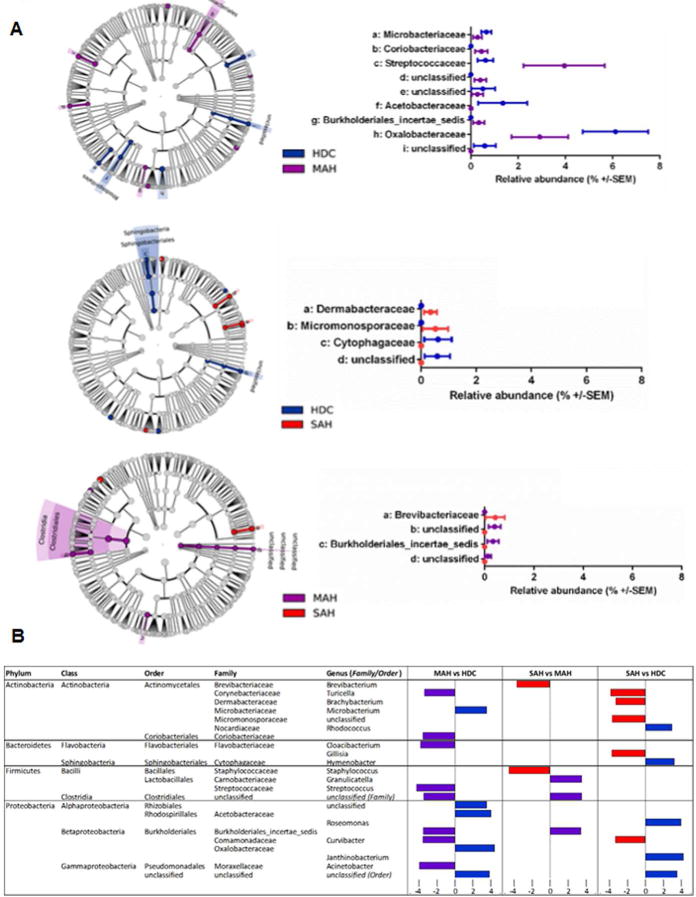
A: LDA Effect Size (LEfSe) cladograms of pairwise analysis for each alcoholic group (HDC, MAH, and SAH) for 16S rDNA sequence analysis of whole blood samples. The cladogram shows the taxonomic levels represented by rings with phyla at the innermost ring and genera at the outermost ring, and each circle is a member within that level. Taxa at each level are shaded blue (HDC), violet (MAH), or red (SAH) according to the alcohol use group in which it is more abundant (P < 0.05; LDA score >2.0).
B (Table): LDA effect size plots of pairwise analysis for each alcoholic group (HDC, MAH, and SAH) for 16S rDNA sequence analysis of whole blood samples. The phylum and subsequent taxonomic levels are sorted alphabetically and the corresponding LDA scores for each pairwise analysis are indicated in columns to the right according to the group in which it is more abundant (P < 0.05; LDA score >2.0).
There were specific changes in the microbiome in those with AH compared to NAC. While moderate AH was associated with enrichment of Coriobacteriaceae and Streptococcaceae, severe AH was associated with enrichment of Dermabacteraceae and Micromonosporaceae (Fig. 4a). As shown in the LDA > 2 histograms with pairwise comparisons, both AH groups were enriched with the genus Turicella and Curvibacter. Moderate AH and severe AH were also associated with specific enrichment of several genus compared to the NAC (Fig. 4b). Conversely, NAC showed specific enrichment of genus Microbacterium (vs. MAH), and Rhodococcus, Hymenobacter, Roseomonas and Janthinobacterium (vs. SAH) (Fig. 4b).
Circulating measures of endotoxemia and monocyte activation in Alcoholic Hepatitis
Plasma LPS levels (EU/ml) were significantly increased in SAH compared to HDC (mean ± S.D., HDC 0.039 ± 0.007 vs. MAH 0.048 ± 0.01 vs. SAH 0.051 ± 0.01, p=0.01 HDC vs. SAH, Supplementary Fig. 1). However, no significant differences were seen in plasma LBP levels (μg/ml) among the alcohol consuming groups regardless of the presence and severity of AH (HDC 12.2 ± 6.8 vs. MAH 11.3 ± 5.5 vs. SAH 11.5 ± 9.1). Also, no significant correlation between circulating 16S and LPS was observed (r2=0.006, p=0.58). Soluble CD14 (sCD14) levels (μg/ml) were higher and statistically significant (overall p=0.01) in subjects with MAH vs. HDC (2.6 ± 0.8 vs. 1.9 ± 0.5, p=0.03) as well as vs. SAH (1.9 ± 0.8, p=0.04).
Interrelationships of disease severity, monocyte activation, endotoxemia and circulating microbiome
Gram negative Proteobacteria and Gram positive Firmicutes were inversely related in non-drinking controls (ρ= −0.5, p=0.02). This relationship became more distinct in HDC (ρ= −0.84, p<0.0001), and most notable in SAH (ρ= −0.95, p<0.0001).
Bacterial class Gammaproteobacteria and Betaproteobacteria were inversely correlated to MELD, Maddrey’s DF and CTP scores (ρ= −0.47 to −0.67, p< 0.05 for all). Moreover, on regression analysis the relative abundances of genus Janthinobacterium (p=0.02, r= −0.30) was inversely related to the MELD score (Fig. 5). Similarly, Enhydrobacter was also inversely related to the MELD score (p=0.03, r= −0.29). However, neither LBP nor LPS were significantly correlated with either with disease severity scores (MELD, CTP and DF) or stage of disease (HDC, MAH and SAH), suggesting that heavy alcohol use with and without AH potentially produced comparable endotoxemia.
Fig 5. Disease severity MELD regression plots.
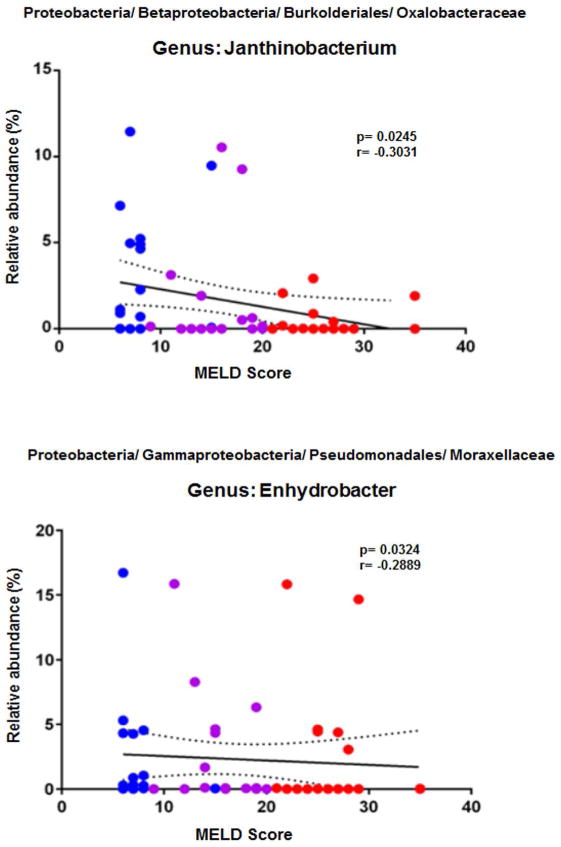
Regression analysis plots of 16S rDNA sequence relative abundance relative to MELD disease score. Two genera, Janthinobacterium and Enhydrobacter, from the phylum Proteobacteria were identified to have a negative correlation with MELD disease score. HDC (blue), MAH (purple) and SAH (red).
The sCD14 levels were inversely correlated with MELD score (ρ= −0.73 in MAH, p=0.0005; ρ= −0.47 in SAH, p=0.04) and DF (ρ= −0.76 in MAH, p=0.003). While sCD14 was inversely correlated with Actinomycetales in HDC and Coriobacteriales in SAH, plasma LBP was inversely correlated with Rhodobacterales in HDC and Xanthomonadales in SAH (ρ= −0.5 to −0.63, p< 0.05 for all).
Impact of antibiotic use on circulating microbiome
A total of 6/19, 10/18 and 14/19 subjects in the HDC, MAH and SAH groups were on systemic antibiotics (p=0.03 for trend) at the time of sample collection even though there was no documented infection in these subjects at the time of sample collection. None of the NAC subjects had any recent (within 1 month) antibiotic use. Regardless of the group and the specific antibiotic used, those on antibiotics had an enrichment in Bacteroides-Bacteroideaceae while those without antibiotic exposure had an enrichment in Hymenobacter and Janthinobacterium. Importantly, the key findings distinguishing the changes in the circulating microbiome across groups presented above were not altered by antibiotic exposure with the exception of Janthinobacterium in the alcoholic hepatitis groups where it was inversely related to MELD scores. Further, subjects with alcohol use and no antibiotic exposure (both HDC and AH, as well as all alcohol groups combined) were compared to NAC group. The principal findings in circulating microbiota composition were similar to the original overall cohort (subjects with and without antibiotic exposure, supplementary figure 3A and 3B).
Functional Circulating Metagenome in Alcoholics and Severe Alcoholic Hepatitis
Inferred metagenomics analysis using PICRUSt was performed to predict the functional potential of the circulating metagenome in relation to the alcohol consumption and presence of AH. First, the NAC group when compared to heavy alcoholics (HDC, MAH and SAH) had markedly enriched metabolic pathways containing gene functions such as methanogenesis, denitrification, citrate cycle, glucuronate/uronate and glycosaminoglycan metabolism including keratan sulfate degradation (Fig. 6a). In contrast, heavy alcoholics (HDC, MAH and SAH) compared with NAC, were enriched for genes of structural components of the Type III secretion system (T3SS) (Fig. 6b). Similarly, functional metagenomics predicted lysine, arginine, ornithine, methionine and histidine transport systems were activated in heavy alcoholics (HDC, MAH and SAH, Fig. 6b).
Fig 6. Predicted metagenome metabolic pathway and structural complex analysis.
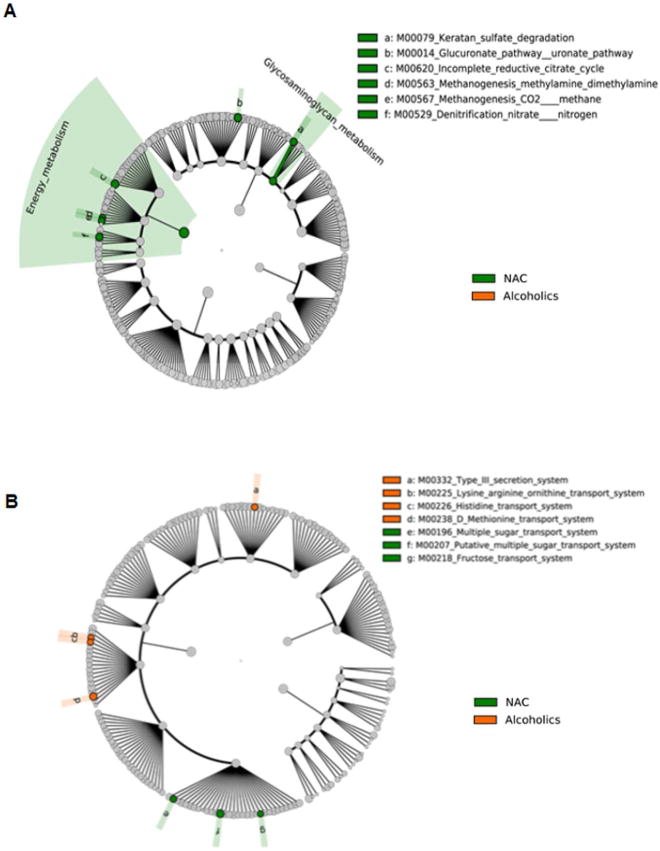
LDA Effect Size (LEfSe) cladograms of pairwise analysis for the nonalcoholic controls (NAC) and combined alcoholic groups (HDC + MAH + SAH). The cladograms show the KEGG hierarchy for A) metabolic pathways and B) structural complexes represented by rings with the pathway or structural modules at the outermost ring, and each circle is a member within that level. KEGG modules are shaded green (NAC) or orange (alcoholics) according to the study group in which it is more abundant (P < 0.05; LDA score >2.0).
Next we compared SAH vs. NAC groups. Interestingly, SAH subjects had markedly enhanced isoprenoid biosynthesis via mevalonate pathway compared to non- mevalonate pathway in NAC (Fig. 7a). Also, in SAH other notable metabolic pathways that were predictably enhanced included anthranilate degradation pathway, which is associated with bacterial biofilm formation, and ketone body biosynthesis among others (Fig. 7a). Furthermore, the SAH group was enriched with bacterial community associated with hemophore metalloprotease, vitamin B12, phosphonate transport systems and T3SS, among other amino acid transport systems (Fig. 7b).
Fig 7. Predicted metagenome metabolic pathway and structural complex analysis.
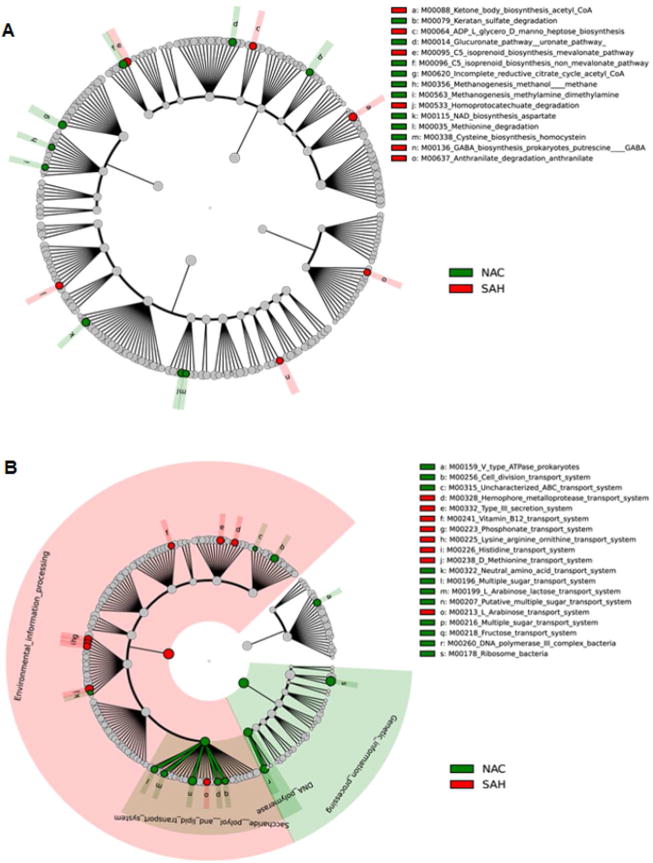
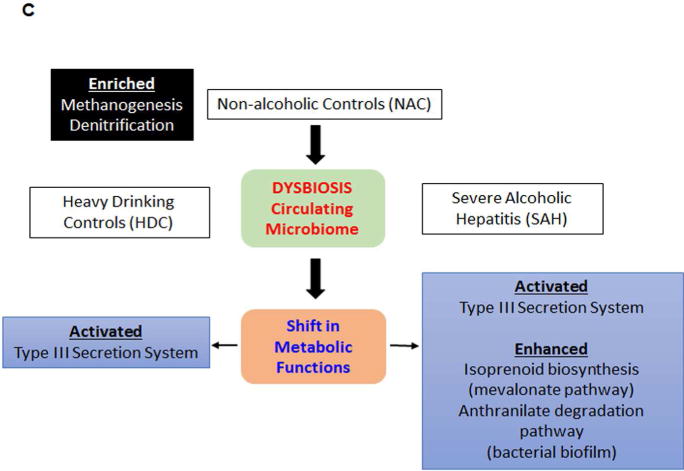
LDA Effect Size (LEfSe) cladograms of pairwise analysis for the nonalcoholic controls (NAC) and severe alcoholic hepatitis (SAH). The cladograms show the KEGG hierarchy for A) metabolic pathways and B) structural complexes represented by rings with the pathway or structural modules at the outermost ring, and each circle is a member within that level. KEGG modules are shaded green (NAC) or red (SAH) according to the study group in which it is more abundant (P < 0.05; LDA score >2.0). C) An overview of changes in the metabolic function and structural complex in HDC and SAH compared to NAC.
DISCUSSION
There is growing appreciation that the human body represents a complex eco-system where the host lives in a symbiotic relationship with resident microbiota. Perturbations in the microbiome are associated with multiple disease states. While numerous studies have documented such changes in the intestinal microbiome in those with an alcohol use related liver disease, the changes in the circulating microbiome were not previously known. The current study indicates that there are indeed multiple changes in the circulating microbiome both in heavy alcohol consumers without overt liver disease and with alcoholic hepatitis. More importantly, these changes are associated with shift in the metabolic functions of the circulating microbiome.
A key finding from this study is the decrease in the blood-borne signature of relative abundance of the phylum Bacteroidetes in all groups consuming alcohol compared to non-drinking controls. Previously, a variable increase in fecal Bacteroidetes was reported in relation to alcohol use disorders and a more consistent increase was noted in nonalcoholic fatty liver disease (28–30). Of note, the previously reported increase in Proteobacteria in those with heavy alcohol consumption (fecal and mucosal) and subjects with NAFLD (18, 31, 32) was not observed in the circulating microbiome in alcohol-consuming subjects in this study. The relationship and cross-talk between the fecal microbiome and the circulating microbiome is a yet largely unexplored area of research and modulation of circulating microbial signatures are likely to be multifactorial in origin. These could include changes in diet, intestinal microbiota, altered gut barrier function and gut-based immune responses. The current data set the stage for hypothesis-generation and future mechanistic studies in the context of alcoholic hepatitis.
Previous studies have noted an increase in Fusobacteria in feces of individuals with cirrhosis including alcohol-induced cirrhosis(33). Furthermore, an enrichment with Fusobacteria was noted in those with overt hepatic encephalopathy (34). This had led to the concept that they may directly influence the development of this cirrhosis-related complication. The current data extend the observation of increased Fusobacteria in stool of those with cirrhosis to the circulation. A novel observation is that it is enriched in even the heavy drinking controls and that the development and severity of AH was inversely related to the degree of enrichment with Fusobacteria. One may thus hypothesize that this inverse relationship may reflect the protective value of increased Fusobacteria in those who consume large amounts of alcohol and that the failure to increase these bacteria allow the liver disease to develop and increase in severity. This remains hypothetical and needs to be validated in appropriately designed studies.
A key challenge in evaluating the potential role of the circulating microbiome in health and disease is that specific bacteria can’t be removed or added to circulation to see their impact on specific physiological processes. Furthermore, the circulating microbiome signature is present in healthy hosts and does not represent an immune deficiency or infection in the traditional sense. The mechanisms by which they establish a symbiotic relationship with the host immune system also remains largely unknown. The development of specific methodology to evaluate gain or loss of function of the microbiota is now a major unmet need to fully leverage the observed changes in the circulating microbiome to improve human health.
Until such methods are developed, analytic tools such as inferred metagenomics can be used to assess the potential impact of changes in bacterial relative abundance on the functionality of the microbiome. In this study, such analyses indicated that the circulating microbiome of non-drinking controls were enriched with respect to methanogenesis, de-nitrification and several other functions. A growing body of literature indicates an important role of gases as “signaling” molecules and both methane and hydrogen sulfide have been implicated as regulators of intestinal epithelial integrity and gut-derived inflammatory signals (35, 36). A likely possibility is that circulating bacteria, by producing even minute quantities of such gases, and/or pathogen-associated molecular patterns (PAMPs) may modulate signaling within the innate and adaptive immune system, modify oxidative stress, and affect the microcirculation and even cellular function in individual organs. This possibility is further supported by the well-established roles of nitric oxide and carbon monoxide as modulators of endothelial dysfunction, microcirculation, organ function and inflammation particularly in the liver (37–40).
Another noteworthy finding is that the functional metagenome shows enrichment of genes for structural components of the Type III secretion systems (T3SS) in HDC and SAH. This finding is highly relevant because the T3SS machinery is uniquely related to the pathogenicity of gram-negative bacteria. The T3SS apparatus consists of a needle-like injectisome complex (41) that promotes virulence by translocating effector proteins into host cells where they exert anti-host effects such as facilitated invasion, intracellular survival, phagocytic avoidance, and disruption of host defenses (42). This could explain one of the mechanisms of increased risk of Gram negative pathogens in patients with heavy alcohol use and severe alcoholic hepatitis.
Also noteworthy is isoprenoid biosynthesis pathway on functional metagenome. Isoprenoids are vital for the growth and survival of prokaryotes, supporting core functions such as cell wall and membrane synthesis, and aerobic respiration among others (43). Enhanced isoprenoid biosynthesis via the mevalonate pathway, mainly seen in Gram positive pathogens (44) may contribute to the risk of Gram positive pathogen infection in SAH. In fact, Gram positive Enterococcus emerged as the most frequent cause of infection in SAH patients (45).
Notably, in patients with SAH there is shift in function of circulating microbiota with enrichment of the anthranilate degradation pathway. This pathway is significant in forming bacterial biofilm as previously shown (46). Bacterial biofilm also contributes to the pathogenesis, and antibiotic/host immune resistance to a number of medically important bacterial strains (47) and likely plays an important role in infections associated in patients with SAH. Together, these findings on functional aspects of circulating microbiome provide direction for future research and could potentially lead to the development of novel therapeutic approaches.
Heavy alcohol consumption has been linked to endotoxemia (48) and endotoxin load is widely believed to represent a key pathophysiological step in the genesis of alcoholic hepatitis. The current data also support a role for factors beyond endotoxemia in the genesis of alcoholic hepatitis and thus extend the existing paradigm. It is also interesting to note the inverse relationship between sCD14, a marker of monocyte activation through TLR4, and the severity of alcoholic hepatitis. Theoretically, this could be due to immunosuppression associated with SAH; the current data provide the rationale for testing this hypothesis in the future.
The current study does have some limitations that need to be considered in evaluating the data. The control groups did not have a liver biopsy for logistical and ethical considerations and so the possibility of clinically unapparent disease can’t be completely excluded. This possibility was however minimized by selecting asymptomatic individuals with normal liver enzymes and hepatic function. The diagnosis of alcoholic hepatitis was also based on clinical criteria without mandatory requirement of liver biopsy and one could question if some of these individuals had alternate diagnoses as has been suggested by others (49, 50). We believe that the probability of not having alcoholic hepatitis in our subjects is low because sepsis leading to decompensated cirrhosis, a key diagnostic confounder, was carefully excluded in all cases. Furthermore, alternate causes of liver disease such as viral hepatitis, etc., were excluded in all individuals. It is however possible and indeed probable that many of the subjects had alcoholic hepatitis superimposed on cirrhosis as has been observed previously. While the use of antibiotics alter the circulating microbiome, they did not impact the principal differences between the study groups. Therefore the findings reflect the changes in those with alcoholic hepatitis in a “real world” setting which usually include alcoholic hepatitis superimposed on cirrhosis rather than pure alcoholic hepatitis. Also, effects of diet, previous antibiotics exposure and correlation with concomitant gut microbiome could not be derived due of lack of these data in the present study, and their relationship merits further exploration by specifically designed studies in the future. Also, we used MELD score of >20 to define SAH, which has less variability than discriminant function (DF) as previously published (6). Thus, there is a small potential for obtaining somewhat different data if the thresholds to separate MAH vs. SAH were based on the DF.
Much work remains to be done to better understand the physiological and pathophysiological functions of the circulating microbiome. The current study provides the first description of the compositional changes associated with alcoholic hepatitis and shift in the metabolic functions of circulating microbiota. These provide the foundational basis for future focused studies on the role of the circulating microbiome and its related metabolites in the genesis of alcohol associated liver disease.
Supplementary Material
Members of the TREAT Consortium.
Indiana University, Indianapolis, IN:
David W. Crabb, MD, Naga P. Chalasani, MD, Suthat Liangpunsakul, MD, Barry Katz, PhD, Spencer Lourens, PhD, Andy Borst, BS, Ryan Cook, MPH, Qigui Yu, PhD, David Nelson, PhD, Romil Saxena, MD, Sherrie Cummings, RN, Megan Comerford, BS, Lakye Edwards, BS
Mayo Clinic, Rochester, MN:
Vijay H. Shah, MD, Gregory J. Gores, MD, Patrick S. Kamath, MD, Vikas Verma, PhD, Sarah Wilder, RN, BSN, Amy Olofson, RN, Amanda Schimek
Virginia Commonwealth University, Richmond, VA:
Arun J. Sanyal, MD, Puneet Puri, MD, Susan Walker, RN, MSN
NIAAA:
Project Scientist – Svetlana Radaeva, PhD
Program Official – Andras Orosz, PhD
Acknowledgments
Source of Funding
The Translational Research and Evolving Alcoholic Hepatitis Treatment (TREAT) Consortium is supported by the National Institute on Alcohol Abuse and Alcoholism (NIAAA) (Grants 5U01AA021883-05, 5U01AA021891-05, 5U01AA021788-05, 5U01AA021840-05) and K23AA021179 (PP).
This article has been accepted for publication and undergone full peer review but has not been through the copyediting, typesetting, pagination and proofreading process which may lead to differences between this version and the Version of Record. Please cite this article as doi: 10.1002/hep.29623
Footnotes
Conflicts of interest: None relevant for this paper.
References
- 1.Jewell J, Sheron N. Trends in European liver death rates: implications for alcohol policy. Clin Med (Lond) 2010;10:259–263. doi: 10.7861/clinmedicine.10-3-259. [DOI] [PMC free article] [PubMed] [Google Scholar]
- 2.Rehm J, Samokhvalov AV, Shield KD. Global burden of alcoholic liver diseases. J Hepatol. 2013;59:160–168. doi: 10.1016/j.jhep.2013.03.007. [DOI] [PubMed] [Google Scholar]
- 3.Case A, Deaton A. Rising morbidity and mortality in midlife among white non-Hispanic Americans in the 21st century. Proc Natl Acad Sci U S A. 2015;112:15078–15083. doi: 10.1073/pnas.1518393112. [DOI] [PMC free article] [PubMed] [Google Scholar]
- 4.Teli MR, Day CP, Burt AD, Bennett MK, James OF. Determinants of progression to cirrhosis or fibrosis in pure alcoholic fatty liver. Lancet. 1995;346:987–990. doi: 10.1016/s0140-6736(95)91685-7. [DOI] [PubMed] [Google Scholar]
- 5.Liangpunsakul S, Puri P, Shah VH, Kamath P, Sanyal A, Urban T, Ren X, et al. Effects of Age, Sex, Body Weight, and Quantity of Alcohol Consumption on Occurrence and Severity of Alcoholic Hepatitis. Clin Gastroenterol Hepatol. 2016;14:1831–1838e1833. doi: 10.1016/j.cgh.2016.05.041. [DOI] [PMC free article] [PubMed] [Google Scholar]
- 6.Dunn W, Jamil LH, Brown LS, Wiesner RH, Kim WR, Menon KV, Malinchoc M, et al. MELD accurately predicts mortality in patients with alcoholic hepatitis. Hepatology. 2005;41:353–358. doi: 10.1002/hep.20503. [DOI] [PubMed] [Google Scholar]
- 7.Maddrey WC, Boitnott JK, Bedine MS, Weber FL, Jr, Mezey E, White RI., Jr Corticosteroid therapy of alcoholic hepatitis. Gastroenterology. 1978;75:193–199. [PubMed] [Google Scholar]
- 8.Mathurin P, Louvet A, Duhamel A, Nahon P, Carbonell N, Boursier J, Anty R, et al. Prednisolone with vs without pentoxifylline and survival of patients with severe alcoholic hepatitis: a randomized clinical trial. JAMA. 2013;310:1033–1041. doi: 10.1001/jama.2013.276300. [DOI] [PubMed] [Google Scholar]
- 9.Lucey MR, Mathurin P, Morgan TR. Alcoholic hepatitis. N Engl J Med. 2009;360:2758–2769. doi: 10.1056/NEJMra0805786. [DOI] [PubMed] [Google Scholar]
- 10.Thursz MR, Forrest EH, Ryder S, investigators S Prednisolone or Pentoxifylline for Alcoholic Hepatitis. N Engl J Med. 2015;373:282–283. doi: 10.1056/NEJMc1506342. [DOI] [PubMed] [Google Scholar]
- 11.Louvet A, Mathurin P. Alcoholic liver disease: mechanisms of injury and targeted treatment. Nat Rev Gastroenterol Hepatol. 2015;12:231–242. doi: 10.1038/nrgastro.2015.35. [DOI] [PubMed] [Google Scholar]
- 12.Nagy LE, Ding WX, Cresci G, Saikia P, Shah VH. Linking Pathogenic Mechanisms of Alcoholic Liver Disease With Clinical Phenotypes. Gastroenterology. 2016;150:1756–1768. doi: 10.1053/j.gastro.2016.02.035. [DOI] [PMC free article] [PubMed] [Google Scholar]
- 13.Llopis M, Cassard AM, Wrzosek L, Boschat L, Bruneau A, Ferrere G, Puchois V, et al. Intestinal microbiota contributes to individual susceptibility to alcoholic liver disease. Gut. 2016;65:830–839. doi: 10.1136/gutjnl-2015-310585. [DOI] [PubMed] [Google Scholar]
- 14.Paisse S, Valle C, Servant F, Courtney M, Burcelin R, Amar J, Lelouvier B. Comprehensive description of blood microbiome from healthy donors assessed by 16S targeted metagenomic sequencing. Transfusion. 2016;56:1138–1147. doi: 10.1111/trf.13477. [DOI] [PubMed] [Google Scholar]
- 15.Chen P, Torralba M, Tan J, Embree M, Zengler K, Starkel P, van Pijkeren JP, et al. Supplementation of saturated long-chain fatty acids maintains intestinal eubiosis and reduces ethanol-induced liver injury in mice. Gastroenterology. 2015;148:203–214 e216. doi: 10.1053/j.gastro.2014.09.014. [DOI] [PMC free article] [PubMed] [Google Scholar]
- 16.Parlesak A, Schafer C, Schutz T, Bode JC, Bode C. Increased intestinal permeability to macromolecules and endotoxemia in patients with chronic alcohol abuse in different stages of alcohol-induced liver disease. J Hepatol. 2000;32:742–747. doi: 10.1016/s0168-8278(00)80242-1. [DOI] [PubMed] [Google Scholar]
- 17.Yang AM, Inamine T, Hochrath K, Chen P, Wang L, Llorente C, Bluemel S, et al. Intestinal fungi contribute to development of alcoholic liver disease. J Clin Invest. 2017;127:2829–2841. doi: 10.1172/JCI90562. [DOI] [PMC free article] [PubMed] [Google Scholar]
- 18.Mutlu EA, Gillevet PM, Rangwala H, Sikaroodi M, Naqvi A, Engen PA, Kwasny M, et al. Colonic microbiome is altered in alcoholism. Am J Physiol Gastrointest Liver Physiol. 2012;302:G966–978. doi: 10.1152/ajpgi.00380.2011. [DOI] [PMC free article] [PubMed] [Google Scholar]
- 19.Keshavarzian A, Farhadi A, Forsyth CB, Rangan J, Jakate S, Shaikh M, Banan A, et al. Evidence that chronic alcohol exposure promotes intestinal oxidative stress, intestinal hyperpermeability and endotoxemia prior to development of alcoholic steatohepatitis in rats. J Hepatol. 2009;50:538–547. doi: 10.1016/j.jhep.2008.10.028. [DOI] [PMC free article] [PubMed] [Google Scholar]
- 20.Lelouvier B, Servant F, Paisse S, Brunet AC, Benyahya S, Serino M, Valle C, et al. Changes in blood microbiota profiles associated with liver fibrosis in obese patients: A pilot analysis. Hepatology. 2016;64:2015–2027. doi: 10.1002/hep.28829. [DOI] [PubMed] [Google Scholar]
- 21.Loomba R, Seguritan V, Li W, Long T, Klitgord N, Bhatt A, Dulai PS, et al. Gut Microbiome-Based Metagenomic Signature for Non-invasive Detection of Advanced Fibrosis in Human Nonalcoholic Fatty Liver Disease. Cell Metab. 2017;25:1054–1062 e1055. doi: 10.1016/j.cmet.2017.04.001. [DOI] [PMC free article] [PubMed] [Google Scholar]
- 22.Segata N, Izard J, Waldron L, Gevers D, Miropolsky L, Garrett WS, Huttenhower C. Metagenomic biomarker discovery and explanation. Genome Biol. 2011;12:R60. doi: 10.1186/gb-2011-12-6-r60. [DOI] [PMC free article] [PubMed] [Google Scholar]
- 23.Bardou P, Mariette J, Escudie F, Djemiel C, Klopp C. jvenn: an interactive Venn diagram viewer. BMC Bioinformatics. 2014;15:293. doi: 10.1186/1471-2105-15-293. [DOI] [PMC free article] [PubMed] [Google Scholar]
- 24.Werner JJ, Koren O, Hugenholtz P, DeSantis TZ, Walters WA, Caporaso JG, Angenent LT, et al. Impact of training sets on classification of high-throughput bacterial 16s rRNA gene surveys. ISME J. 2012;6:94–103. doi: 10.1038/ismej.2011.82. [DOI] [PMC free article] [PubMed] [Google Scholar]
- 25.Langille MG, Zaneveld J, Caporaso JG, McDonald D, Knights D, Reyes JA, Clemente JC, et al. Predictive functional profiling of microbial communities using 16S rRNA marker gene sequences. Nat Biotechnol. 2013;31:814–821. doi: 10.1038/nbt.2676. [DOI] [PMC free article] [PubMed] [Google Scholar]
- 26.Kanehisa M, Goto S, Sato Y, Furumichi M, Tanabe M. KEGG for integration and interpretation of large-scale molecular data sets. Nucleic Acids Res. 2012;40:D109–114. doi: 10.1093/nar/gkr988. [DOI] [PMC free article] [PubMed] [Google Scholar]
- 27.SC E. A mathematical theory of communication. Bell Syst Techn J. 1948;27:379–423. [Google Scholar]
- 28.Kakiyama G, Hylemon PB, Zhou H, Pandak WM, Heuman DM, Kang DJ, Takei H, et al. Colonic inflammation and secondary bile acids in alcoholic cirrhosis. Am J Physiol Gastrointest Liver Physiol. 2014;306:G929–937. doi: 10.1152/ajpgi.00315.2013. [DOI] [PMC free article] [PubMed] [Google Scholar]
- 29.Boursier J, Mueller O, Barret M, Machado M, Fizanne L, Araujo-Perez F, Guy CD, et al. The severity of nonalcoholic fatty liver disease is associated with gut dysbiosis and shift in the metabolic function of the gut microbiota. Hepatology. 2016;63:764–775. doi: 10.1002/hep.28356. [DOI] [PMC free article] [PubMed] [Google Scholar]
- 30.Wang B, Jiang X, Cao M, Ge J, Bao Q, Tang L, Chen Y, et al. Altered Fecal Microbiota Correlates with Liver Biochemistry in Nonobese Patients with Non-alcoholic Fatty Liver Disease. Sci Rep. 2016;6:32002. doi: 10.1038/srep32002. [DOI] [PMC free article] [PubMed] [Google Scholar]
- 31.Bull-Otterson L, Feng W, Kirpich I, Wang Y, Qin X, Liu Y, Gobejishvili L, et al. Metagenomic analyses of alcohol induced pathogenic alterations in the intestinal microbiome and the effect of Lactobacillus rhamnosus GG treatment. PLoS One. 2013;8:e53028. doi: 10.1371/journal.pone.0053028. [DOI] [PMC free article] [PubMed] [Google Scholar]
- 32.Zhu L, Baker SS, Gill C, Liu W, Alkhouri R, Baker RD, Gill SR. Characterization of gut microbiomes in nonalcoholic steatohepatitis (NASH) patients: a connection between endogenous alcohol and NASH. Hepatology. 2013;57:601–609. doi: 10.1002/hep.26093. [DOI] [PubMed] [Google Scholar]
- 33.Chen Y, Yang F, Lu H, Wang B, Chen Y, Lei D, Wang Y, et al. Characterization of fecal microbial communities in patients with liver cirrhosis. Hepatology. 2011;54:562–572. doi: 10.1002/hep.24423. [DOI] [PubMed] [Google Scholar]
- 34.Bajaj JS, Ridlon JM, Hylemon PB, Thacker LR, Heuman DM, Smith S, Sikaroodi M, et al. Linkage of gut microbiome with cognition in hepatic encephalopathy. Am J Physiol Gastrointest Liver Physiol. 2012;302:G168–175. doi: 10.1152/ajpgi.00190.2011. [DOI] [PMC free article] [PubMed] [Google Scholar]
- 35.Meszaros AT, Buki T, Fazekas B, Tuboly E, Horvath K, Poles MZ, Szucs S, et al. Inhalation of methane preserves the epithelial barrier during ischemia and reperfusion in the rat small intestine. Surgery. 2017 doi: 10.1016/j.surg.2016.12.040. [DOI] [PubMed] [Google Scholar]
- 36.Zhao H, Yan R, Zhou X, Ji F, Zhang B. Hydrogen sulfide improves colonic barrier integrity in DSS-induced inflammation in Caco-2 cells and mice. Int Immunopharmacol. 2016;39:121–127. doi: 10.1016/j.intimp.2016.07.020. [DOI] [PubMed] [Google Scholar]
- 37.Martin PY, Gines P, Schrier RW. Nitric oxide as a mediator of hemodynamic abnormalities and sodium and water retention in cirrhosis. N Engl J Med. 1998;339:533–541. doi: 10.1056/NEJM199808203390807. [DOI] [PubMed] [Google Scholar]
- 38.Pannen BH, Bauer M. Differential regulation of hepatic arterial and portal venous vascular resistance by nitric oxide and carbon monoxide in rats. Life Sci. 1998;62:2025–2033. doi: 10.1016/s0024-3205(98)00174-x. [DOI] [PubMed] [Google Scholar]
- 39.Goda N, Suzuki K, Naito M, Takeoka S, Tsuchida E, Ishimura Y, Tamatani T, et al. Distribution of heme oxygenase isoforms in rat liver. Topographic basis for carbon monoxide-mediated microvascular relaxation. J Clin Invest. 1998;101:604–612. doi: 10.1172/JCI1324. [DOI] [PMC free article] [PubMed] [Google Scholar]
- 40.Brouard S, Berberat PO, Tobiasch E, Seldon MP, Bach FH, Soares MP. Heme oxygenase-1-derived carbon monoxide requires the activation of transcription factor NF-kappa B to protect endothelial cells from tumor necrosis factor-alpha-mediated apoptosis. J Biol Chem. 2002;277:17950–17961. doi: 10.1074/jbc.M108317200. [DOI] [PubMed] [Google Scholar]
- 41.Galan JE, Lara-Tejero M, Marlovits TC, Wagner S. Bacterial type III secretion systems: specialized nanomachines for protein delivery into target cells. Annu Rev Microbiol. 2014;68:415–438. doi: 10.1146/annurev-micro-092412-155725. [DOI] [PMC free article] [PubMed] [Google Scholar]
- 42.Radics J, Konigsmaier L, Marlovits TC. Structure of a pathogenic type 3 secretion system in action. Nat Struct Mol Biol. 2014;21:82–87. doi: 10.1038/nsmb.2722. [DOI] [PubMed] [Google Scholar]
- 43.Perez-Gil J, Rodriguez-Concepcion M. Metabolic plasticity for isoprenoid biosynthesis in bacteria. Biochem J. 2013;452:19–25. doi: 10.1042/BJ20121899. [DOI] [PubMed] [Google Scholar]
- 44.Boucher Y, Doolittle WF. The role of lateral gene transfer in the evolution of isoprenoid biosynthesis pathways. Mol Microbiol. 2000;37:703–716. doi: 10.1046/j.1365-2958.2000.02004.x. [DOI] [PubMed] [Google Scholar]
- 45.Beisel C, Blessin U, Schulze Zur Wiesch J, Wehmeyer MH, Lohse AW, Benten D, Kluwe J. Infections complicating severe alcoholic hepatitis: Enterococcus species represent the most frequently identified pathogen. Scand J Gastroenterol. 2016;51:807–813. doi: 10.3109/00365521.2016.1157887. [DOI] [PubMed] [Google Scholar]
- 46.Costaglioli P, Barthe C, Claverol S, Brozel VS, Perrot M, Crouzet M, Bonneu M, et al. Evidence for the involvement of the anthranilate degradation pathway in Pseudomonas aeruginosa biofilm formation. Microbiologyopen. 2012;1:326–339. doi: 10.1002/mbo3.33. [DOI] [PMC free article] [PubMed] [Google Scholar]
- 47.Donlan RM, Costerton JW. Biofilms: survival mechanisms of clinically relevant microorganisms. Clin Microbiol Rev. 2002;15:167–193. doi: 10.1128/CMR.15.2.167-193.2002. [DOI] [PMC free article] [PubMed] [Google Scholar]
- 48.Bode C, Kugler V, Bode JC. Endotoxemia in patients with alcoholic and nonalcoholic cirrhosis and in subjects with no evidence of chronic liver disease following acute alcohol excess. J Hepatol. 1987;4:8–14. doi: 10.1016/s0168-8278(87)80003-x. [DOI] [PubMed] [Google Scholar]
- 49.Kryger P, Schlichting P, Dietrichson O, Juhl E. The accuracy of the clinical diagnosis in acute hepatitis and alcoholic liver disease. Clinical versus morphological diagnosis. Scand J Gastroenterol. 1983;18:691–696. doi: 10.3109/00365528309181659. [DOI] [PubMed] [Google Scholar]
- 50.Mookerjee RP, Lackner C, Stauber R, Stadlbauer V, Deheragoda M, Aigelsreiter A, Jalan R. The role of liver biopsy in the diagnosis and prognosis of patients with acute deterioration of alcoholic cirrhosis. J Hepatol. 2011;55:1103–1111. doi: 10.1016/j.jhep.2011.02.021. [DOI] [PubMed] [Google Scholar]
Associated Data
This section collects any data citations, data availability statements, or supplementary materials included in this article.