

Abstract
Introduction
Very little is known about the impact of laryngotracheal stenosis on inspiratory airflow and resistance, especially in air hunger states. This study investigates the effect of laryngotracheal stenosis on airway resistance and volumetric flow across three different inspiratory pressures.
Methods
Head and neck CT scans of 11 subjects from 2010–2016 were collected. Three-dimensional reconstructions of the upper airway from the nostrils to carina, including the oral cavity, were created for one subject with a normal airway and ten patients with laryngotracheal stenosis. Airflow simulations were conducted using computational fluid dynamics modeling at three different inspiratory pressures (10, 25, 40 Pascals) for all subjects under two scenarios: inspiration through nostrils only (MC) and through both nostrils and mouth (MO).
Results
Volumetric flow in the normal subject at the three inspiratory pressures were considerably higher (MC: 11.8–26.1L/min; MO: 17.2–36.9L/min) compared to that in laryngotracheal stenosis (MC: 2.86–6.75L/min; MO: 4.11–9.00L/min). Airway resistances in the normal subject were 0.051–0.092Pa.s/mL (MC) and 0.035–0.065Pa.s/mL (MO), which were approximately tenfold lower than those of subjects with laryngeal stenosis: 0.39–0.89Pa.s/mL (MC) and 0.45–0.84Pa.s/mL (MO). Furthermore, subjects with glottic stenosis had the greatest resistance while subjects with subglottic stenosis had the greatest variability in resistance. Subjects with tracheal stenosis had the lowest resistance.
Conclusions
This pilot study demonstrates that laryngotracheal stenosis increases resistance and decreases airflow. Mouth breathing significantly improved airflow and resistance, but cannot completely compensate for the effects of stenosis. Furthermore, location of stenosis appears to modulate the effect of the stenosis on resistance differentially.
Level of Evidence
NA (basic sciences research)
Keywords: laryngotracheal stenosis, computational fluid dynamics, airflow, resistance, 3D reconstruction
Introduction
Laryngotracheal stenosis (LTS) is a narrowing of the endolaryngeal/endotracheal airway caused by intubation during surgery or in intensive care units, trauma, autoimmune disease, tracheal malignancy, or idiopathic causes.1–5 Patients characteristically present with stridor, complaints of dyspnea, and trouble phonating, which lead to significant respiratory morbidity and may progress to acute airway compromise if not properly managed.1,6 Diagnostic assessment for LTS include flexible laryngoscopy, bronchoscopy, pulmonary function tests, and computed tomography (CT).1,7 Treatment and care for LTS patients cross multiple specialists (e.g. otolaryngologists, thoracic surgeons, and interventional pulmonologists) and involve medical therapy, endoscopic dilation, and airway reconstruction.3,6,8–11
Although these treatments are often sufficient to relieve symptoms of LTS induced airway obstruction, the rate of recurrence is significant.4,12–17 There is lack of consensus regarding preventative treatment and surveillance because interventions for LTS are performed by multiple specialists with variable expertise and understanding of the underlying pathophysiology.3 Furthermore, the impact of the size and location of stenosis on changes in respiratory airflow and resistance have not been thoroughly investigated. Objective assessment of the magnitude and location of LTS on localized and global laryngeal aerodynamics is important to advance current understanding of the pathophysiology of LTS airway obstruction.
The complexity of LTS airway obstruction, coupled with the variable nature of LTS, can be better understood using contemporary computational tools to aid clinicians in the diagnosis and treatment of this condition. Computational fluid dynamics (CFD) modeling have shown significant promise in analyzing airflow profile and particle transport in the sinonasal cavity,18–36 as well as characterizing laryngeal flow circulation.37–54 However, CFD techniques have not been fully utilized in evaluating LTS induced airway obstruction. Thus, the aim of this study is to use CFD modeling to quantify changes in inspiratory airflow and resistance patterns in patients with varying locations and extent of stenosis. Our findings will provide insights regarding the degree to which breathing techniques affect LTS types and how stenosis location and severity influence airway patency.
Methods
Subjects
After approval by the Duke University Health System Institutional Review Board, ten subjects with LTS seen between January 1, 2006 and April 6, 2016 were identified for this study (Table 1). Inclusion criteria were [1] diagnosis of laryngotracheal stenosis; [2] between 18 and 89 years old; and [3] available computed tomography (CT) scan of the larynx and trachea. Additionally, a 28-year-old Caucasian male with a healthy normal respiratory airway was identified to serve as control.
Table 1. Subject characteristics.
The gender, age, and race of the subjects are shown in column one. The location of stenosis, length of stenosis, maximal size reduction in cross-sectional area, and maximal increase in resistance with mouth open or closed at 10Pa is also shown.
| Subject (Gender, Age, Race) | Location of Stenosis | Length of Stenosis | Maximal Size Reduction | Maximal Increase in resistance MC | Maximal Increase in resistance MO |
|---|---|---|---|---|---|
| Normal (M, 28y, C) | – | – | – | – | – |
| Subject 1 (M, 71y, C) | Tracheal | 2.72 | 52.57% | 21.96% | 30.24% |
| Subject 2 (F, 38y, C) | Tracheal | 2.30 | 53.54% | 2.37% | 9.04% |
| Subject 3 (M, 44y, C) | Tracheal | 1.29 | 45.82% | 1.00% | 1.38% |
| Subject 4 (F, 46y, B) | Glottic | 1.58 | 88.04% | 184.40% | 584.36% |
| Subject 5 (F, 51y, B) | Glottic | 2.78 | 95.17% | 944.82% | 3272.07% |
| Subject 6 (F, 58y, B) | Subglottic | 0.63 | 47.46% | 42.93% | 79.25% |
| Subject 7 (M, 77y, B) | Glottic | 3.75 | 95.89% | 334.53% | 1207.23% |
| Subject 8 (M, 76y, C) | Subglottic | 3.07 | 90.90% | 20.34% | 20.92% |
| Subject 9 (M, 45y, C) | Tracheal | 2.22 | 52.98% | 23.93% | 51.11% |
| Subject 10 (M, 75y, C) | Subglottic | 1.05 | 44.77% | 4.49% | 15.64% |
C=Caucasian, B=Black, MC=mouth closed, MO=mouth open
Airway Reconstruction
Radiographic images obtained from the subjects’ CT scans were read into imaging analysis software Avizo™ 8.1.1 (FEI, Burlington, MA) for de-identification and creation of anatomically realistic and subject-specific three-dimensional (3D) models of the laryngeal and tracheal airway. Laryngeal and tracheal airways were segmented during the creation of 3D models. Since most subjects’ CT excluded their nasal and oral cavities, we digitally appended the same anatomically realistic 3D nasal and oral cavities onto the laryngeal and tracheal 3D airway models of every subject to facilitate upper airway simulations to isolate the variability due to LTS. Appended nasal and oral cavities were scaled-to-size to conform to each subject’s laryngeal and tracheal airway model. All stenotic regions were confirmed with flexible laryngoscopy or bronchoscopy in clinic. The stenotic region on the 3D reconstruction was first identified and characterized without the aid of laryngoscopy or bronchoscopy notes, and the regions correlated well with the clinic notes.
Airflow Simulation
3D models were exported from Avizo® in stereolithography file format into the mesh-generation software package ICEM-CFD™ 16.1 (ANSYS, Canonsburg, PA). To solve the discretized governing equations of fluid flow, a hybrid tetrahedral-prism mesh was generated in ICEM-CFD™ with approximately six million graded unstructured tetrahedral elements. A finer three-layer prism-element with a 0.15mm prism thickness for each layer was created at the airway walls. Mesh quality analysis ensured that the aspect ratio for the hybrid mesh was adequately smoothed to prevent distorted elements from affecting the accuracy of our numerical simulations. The choice of mesh density chosen was consistent with a detailed mesh sensitivity analysis reported in Frank-Ito et al.39, which showed that about six million elements will provide mesh independent numerical results at the level of the entire model as well as the stenotic region. Thus, mesh refinement analysis was deemed unnecessary in this study as a graded mesh with about six million elements adequately captured all stenotic regions.
The CFD software package Fluent™ 16.1 (ANSYS, Inc., Canonsburg, PA) was used to carry out steady incompressible inspiratory airflow simulations in the airway under physiologic pressure-driven conditions that mimic actual inspiration. Inspiratory airflow simulations were performed for two inlet configurations: mouth closed - inspiration through nostrils only; mouth open - inspiration through nostrils and mouth with open lips. For each inlet configuration, inspiratory airflow simulations were performed at three different inspiratory pressures (10, 25, and 40 Pa). Turbulent airflow simulation was implemented using the shear-stress transport k-ω model, with low Reynolds number corrections.55,56 The turbulence length scale was set at 1 mm, and turbulent intensity was 5% at the inlet. The k-ω model has been reported to accurately predict pressure drop, velocity profiles, and shear stress from transition to turbulent flows.57–59 The following boundary conditions were utilized: pressure-outlet boundary condition at the outlet (carinawith gauge pressure set to either -10, -25, or -40 Pa. A pressure-inlet condition at the nostrils (and lips, for mouth open inlet configuration) was set to gauge pressure of zero. The airway walls in the respiratory passage were assumed to be stationary with zero velocity at the air-wall interface, and a no-slip shear condition.
Analysis of Computed Outcomes
To investigate LTS induced airway obstruction, quantities of interest computed were: [1] Volumetric flow rates (l/min); [2] Inspiratory airflow streamlines; [3] Resistance of airflow (Pa.s/ml); [4] Cross-sectional (local) resistance of airflow at multiple cross-sections in the stenotic segment, [5] Cross-sectional area (cm2) at multiple cross-sections along the stenotic segment, [6] Length of stenosis (cm), [7] Maximal change (size reduction) in airway constriction at stenotic segment, and [8] Maximal increase in local resistance in stenotic segment.
To calculate cross-sectional areas along the stenotic segment, 20 or 30 cross-sectional slices were created from the most cranial to the most caudal cross-sectional airspace plane depending on the length of stenosis. Cross-sectional areas were then calculated at these cross-sectional airspace planes. Resistance was calculated as ΔP/Q(Pa.s/ml) where ΔP is pressure drop from nostrils (for mouth closed simulations) or nostrils and mouth lips (for mouth open simulations) to the carina, and Q is volumetric flow rate. Local resistance at each cross-section along the stenotic segment was calculated as p/q (Pa.s/ml), where p is pressure at each cross-section and q is volumetric flow rate passing through that cross-section. Note that by conservation of mass, Q = q. Maximal change in airway constriction at the stenotic segment was calculated as , where S and L are the smallest and largest cross-sectional areas at the stenotic segment, respectively. The length of stenosis in each subject was computed by defining the most cranial and most caudal cross-sectional airspace planes of the stenosis segment in the 3D reconstructed airway. The anatomic locations chosen as the most cranial and most caudal cross-section airspace planes in the 3D models were based on clinic notes detailing the length and area of stenosis from endoscopies. Next, the distance between these two cross-sectional airspace planes was computed to define the length of stenosis (Table 1). Maximal increase in local resistance at the stenotic segment was calculated using the same formula as maximal change in airway constriction; however, in this case S and L are cross sections at the stenotic segment with lowest and highest local resistance values, respectively.
Results
Normal versus LTS
Airflow streamline patterns in the respiratory airway for inspiratory pressure of 40Pa are presented in Fig. 1. Flow in the larynx across all subjects was faster during inspiration with mouth open than with mouth closed. Laryngeal-tracheal flow was mostly swirling in Subject 3 (tracheal stenosis) and Subject 4 (glottic stenosis) compared to those in the normal subject and subject with subglottic stenosis (Subject 10). For mouth closed models, flow in the normal subject and Subject 10 appeared more uniform from nostrils to trachea than for Subjects 3 and 4.
FIGURE 1.
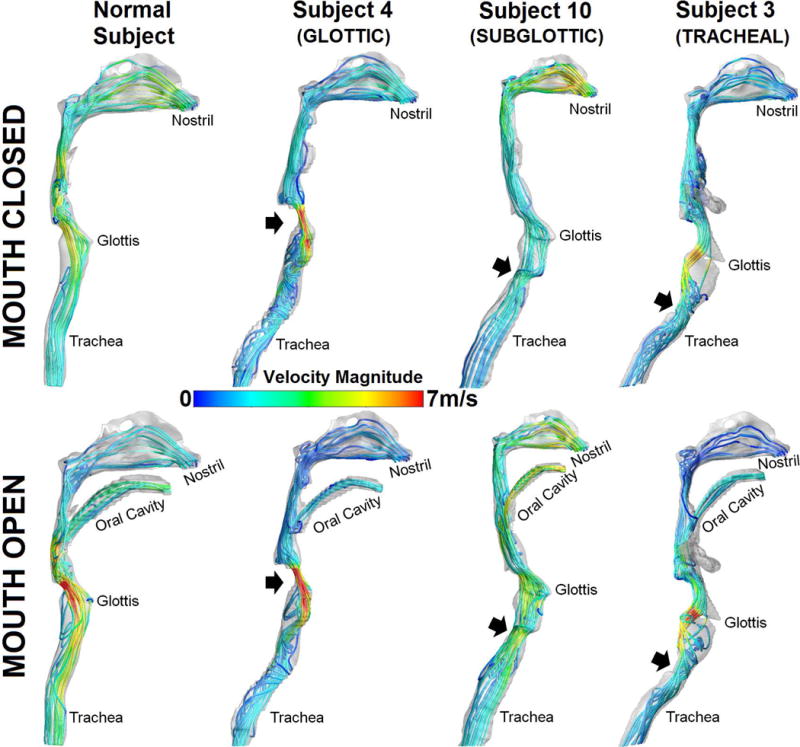
Airflow streamline patterns in normal and LTS subjects with colors coded velocity magnitudes.
Fig. 2 (top) shows comparison of flow rate between the normal and LTS subjects for inspiratory pressures of 10Pa, 25Pa, and 40Pa with mouth open or closed. Airflow rate across all inspiratory pressures for the normal subject ranged 11.79–26.15 L/min with mouth closed. In contrast, the minimum-to-maximum with mouth closed flow rates were 0.25 to 14.75 L/min, with medians of 2.57–5.79 L/min. Furthermore, inspiration with mouth closed resulted in lower flow rates than inspiration with mouth open for all subjects. In general, flow rate in the normal subject was notably greater than that of stenosis subjects regardless of inspiratory pressure or mouth open versus mouth closed.
FIGURE 2.
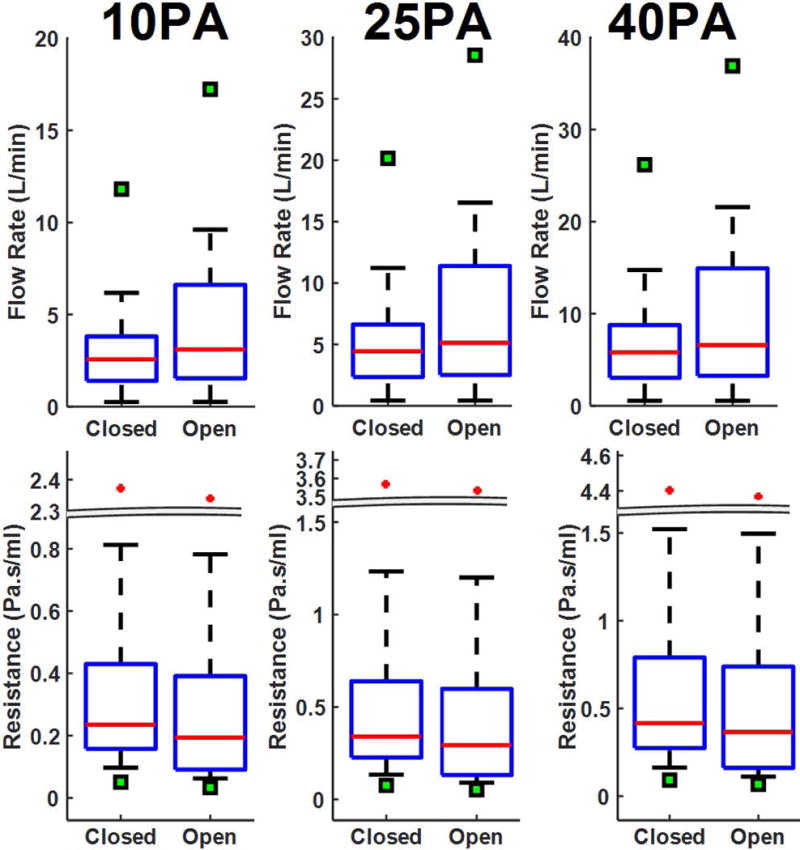
Volumetric airflow rate (TOP) and airflow resistance (BOTTOM) in normal and LTS subjects. Box plots describe the distribution in flow rate and resistance among LTS subjects, the cross shows outliers among LTS subjects, and the solid square denotes the normal subject.
Box plots describing differences in airflow resistance in the normal and stenosis subjects are shown in Fig. 2 (bottom). Airflow resistance in the normal subject was considerably lower than that of stenosis subjects. Resistance in the normal subject ranged 0.051–0.092 Pa.s/mL with mouth closed across the three inspiratory pressures. The minimum-to-maximum of airflow resistance was 0.097–0.416Pa.s/mL, with a median airflow resistance values of 0.235- 0.416 Pa.s/mL. For all subjects, airflow resistance increased as inspiratory pressure increased in both mouth open and closed scenarios.
Airflow resistance according to subjects’ anatomic location of stenosis for 10Pa inspiratory pressure simulations with mouth open showed that subjects with glottic stenosis collectively had higher resistance, but subglottic stenosis subjects had greater inter-subject variability (Fig.3). Tracheal stenosis subjects had the lowest inter-subject variability. The median (and range) airflow resistance for subjects with glottic, subglottic, and tracheal stenosis were 0.430 (0.448) Pa.s/mL, 0.157 (2.26) Pa.s/mL, and 0.196 (0.157) Pa.s/mL, respectively.
FIGURE 3.
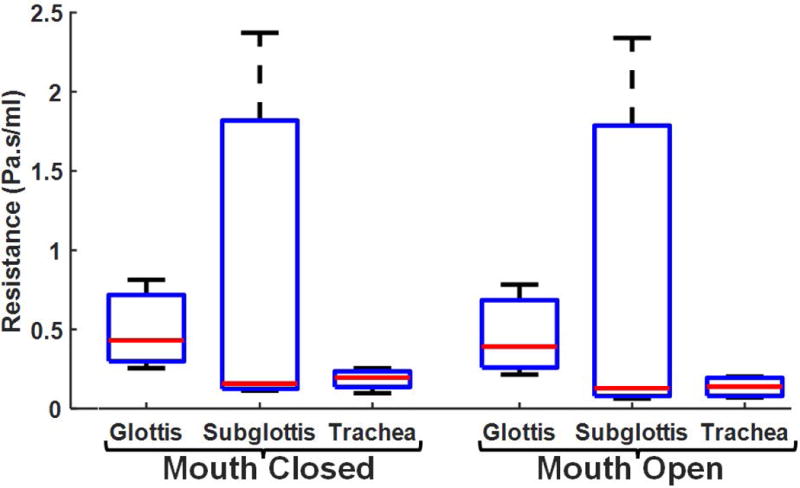
Airflow resistance differentiated by anatomic location of stenosis at inspiratory pressure of 10Pafor mouth-closed and mouth-open inspiratory simulations.
Quantifications around stenosis
The maximum length of stenosis among LTS subjects was 3.74cm; minimum = 0.63cm (Table 1). Table 1 also describes the maximal size reduction in stenotic segment between the largest and smallest cross-sectional areas for each subject. Subject 7 had the largest maximal airway constriction (size reduction) at the stenotic segment, with a 96% change in airway size between the largest and smallest cross-sectional areas along the stenotic segment. Subject 10 had the smallest maximal airway constriction, with a 45% change in airway size. Subjects with glottic stenosis had the greatest maximal airway constriction at the stenotic segment (88%- 96% change) while tracheal stenosis subjects had the least maximal airway constriction (46%-54%). Box plots depicting the cross-sectional airway size along the stenotic segment at the most cranial cross-sectional airspace plane (above), minimum cross-sectional area (min), and most caudal cross-sectional airspace plane (below) are presented in Fig. 4. In general, the airway is larger at the most cranial cross-sectional plane of the stenosis segment than at the most caudal cross-sectional airspace plane.
FIGURE 4.
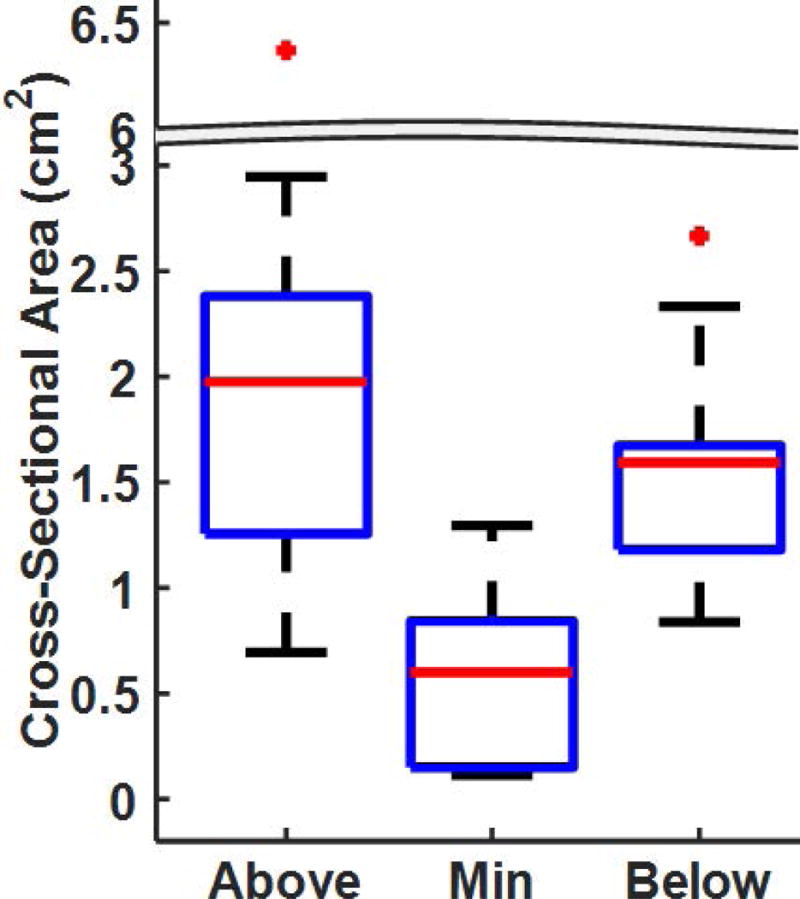
Cross-sectional area of the airspace along the stenotic segment at the most cranial cross-section(Above), the minimum cross-sectional airspace plane (Min), and the most caudal cross-section (Below).
Fig. 5 shows local airflow resistance along the stenotic segment at the most cranial cross-section, the minimum cross-section, and the most caudal cross-section during different inspiratory pressures with mouth closed. As expected, airflow resistance was lowest at the most cranial cross-section; resistance was elevated at both the minimum cross-section and the most caudal cross-section. Furthermore, the maximal increase in airflow resistance along the stenotic segment at 10Pa inspiratory pressure between the lowest and highest airflow resistance cross-sectional planes is listed in Table 1. Glottic stenosis subjects had the greatest maximal increase in local resistance along the stenotic segment; with maximal increase in local resistance of 184%- 945% and 584%-3272% for mouth closed and mouth open scenarios, respectively (Table 1). Maximal increase in local resistance along the stenotic segment for subglottic stenosis subjects ranged 4%-43% (mouth closed) and 16%-79% (mouth open). For tracheal stenosis subjects, the maximal increase were 1%-24% (mouth closed) and 1%-51% (mouth open).
FIGURE 5.
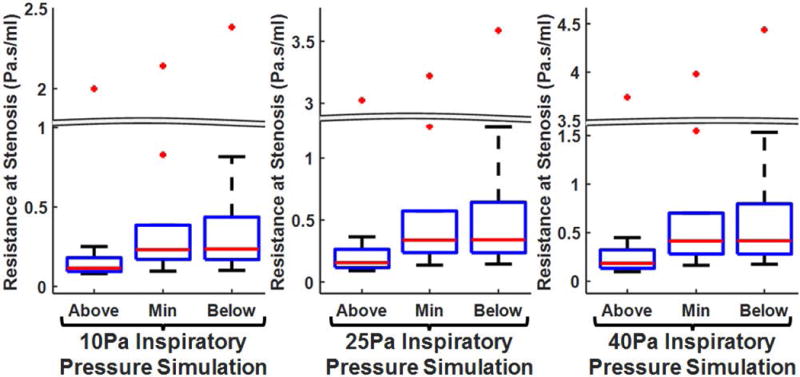
Cross-sectional (local) airflow resistance along stenotic segment at the most cranial cross-section (Above), the minimum cross-sectional airspace plane (Min), and the most caudal cross-section (Below) differentiated by simulated inspiratory pressures (10Pa, 25Pa and 40Pa) for mouth-closed simulation.
Box plots describing local airflow resistance (at 10Pa inspiratory pressure with mouth closed) along the stenotic segment grouped by subjects’ anatomic location of stenosis are presented in Fig. 6. Local resistance at the most cranial cross-section was lowest with marginal inter-subject variability among glottic stenosis subjects. However, at the minimum cross-sectional area plane and the most caudal cross-section, local resistance was lowest with relatively small inter-subject variability among tracheal stenosis subjects.
FIGURE 6.
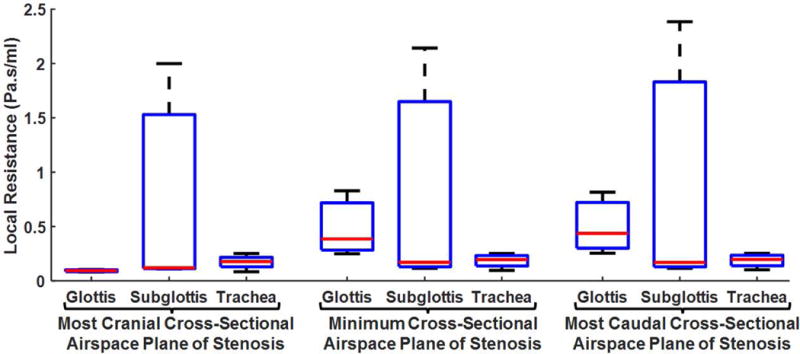
Cross-sectional (local) airflow resistance differentiated by location of stenosis at the most cranial cross-section, the minimum cross-sectional airspace plane, and the most caudal cross-section for 10Pa mouth-closed simulation.
In Fig. 7 we present plots describing changes in each subject’s cross-sectional areas and local resistance values from the most cranial to the most caudal cross-section along the stenotic segment. As expected, the changes in cross-sectional areas along the stenotic segment for majority of the subjects had a parabola-like shape, except for Subjects 5 (glottic stenosis) and 6 (subglottic stenosis). The rate of change in local resistance at different cross sections along the stenotic segment for most subjects increased considerably before reaching a peak around the vicinity of the minimum cross-sectional airspace area. Once resistance peaked somewhere within the vicinity of the minimum cross-sectional area, it remained elevated for most subjects until the most caudal cross-section of the stenotic segment. However, local resistance plots along the stenotic segment for Subjects 2 and 3, both with tracheal stenosis, were noticeably different from other subjects; unlike other subjects, resistance values in these two subjects were not lowest at the most cranial cross-sectional airspace plane of the stenotic segment.
FIGURE 7.
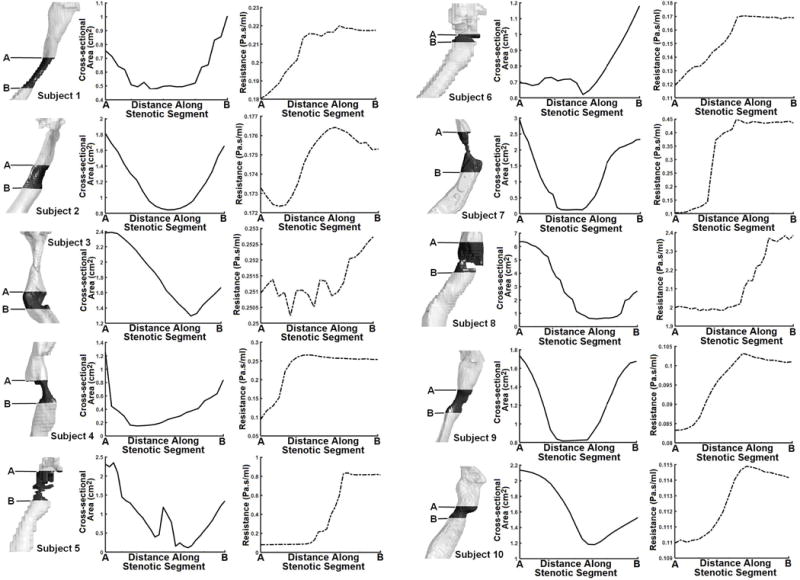
3D airspace model depicting subjects’ stenotic segment and their respective rates of change in cross-sectional area and cross-sectional airflow resistance from the most cranial cross-section (A) to most caudal cross-section (B). Cross-sectional airflow resistance results are for 40Pa mouth-closed scenario.
Discussion
Airway stenosis most frequently occurs in the larynx or the proximal trachea, and diagnosis as well as location of stenosis can be determined by flexible laryngoscope.8 All subjects in the current study had only one location of stenosis with a breakdown of 30% subglottic stenosis, 30% glottis stenosis, and 40% tracheal stenosis (Table 1). McCaffrey 60 reported that subglottic stenosis accounted for about 46% of all cases of LTS, followed by both subglottic and glottic stenosis (19%), and both subglottic and tracheal stenosis (18%). Gadkaree et al. 1 reported a population of 62% subglottic stenosis, 29% tracheal stenosis, and 9% multi-level stenosis. While both studies reported that subglottic stenosis is the most common, occurrence of the other types of stenosis and the numerical breakdown varies. The difference between these two studies and this pilot study may be due to our small sample size, which may not be representative of the population of LTS patients seen at Duke. Furthermore, since 90% of LTS patients have only one location of stenosis,1 our study did not include any subjects with multi-level stenosis. Isolating single lesions in different anatomic locations also allows a better understanding of airflow and airway resistance due to each lesion and further enables preliminary comparisons between the different subtypes of LTS. Our study population was consistent with Gadkaree et al. 1 with regards to length of stenosis. The mean length of stenosis in this pilot study was 2.1cm (range 0.6–3.8cm), Gadkaree et al. 1 reported a mean (± standard deviation) length of stenosis of 1.9±1.2cm. This suggests that while the breakdown for location of stenosis differ slightly among these studies, the inherent length of the stenosis remained consistent.
As expected, flow rate and resistance increased as inspiratory pressure increased for both mouth open and closed trials; however, the maximum increase in airflow among LTS subjects during inspiration with mouth open was still lower than the normal subject with mouth closed for a given inspiratory pressure (Fig. 2). This implies that while inspiration with mouth open may slightly increase airflow in LTS, it is not sufficient to restore airflow rate to normative levels.
Notice that increasing the inspiratory pressure from 10 to 25Pa with mouth open produces a maximum airflow rate among the LTS subjects that is higher than airflow rate of the normal subject at 10Pa with mouth closed. However, corresponding increase in inspiratory pressure from 25 to 40Pa for LTS subjects with mouth open does not yield higher flow rate than that of the normal subject at 25Pa with mouth closed. Furthermore, median airflow rate in LTS subjects at 40Pa with mouth open is considerably lower than airflow rate in the normal subject at 10Pa with mouth closed (Fig. 2).
When differentiated by anatomic location of stenosis (glottic, subglottic, and tracheal), subjects with glottic stenosis overall had the largest maximal airway size reduction at the stenotic segment (88%- 96%) as well as the largest maximal increase in local resistance along the stenotic segment. In contrast, Subject 8 with subglottic stenosis had a maximal airway size reduction of ~91%, but this subject’s maximal increase in local resistance was at least 10 fold lower than those of glottic stenosis subjects (Table 1). Fig. 6 provides further evidence of this finding. Whereas local resistance increases from the most cranial to the most caudal cross-sections regardless of location of stenosis, the magnitude of increase among glottic stenosis subjects was more prominent compared to subjects with subglottic and tracheal stenosis. In addition, two of four tracheal stenosis subjects (Subjects 2 and 3) did not have the lowest resistance at the most cranial cross-sectional airspace plane (Fig. 7). The relative airway dimensions of the glottis compared to the subglottis and trachea, combined with the additive effects of vocal fold adduction due to the Bernoulli effect, may relate to the increased resistance in our glottic compared to subglottic and trachea stenosis. This suggests that subglottic, glottic, and tracheal stenosis differ not only in terms of the anatomy of the stenosis but also in terms of airflow dynamics. Specifically, glottic and subglottic stenosis may affect resistance considerably more than more distal tracheal stenosis.
Although these results provide considerable insight into airflow and resistance in LTS subjects, there is a caveat in interpreting this study due to our small sample size. Ten LTS subjects were modeled in this study due to the intensive computational input required for each subject. This means that the results are inherently non-parametric, evidenced by the large range in resistance for the three subglottic stenosis subjects. Therefore, all results were reported using the minimums, maximums, and medians in the text. All figures show the minimums, maximums, medians, and interquartile ranges so skew would not significantly impact the interpretation and presentation of the data. However, while our preliminary findings need to be corroborated in larger studies and in multi-level stenosis, there are several potential clinical implications. Understanding of the resistance and airflow patterns in laryngotracheal stenosis allows analysis of how aerosolized drugs of various particle sizes concentrate and deposit at stenotic regions. This therefore may better facilitate delivery of aerosolized steroids or other anti-inflammatory agents to areas of stenosis as possible treatment strategies. For example, CFD techniques have been useful in assessing topical drug delivery and deposition in the sinonasal cavity.61,62 In addition, CFD modeling could potentially be used to assess various surgical treatments and their impact on airflow and airway resistance to aid treatment planning and assist patient counseling pre-operatively. The ability to assess the impact of surgical treatments on airflow and airway resistance could be particularly useful in multi-level stenosis.
Further studies could also explore whether patients with LTS have changes in their nasal and oral cavities that would impact downstream airflow and airway resistance. For example, Wegener’s granulomatosis patients may simultaneously have both nasal pathology and subglottic stenosis.63 However, since the most common cause of LTS is traumatic intubations, it is unlikely that, outside of specific situations such as Wegener’s granulomatosis, there will consistently be associated upstream geometry in the entire population that would affect downstream airflow and airway resistance. While our study did not address the impact of pulmonary function on airway mechanics in the setting of LTS, increased intrathoracic pressure during exhalation could potentially compress the upper airway with additional impact on airway resistance and airflow. Generating greater negative intrathoracic pressure during inhalation to overcome the upper airway airflow reduction could bring additive effects on upper airway resistance at the glottic level due to the Bernouilli effect. In addition, it is not clear how pulmonary disease may affect airflow mechanics in patients with LTS. However, as respiratory function for patients with COPD, asthma, and pulmonary fibrosis can be characterized by flow volume loops reflecting intrathoracic pathology, the addition of extrathoracic resistance for patients with LTS can also affect inspiratory and expiratory function in patients with shortness of breath.64 Therefore, comprehensive management and monitoring of patients with LTS needs to include an assessment of both pulmonary and vocal cord function.65
In conclusion, this study investigated the effect of LTS on airflow dynamics using CFD techniques. Simulated flow results from a normal and ten LTS subjects were analyzed to characterize the changes in flow rate, airflow resistance, and streamlines of velocity. Our preliminary results show that 1) airflow is so reduced in LTS that increased inspiratory pressure resulted in more airflow at the expense of greater increase in resistance, 2) glottic stenosis may impact resistance more than subglottic or tracheal stenosis, and 3) resistance remains markedly elevated distal to the stenosis. To the best of the authors’ knowledge, this is the first study to use CFD techniques to quantify these changes in multiple LTS subjects with varying locations of stenosis. Future directions include quantifying aerosolized drug delivery and determining the effect of surgery and endoscopic treatments.
Acknowledgments
Research reported in this article was supported in part by the National Institutes of Health under Award Numbers T32DC013018-03. The content is solely the responsibility of the authors and does not represent the official views of the National Institutes of Health. The authors would like to thank ANSYS, Drs. Paolo Maccarini, and Murali Kadiramangalam (ANSYS Global Academic Program Director) for support and strategic donation. All authors gave final approval for publication.
Footnotes
Presented at ALA, San Diego, CA, USA, 4/27/17
There are no financial disclosures or conflicts of interest to be declared for any of the authors of this manuscript
References
- 1.Gadkaree SK, Pandian V, Best S, et al. Laryngotracheal Stenosis. Otolaryngology–head and neck surgery: official journal of American Academy of Otolaryngology-Head and Neck Surgery. 2017;156:321–328. doi: 10.1177/0194599816675323. [DOI] [PMC free article] [PubMed] [Google Scholar]
- 2.Nouraei SA, Winterborn C, Nouraei SM, et al. Quantifying the physiology of laryngotracheal stenosis: changes in pulmonary dynamics in response to graded extrathoracic resistive loading. The Laryngoscope. 2007;117:581–588. doi: 10.1097/MLG.0b013e3180310574. [DOI] [PubMed] [Google Scholar]
- 3.Gelbard A, Francis DO, Sandulache VC, Simmons JC, Donovan DT, Ongkasuwan J. Causes and consequences of adult laryngotracheal stenosis. The Laryngoscope. 2015;125:1137–1143. doi: 10.1002/lary.24956. [DOI] [PMC free article] [PubMed] [Google Scholar]
- 4.Rosow DE, Barbarite E. Review of adult laryngotracheal stenosis: pathogenesis, management, and outcomes. Current opinion in otolaryngology & head and neck surgery. 2016;24:489–493. doi: 10.1097/MOO.0000000000000305. [DOI] [PubMed] [Google Scholar]
- 5.Nouraei SA, Singh A, Patel A, Ferguson C, Howard DJ, Sandhu GS. Early endoscopic treatment of acute inflammatory airway lesions improves the outcome of postintubation airway stenosis. Laryngoscope. 2006;116:1417–1421. doi: 10.1097/01.mlg.0000225377.33945.14. [DOI] [PubMed] [Google Scholar]
- 6.Hillel AT, Karatayli-Ozgursoy S, Benke JR, et al. Voice quality in laryngotracheal stenosis: impact of dilation and level of stenosis. Ann Otol Rhinol Laryngol. 2015;124:413–418. doi: 10.1177/0003489414564249. [DOI] [PubMed] [Google Scholar]
- 7.Solly WR, O’Connell RJ, Lee HJ, Sterman DH, Haas AR. Diagnosis of idiopathic tracheal stenosis and treatment with papillotome electrocautery and balloon bronchoplasty. Respir Care. 2011;56:1617–1620. doi: 10.4187/respcare.01143. [DOI] [PubMed] [Google Scholar]
- 8.Bitar MA, Al Barazi R, Barakeh R. Airway reconstruction: review of an approach to the advanced-stage laryngotracheal stenosis. Braz J Otorhinolaryngol. 2016 doi: 10.1016/j.bjorl.2016.03.012. [DOI] [PMC free article] [PubMed] [Google Scholar]
- 9.Herrington HC, Weber SM, Andersen PE. Modern management of laryngotracheal stenosis. The Laryngoscope. 2006;116:1553–1557. doi: 10.1097/01.mlg.0000228006.21941.12. [DOI] [PubMed] [Google Scholar]
- 10.Hoffman GS, Thomas-Golbanov CK, Chan J, Akst LM, Eliachar I. Treatment of subglottic stenosis, due to Wegener’s granulomatosis, with intralesional corticosteroids and dilation. J Rheumatol. 2003;30:1017–1021. [PubMed] [Google Scholar]
- 11.McCaffrey TV. Management of laryngotracheal stenosis on the basis of site and severity. Otolaryngology–head and neck surgery: official journal of American Academy of Otolaryngology-Head and Neck Surgery. 1993;109:468–473. doi: 10.1177/019459989310900313. [DOI] [PubMed] [Google Scholar]
- 12.Jovic RM, Dragicevic D, Komazec Z, Mitrovic S, Janjevic D, Gasic J. Laryngotracheal stenosis and restenosis. What has the influence on the final outcome? European archives of oto-rhino-laryngology: official journal of the European Federation of Oto-Rhino-Laryngological Societies. 2012;269:1805–1811. doi: 10.1007/s00405-012-1940-8. [DOI] [PubMed] [Google Scholar]
- 13.Abbasidezfouli A, Akbarian E, Shadmehr MB, et al. The etiological factors of recurrence after tracheal resection and reconstruction in post-intubation stenosis. Interact Cardiovasc Thorac Surg. 2009;9:446–449. doi: 10.1510/icvts.2009.202978. [DOI] [PubMed] [Google Scholar]
- 14.George M, Lang F, Pasche P, Monnier P. Surgical management of laryngotracheal stenosis in adults. European archives of oto-rhino-laryngology: official journal of the European Federation of Oto-Rhino-Laryngological Societies. 2005;262:609–615. doi: 10.1007/s00405-004-0887-9. [DOI] [PubMed] [Google Scholar]
- 15.Gunaydin RO, Suslu N, Bajin MD, et al. Endolaryngeal dilatation versus laryngotracheal reconstruction in the primary management of subglottic stenosis. Int J Pediatr Otorhinolaryngol. 2014;78:1332–1336. doi: 10.1016/j.ijporl.2014.05.022. [DOI] [PubMed] [Google Scholar]
- 16.Madariaga ML, Gaissert HA. Reresection for recurrent stenosis after primary tracheal repair. J Thorac Dis. 2016;8:S153–159. doi: 10.3978/j.issn.2072-1439.2016.01.66. [DOI] [PMC free article] [PubMed] [Google Scholar]
- 17.Sinacori JT, Taliercio SJ, Duong E, Benson C. Modalities of treatment for laryngotracheal stenosis: the EVMS experience. The Laryngoscope. 2013;123:3131–3136. doi: 10.1002/lary.24237. [DOI] [PubMed] [Google Scholar]
- 18.Cannon DE, Frank DO, Kimbell JS, Poetker DM, Rhee JS. Modeling nasal physiology changes due to septal perforations. Otolaryngol Head Neck Surg. 2013;148:513–518. doi: 10.1177/0194599812472881. [DOI] [PMC free article] [PubMed] [Google Scholar]
- 19.Choi KJ, Jang DW, Ellison MD, Frank-Ito DO. Characterizing airflow profile in the postoperative maxillary sinus by using computational fluid dynamics modeling: A pilot study. Am J Rhinol Allergy. 2016;30:29–36. doi: 10.2500/ajra.2016.30.4266. [DOI] [PubMed] [Google Scholar]
- 20.Frank DO, Kimbell JS, Cannon D, Pawar SS, Rhee JS. Deviated nasal septum hinders intranasal sprays: a computer simulation study. Rhinology. 2012;50:311–318. doi: 10.4193/Rhin. [DOI] [PMC free article] [PubMed] [Google Scholar]
- 21.Frank DO, Kimbell JS, Cannon D, Rhee JS. Computed intranasal spray penetration: comparisons before and after nasal surgery. International forum of allergy & rhinology. 2013;3:48–55. doi: 10.1002/alr.21070. [DOI] [PMC free article] [PubMed] [Google Scholar]
- 22.Frank DO, Kimbell JS, Pawar S, Rhee JS. Effects of Anatomy and Particle Size on Nasal Sprays and Nebulizers. Otolaryngol Head Neck Surg. 2011 doi: 10.1177/0194599811427519. [DOI] [PMC free article] [PubMed] [Google Scholar]
- 23.Frank DO, Zanation AM, Dhandha VH, et al. Quantification of airflow into the maxillary sinuses before and after functional endoscopic sinus surgery. International forum of allergy & rhinology. 2013;3:834–840. doi: 10.1002/alr.21203. [DOI] [PMC free article] [PubMed] [Google Scholar]
- 24.Frank-Ito DO, Kimbell JS, Laud P, Garcia GJ, Rhee JS. Predicting postsurgery nasal physiology with computational modeling: current challenges and limitations. Otolaryngol Head Neck Surg. 2014;151:751–759. doi: 10.1177/0194599814547497. [DOI] [PMC free article] [PubMed] [Google Scholar]
- 25.Frank-Ito DO, Sajisevi M, Solares CA, Jang DW. Modeling alterations in sinonasal physiology after skull base surgery. Am J Rhinol Allergy. 2015;29:145–150. doi: 10.2500/ajra.2015.29.4150. [DOI] [PubMed] [Google Scholar]
- 26.Frank-Ito DO, Wofford M, Schroeter JD, Kimbell JS. Influence of Mesh Density on Airflow and Particle Deposition in Sinonasal Airway Modeling. J Aerosol Med Pulm Drug Deliv. 2015 doi: 10.1089/jamp.2014.1188. [DOI] [PMC free article] [PubMed] [Google Scholar]
- 27.Keeler JA, Patki A, Woodard CR, Frank-Ito DO. A Computational Study of Nasal Spray Deposition Pattern in Four Ethnic Groups. J Aerosol Med Pulm Drug Deliv. 2016;29:153–166. doi: 10.1089/jamp.2014.1205. [DOI] [PMC free article] [PubMed] [Google Scholar]
- 28.Kimbell JS, Frank DO, Laud P, Garcia GJ, Rhee JS. Changes in nasal airflow and heat transfer correlate with symptom improvement after surgery for nasal obstruction. J Biomech. 2013;46:2634–2643. doi: 10.1016/j.jbiomech.2013.08.007. [DOI] [PMC free article] [PubMed] [Google Scholar]
- 29.Kimbell JS, Garcia GJ, Frank DO, Cannon DE, Pawar SS, Rhee JS. Computed nasal resistance compared with patient-reported symptoms in surgically treated nasal airway passages: a preliminary report. Am J Rhinol Allergy. 2012;26:e94–98. doi: 10.2500/ajra.2012.26.3766. [DOI] [PMC free article] [PubMed] [Google Scholar]
- 30.Patel RG, Garcia GJ, Frank-Ito DO, Kimbell JS, Rhee JS. Simulating the Nasal Cycle with Computational Fluid Dynamics. Otolaryngol Head Neck Surg. 2014 doi: 10.1177/0194599814559385. [DOI] [PMC free article] [PubMed] [Google Scholar]
- 31.Patki A, Frank-Ito DO. Characterizing human nasal airflow physiologic variables by nasal index. Respir Physiol Neurobiol. 2016;232:66–74. doi: 10.1016/j.resp.2016.07.004. [DOI] [PubMed] [Google Scholar]
- 32.Ramprasad VH, Frank-Ito DO. A computational analysis of nasal vestibule morphologic variabilities on nasal function. J Biomech. 2016;49:450–457. doi: 10.1016/j.jbiomech.2016.01.009. [DOI] [PubMed] [Google Scholar]
- 33.Rhee JS, Cannon DE, Frank DO, Kimbell JS. Role of virtual surgery in preoperative planning: assessing the individual components of functional nasal airway surgery. Arch Facial Plast Surg. 2012;14:354–359. doi: 10.1001/archfacial.2012.182. [DOI] [PMC free article] [PubMed] [Google Scholar]
- 34.Shadfar S, Shockley WW, Fleischman GM, et al. Characterization of postoperative changes in nasal airflow using a cadaveric computational fluid dynamics model: supporting the internal nasal valve. JAMA Facial Plast Surg. 2014;16:319–327. doi: 10.1001/jamafacial.2014.395. [DOI] [PMC free article] [PubMed] [Google Scholar]
- 35.Sullivan CD, Garcia GJ, Frank-Ito DO, Kimbell JS, Rhee JS. Perception of better nasal patency correlates with increased mucosal cooling after surgery for nasal obstruction. Otolaryngol Head Neck Surg. 2014;150:139–147. doi: 10.1177/0194599813509776. [DOI] [PMC free article] [PubMed] [Google Scholar]
- 36.Wofford MR, Kimbell JS, Frank-Ito DO, et al. A computational study of functional endoscopic sinus surgery and maxillary sinus drug delivery. Rhinology. 2015;53:41–48. doi: 10.4193/Rhin13.065. [DOI] [PMC free article] [PubMed] [Google Scholar]
- 37.Khosla S, Murugappan S, Gutmark E. What can vortices tell us about vocal fold vibration and voice production. Curr Opin Otolaryngol Head Neck Surg. 2008;16:183–187. doi: 10.1097/MOO.0b013e3282ff5fc5. [DOI] [PubMed] [Google Scholar]
- 38.Mihaescu M, Khosla SM, Murugappan S, Gutmark EJ. Unsteady laryngeal airflow simulations of the intra-glottal vortical structures. J Acoust Soc Am. 2010;127:435–444. doi: 10.1121/1.3271276. [DOI] [PMC free article] [PubMed] [Google Scholar]
- 39.Frank-Ito DO, Schulz K, Vess G, Witsell DL. Changes in aerodynamics during vocal cord dysfunction. Comput Biol Med. 2014;57C:116–122. doi: 10.1016/j.compbiomed.2014.12.004. [DOI] [PubMed] [Google Scholar]
- 40.Farbos de Luzan C, Chen J, Mihaescu M, Khosla SM, Gutmark E. Computational study of false vocal folds effects on unsteady airflows through static models of the human larynx. J Biomech. 2015;48:1248–1257. doi: 10.1016/j.jbiomech.2015.03.010. [DOI] [PMC free article] [PubMed] [Google Scholar]
- 41.Luo HX, Mittal R, Bielamowicz SA. Analysis of flow-structure interaction in the larynx during phonation using an immersed-boundary method. J Acoust Soc Am. 2009;126:816–824. doi: 10.1121/1.3158942. [DOI] [PMC free article] [PubMed] [Google Scholar]
- 42.Xue Q, Mittal R, Zheng X, Bielamowicz S. Computational modeling of phonatory dynamics in a tubular three-dimensional model of the human larynx. J Acoust Soc Am. 2012;132:1602–1613. doi: 10.1121/1.4740485. [DOI] [PMC free article] [PubMed] [Google Scholar]
- 43.Xue Q, Mittal R, Zheng X, Bielamowicz S. A computational study of the effect of vocal-fold asymmetry on phonation. J Acoust Soc Am. 2010;128:818–827. doi: 10.1121/1.3458839. [DOI] [PMC free article] [PubMed] [Google Scholar]
- 44.Zheng XD, Bielamowicz S, Luo HX, Mittal R. A Computational Study of the Effect of False Vocal Folds on Glottal Flow and Vocal Fold Vibration During Phonation. Ann Biomed Eng. 2009;37:625–642. doi: 10.1007/s10439-008-9630-9. [DOI] [PMC free article] [PubMed] [Google Scholar]
- 45.Grisel J, Khosla S, Murugappan S, et al. How does the absence or presence of subglottal medialization affect glottal airflow? Ann Otol Rhinol Laryngol. 2010;119:559–566. doi: 10.1177/000348941011900809. [DOI] [PubMed] [Google Scholar]
- 46.Khosla S, Murugappan S, Paniello R, Ying J, Gutmark E. Role of vortices in voice production: normal versus asymmetric tension. Laryngoscope. 2009;119:216–221. doi: 10.1002/lary.20026. [DOI] [PubMed] [Google Scholar]
- 47.Mihaescu M, Murugappan S, Kalra M, Khosla S, Gutmark E. Large Eddy Simulation and Reynolds-Averaged Navier-Stokes modeling of flow in a realistic pharyngeal airway model: an investigation of obstructive sleep apnea. J Biomech. 2008;41:2279–2288. doi: 10.1016/j.jbiomech.2008.04.013. [DOI] [PubMed] [Google Scholar]
- 48.Murugappan S, Khosla S, Casper K, Oren L, Gutmark E. Flow fields and acoustics in a unilateral scarred vocal fold model. Ann Otol Rhinol Laryngol. 2009;118:44–50. doi: 10.1177/000348940911800108. [DOI] [PubMed] [Google Scholar]
- 49.Gökcan MK, Kurtuluş DF, Üstüner E, et al. A computational study on the characteristics of airflow in bilateral abductor vocal fold immobility. The Laryngoscope. 2010;120:1808–1818. doi: 10.1002/lary.21003. [DOI] [PubMed] [Google Scholar]
- 50.Mylavarapu G, Murugappan S, Mihaescu M, Kalra M, Khosla S, Gutmark E. Validation of computational fluid dynamics methodology used for human upper airway flow simulations. J Biomech. 2009;42:1553–1559. doi: 10.1016/j.jbiomech.2009.03.035. [DOI] [PubMed] [Google Scholar]
- 51.Oren L, Khosla S, Gutmark E. Effect of vocal fold asymmetries on glottal flow. Laryngoscope. 2016;126:2534–2538. doi: 10.1002/lary.25948. [DOI] [PMC free article] [PubMed] [Google Scholar]
- 52.Oren L, Khosla S, Gutmark E. Comparison of glottal flow rate characteristics based on experimental and computational data. J Acoust Soc Am. 2015;138:2427–2429. doi: 10.1121/1.4932022. [DOI] [PMC free article] [PubMed] [Google Scholar]
- 53.Oren L, Khosla S, Gutmark E. Intraglottal pressure distribution computed from empirical velocity data in canine larynx. J Biomech. 2014;47:1287–1293. doi: 10.1016/j.jbiomech.2014.02.023. [DOI] [PMC free article] [PubMed] [Google Scholar]
- 54.Oren L, Khosla S, Murugappan S, King R, Gutmark E. Role of subglottal shape in turbulence reduction. Ann Otol Rhinol Laryngol. 2009;118:232–240. doi: 10.1177/000348940911800312. [DOI] [PubMed] [Google Scholar]
- 55.Menter FR. Two-equation eddy-viscosity turbulence models for engineering applications. AIAA journal. 1994;32:1598–1605. [Google Scholar]
- 56.Menter FR. Review of the shear-stress transport turbulence model experience from an industrial perspective. International Journal of Computational Fluid Dynamics. 2009;23:305–316. [Google Scholar]
- 57.Ghalichi F, Deng X, De Champlain A, Douville Y, King M, Guidoin R. Low Reynolds number turbulence modeling of blood flow in arterial stenoses. Biorheology. 1998;35:281–294. doi: 10.1016/s0006-355x(99)80011-0. [DOI] [PubMed] [Google Scholar]
- 58.Wilcox DC. Turbulence modeling for CFD. DCW industries; La Canada, CA: 1998. [Google Scholar]
- 59.Longest PW, Hindle M. CFD simulations of enhanced condensational growth (ECG) applied to respiratory drug delivery with comparisons to in vitro data. J Aerosol Sci. 2010;41:805–820. doi: 10.1016/j.jaerosci.2010.04.006. [DOI] [PMC free article] [PubMed] [Google Scholar]
- 60.McCaffrey TV. Classification of laryngotracheal stenosis. Laryngoscope. 1992;102:1335–1340. doi: 10.1288/00005537-199212000-00004. [DOI] [PubMed] [Google Scholar]
- 61.Kimbell JS, Segal RA, Asgharian B, et al. Characterization of deposition from nasal spray devices using a computational fluid dynamics model of the human nasal passages. J Aerosol Med. 2007;20:59–74. doi: 10.1089/jam.2006.0531. [DOI] [PubMed] [Google Scholar]
- 62.Schroeter JD, Kimbell JS, Asgharian B. Analysis of particle deposition in the turbinate and olfactory regions using a human nasal computational fluid dynamics model. J Aerosol Med. 2006;19:301–313. doi: 10.1089/jam.2006.19.301. [DOI] [PubMed] [Google Scholar]
- 63.Gluth MB, Shinners PA, Kasperbauer JL. Subglottic stenosis associated with Wegener’s granulomatosis. The Laryngoscope. 2003;113:1304–1307. doi: 10.1097/00005537-200308000-00008. [DOI] [PubMed] [Google Scholar]
- 64.Nouraei SAR, Winterborn C, Nouraei SM, et al. Quantifying the physiology of laryngotracheal stenosis: changes in pulmonary dynamics in response to graded extrathoracic resistive loading. The Laryngoscope. 2007;117:581–588. doi: 10.1097/MLG.0b013e3180310574. [DOI] [PubMed] [Google Scholar]
- 65.Low K, Ruane L, Uddin N, et al. Abnormal vocal cord movement in patients with and without airway obstruction and asthma symptoms. Clin Exp Allergy. 2017;47:200–207. doi: 10.1111/cea.12828. [DOI] [PubMed] [Google Scholar]