

Abstract
Background
A desperate need for novel therapies in pediatric ependymoma (EPN) exists, as chemotherapy remains ineffective and radiotherapy often fails. EPN have significant infiltration of immune cells, which correlates with outcome. Immune checkpoint inhibitors provide an avenue for new treatments. This study characterizes tumor infiltrating immune cells in EPN and aims at predicting candidates for clinical trials using checkpoint inhibitors targeting PD-L1/PD-1.
Methods
The transcriptomic profiles of the primary study cohort of EPN and other pediatric brain tumors were interrogated to identify PD-L1 expression levels. Transcriptomic findings were validated using western blotting, immunohistochemistry and flow cytometry.
Results
We evaluated PD-L1 mRNA expression across four intracranial subtypes of EPN in two independent cohorts and found supratentorial RELA fusion (RELA) tumors to have significantly higher levels. There was a correlation between high gene expression and protein PD-L1 levels in RELA tumors by both Western blot and immunohistochemisty. Investigation of EPN cell populations revealed PD-L1 was expressed on both tumor and myeloid cells in RELA. Other subtypes had little PD-L1 in either tumor or myeloid cell compartments. Lastly, we measured PD-1 levels on tumor infiltrating T-cells and found RELA tumors express PD-1 in both CD4 and CD8 T-cells. A functional T-cell exhaustion assay found RELA T-cells to be exhausted and unable to secrete IFNγ on stimulation.
Conclusions
These findings in RELA suggest tumor evasion and immunsuppression due to PD-L1/PD-1 mediated T-cell exhaustion. Trials of checkpoint inhibitors in EPN should be enriched for RELA tumors.
Keywords: C11orf95-RELA, Ependymoma, PD-L1, PD-1, Immunsuppression
Introduction
Pediatric ependymoma (EPN) is the third most common central nervous system (CNS) tumor and these tumors usually arise from the lining of the ventricles of the CNS1. EPN present intracranially as four main types, two in the supratentorial space and two in the posterior fossa. Posterior fossa EPN arise in the 4th ventricle and are divided on the basis of expression and methylation into Group A and Group B. Each sub-type of EPN possesses unique clinical characteristics, prognosis, microarray gene expression profiles, and mutations2. Supratentorial EPN are divided based on mutational drivers namely, C11orf95-RELA (RELA) fusions and YAP1 (YAP) fusions. These two supratentorial subtypes are genetically and clinically distinct with data suggesting RELA patients have a poorer outcome than those with YAP3. As is the case in all intracranial EPN, there is little evidence that chemotherapy benefits RELA patients and treatment for these patients has remained stagnant with gross total resection and radiation as the standard of care. It is critical to develop new treatment strategies for these patients.
Immune checkpoint inhibitors, which overcome tumor associated immunosuppression, have proven effective in several adult tumors4 and has become a particular interest in brain tumors5. One class of these inhibitors target the interaction of Programmed Cell Death Ligand 1(PD-L1) and its receptor Programmed death 1(PD-1). PD-1 is expressed on antigen-activated T-cells, B-cells, natural killer cells, and often on tumor infiltrating leukocytes, while its ligand, PD-L1 is normally expressed on dendritic cells, myeloid cells, and epithelial cells. The PD-1/PD-L1 axis in physiologic conditions helps to mitigate and dampen the immune response to a stimulus6. In the context of tumors, PD-L1 is found on tumor cells and on infiltrating myeloid cells. As PD-1 and PD-L1 interact, T-cells activity is diminished and they take on an exhausted phenotype7. Preventing this PD-L1/PD-1 interaction by a PD-1 inhibitor, such as pembroluzimab and nivolumab, has shown antitumor effects by reversing T-cell exhaustion. These agents are now approved in certain adult tumors, such as melanoma8. With respect to CNS tumors, there is evidence in adult glioblastoma that PD-1’s interaction with PD-L1 contributes to the profound immunosuppression seen in this tumor5. Our lab has shown that EPN have significant infiltration of immune cells9. We have also shown that the phenotype of these immune cells correlate with outcome and molecular subtypes in the tumor immune microenvironment of posterior fossa EPN10 and therefore investigation of immune therapies in this tumor is particularly important.
Given that PD-L1 expression on patient tumors is a current predictive marker of response to PD-1 checkpoint blockade11, the aim of our current study was to evaluate supratentorial and posterior fossa EPN for PD-L1/PD-1. We examined PD-L1 transcript and protein expression levels across EPN supratentorial subtypes and posterior fossa subtypes. Flow cytometry was also utilized to identify which EPN microenvironment cell type expressed PD-L1 protein and to characterize the tumor infiltrating immune cells. These studies may predict which EPN patients will have a positive response to future clinical trials with PD-L1/PD-1 checkpoint inhibitors in pediatrics.
Materials and Methods
Study Approval
Primary patient tumor and normal brain samples were obtained from Children’s Hospital Colorado and collected in accordance with local and federal human research protection guidelines and institutional review board regulations (COMIRB 95-500 and 09-0906). Informed consent was obtained for all specimens collected.
Transcriptomic analysis
The primary study cohort of EPN samples consists of: 20 primary Group A EPNs, 21 primary Group B EPNs, 9 recurrent Group A EPNs, 8 recurrent Group B EPNs, 11 RELA EPNs, 2 YAP EPNs, and 5 myxopapillary (Myxo) EPNs. Transcriptomic profiles from each sample were interrogated using the Human Genome U133plus2 Array (Affymetrix) platform as described previously10. Posterior fossa EPN subgrouping was determined using nonnegative matrix factorization clustering analysis as previously described12. Supratentorial EPN subgrouping was determined using signature transcript genes, ARL4D (Probeset ID#203586), CLDN1 (222549), RELA (201783), L1CAM (204584) as described by Patjler et al3. We then validated these findings by examining RELA fusion protein in a subset of the characterized samples by western blot analysis. From this transcriptomic dataset we extracted PD-L1 (CD274, Geneprobe #227458) to identify association of PD-L1 expression with the respective EPN subtypes. These results were validated in part using an independent EPN patient cohort3.
We then extrapolated gene expression of PD-L1 from all pediatric and adult tumors in our expanded cohort, which includes 9 Diffuse Intrinsic Pontine Gliomas, 15 Supratentorial Glioblastomas, 6 Thalamic Glioblastomas, 4 Posterior Fossa/Spinal Glioblastomas, 4 infant Glioblastomas, 11 Radiation Induced Gliomas, 14 adult Glioblastomas, 2 WNT Medullobastomas, 12Sonic Hedgehog Medulloblastomas, 14 Group 3 Medulloblastomas, 17 Group 4 Medulloblastomas, 27 Atypical Teratoid Rhabdoid Tumor, 6 Pleomorphic Xanthoastrocytoma, 12 posterior fossa Pilocytic Astrocytoma, 7 Supratentorial Pilocytic Astrocytoma, 4 Supratentorial Ganglioglioma, 8 Posterior Fossa Ganglioglioma, 27 Adamantinomatous Craniopharyngioma, 10 Meningiomas, 17 Embryonal Tumors, and 5 Choroid Plexus Papillomas. Twenty seven normal brain samples obtained from autopsy or epilepsy surgery were included as controls.
Western Immunoblots
Lysates were extracted from 9 RELA, 2 YAP, 13 Group A, 9 Group B, and 6 Normal brain samples. Primary antibodies used were PD-L1 (Cell Signaling; 13684, cloneE1L3N), RELA (Cell Signaling; 8242, clone D14E12), and β-actin (Cell Signaling; 12262, clone 8H10D10) was used as protein loading control. Bands were visualized with Immobilon Western Chemiluminescent HRP substrate (Millipore) on a Syngene G Box imager. Densitometry measurements were made using ImageJ software.
Immunohistochemistry
Formalin-fixed paraffin-embedded sections were stained using standard immunohistochemical techniques for CD4 and CD8 and cell numbers per high-power field were scored as previously described10. PD-L1 was performed using rabbit monoclonal PD-L1/CD274 (SP263) antibody (Ventana/Spring Bioscience). The antibody was used according to the manufacturer’s protocol. For PD-L1, a subjective scoring scale was used. Scoring incorporated images in multiple microscopic fields. IHC was scored as zero (0) if no cells were positive. Very rare (<1% overall) IHC-positive cells confined to the extreme edge/perimeter of tumor were not counted, especially if adjacent to normal nontumorous CNS tissue. Tumors were scored as 1 if weak IHC positivity was seen, with scattered positive tumor and myeloid staining. Tumors with medium IHC positivity were scored as 2. Those with high positivity were scored as 3 and additionally had to show strong IHC signal and diffuse distribution.
Flow Cytometry
EPN patient samples were mechanically dissociated into single cell suspensions and viably frozen as previously described9. Cells were gently thawed and suspended in PBS supplemented with 10% FBS. Myeloid cells were distinguished from tumor cells by co-expression of CD45 and CD11b as described previously9. PD-L1 (eBiosciences, catalog number: 25-5983, Clone: MIH1) staining was measured on both myeloid cells and tumor. Myeloid and T-cell characterization was performed as previously described9. Flow cytometry was performed using a BD Gallios equipped with 561 laser and flow data was analyzed using FloJo v10.7.
T-Cell Exhaustion Assay
Disaggregated tumor samples were stained with fluorophore conjugated antibodies CD45, CD3, and CD4 or CD8. T-cells were isolated using Beckman-Coulter Mo Flo Astrios EQ flow sorter and stimulated for 48 hours with PMA/ionomycin in RPMI media with 10% FBS and 1% penicillin streptomycin, after which supernatant was collected. A high sensitivity Milliplex Map kit (Millipore) was used to measure the concentration of 21 common cytokines (ITAC, GM-CSF, fractalkine, IFNγ, IL-10, MIP-3α, IL-12 (p70), IL-13, IL-17A, IL-1β, IL-2, IL-21, IL-4, IL-23, IL-5, IL-6, IL-7, IL-8, MIP-1α, MIP-1β, TNFα).
850K Methylation Array
DNA was isolated from snap frozen tumor specimen using All Prep DNA/RNA isolation kit (Qiagen). DNA methylation was assessed using the Infinium® MethylationEPIC BeadChip (Illumina). 750 nanograms of DNA per sample were submitted for bisulfite conversion using Zymo EZ DNA Methylation kits (Zymo Research Corp). Following the manufacturer’s protocol, bsDNA was amplified, fragmented and hybridized to BeadChips. The chips were stained and then read with an iScan (Illumina), generating IDAT files to be used in subsequent statistical analyses. IDAT files were batch normalized and background corrected using default settings of the R package ChAMP. The absolute value was calculated across probes located within and near the promoter and gene body of PD-L1.
Statistical Analysis
Statistical analyses were performed using R bioinformatics, Prism (GraphPad v6), and Excel (Microsoft) software. For all tests, statistical significance was defined as p < 0.05 using Student t-test.
Results
Characterization of Supratentorial EPN subtypes
In order to identify EPN subtype specific PD-L1 expression, EPN samples were divided into the three molecular subtypes using negative matrix factorization clustering of gene expression profiles: Supratentorial, Group A and Group B EPN, as previously described13. We further characterized the 12 supratentorial EPN patients in order to identify the common C11orf95-RELA translocation or YAP1 fusion.
We utilized a subtype associated signature geneset to distinguish RELA translocation samples from YAP fusion samples3. We analyzed the differential gene expression of ARL4D, CLDN1, RELA, and L1CAM and were able to identify the two unique subtypes within the ST location: 10 RELA and 2 YAP (Supplemental Figure S1A). We further validated these findings by analyzing the RELA gene expression across our EPN patient samples. We found the patients identified as supratentorial RELA subtype, had significantly higher levels of RELA gene expression compared to the YAP, Group A and Group B tumors (Supplemental Figure S1B). Finally, we measured RELA protein levels across the 12 supratentorial and posterior fossa tumors in order to confirm presence of the RELA fusion gene. In the patients with RELA subtype geneset expression, we were able to validate the fusion protein at 100kDa by Western blot (Supplemental Figure S1C). With the proper characterization of our EPN samples, we were then able to perform the subsequent PD-L1/PD-1 analyses.
PD-L1 transcript levels are highest in RELA Tumors
PD-L1 expression can be used to identify patients with lung cancer and melanoma that are more likely to benefit from checkpoint inhibitors such as pembroluzimab or nivolumab14. We therefore wanted to evaluate the gene expression of PD-L1 across four of the intracranial subtypes of EPN. We interrogated transcriptomic data from EPN subtypes to evaluate gene expression of PD-L1 in 12 RELA, 2 YAP, 29 Group A (20 primary Group A, 9 Group A recurrent), 29 Group B (21 primary Group B and 8 Group B recurrent) patients (Figure 1A). RELA patients have significantly higher levels of PD-L1 than Group A and Group B patients, and trended towards significance in comparison to our limited cohort of YAP patients. We validated our cohort findings with an independent PD-L1 transcription analysis in a larger EPN transcriptomic cohort (Figure 1B)3. In this cohort, RELA expression levels were significantly higher than in YAP and Group A patients. The discrepancy in PFB_1 mRNA expression between our cohort and the validation cohort may come down to a difference in the utilization of subtyping technologies between institutions (transcriptome vs. methylome) and in the difference of patient age between the cohorts. In our cohort, Group A patients had a median age of 3 years (range 0.5 to 17 years), Group B patients were a median age of 2 years (range 1 to 13 years), RELA patients were a median age of 5.5 years (range 1.9 to 20 years), and lastly, YAP had a mean age of 0.5 years, maximum of 0.8 and minimum of 0.2 years old. The validation cohort Group A patients had a median age of 3.5 years, (range 0.8 to 12 years), Group B patients were a median age of 12 (range 11 to 15 years), RELA patients were a median age of 7 years (range 0.75 to 17 years), and lastly, YAP had a median age of 1 year (range of 0.8 to 9 years). Also, in our cohort, at recurrence, Group B tumors significantly upregulated PD-L1 expression compared to primary tumors. We did not see a change in PD-L1 expression at recurrence in Group A patients.
Fig. 1.
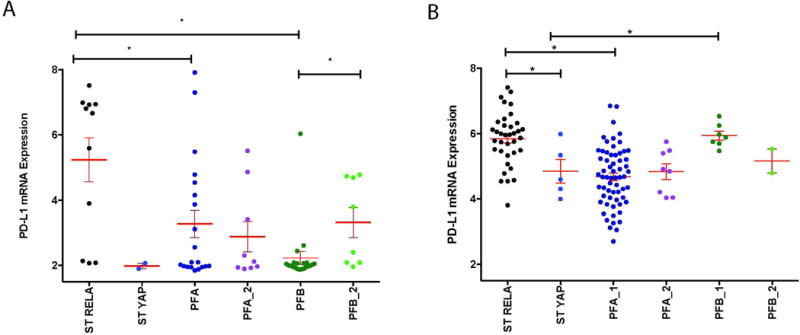
PD-L1 gene expression in two independent EPN patient cohorts. (A) mRNA expression of PD-L1 in our primary cohort of supratentorial RELA fusion (ST RELA), supratentorial YAP fusion (ST YAP), posterior fossa group A (PFA_1) (primary tumor), posterior fossa group A (PFA_2) (recurrent tumor), posterior fossa group B (PFB_1) (primary tumor), and posterior fossa group B (PFB_2) (recurrent tumor) samples. *p<0.05 (B) mRNA expression of PD-L1 in validation cohort of ST RELA, ST YAP, PFA_1, PFA_2, PFB_1, and PFB_2 samples. *p<0.05
It has been shown that differential DNA methylation across the EPN molecular subtypes’ results in unique gene expression profiles. We evaluated whether DNA methylation affects the PD-L1 transcription in RELA using Illumina 850K methylation array. We found there was no differential methylation in the 12 probes that span the promoter region of PD-L1 across all of our EPN patient samples (Supplemental Figure S2). This suggests that PD-L1 expression in EPN is regulated by a mechanism other than methylation of the specific promoter region of the gene.
PD-L1 Protein Expression is highest in RELA
In previous studies, we have shown that microarray expression can be used to predict protein expression15,16. To ensure our PD-L1 gene expression correlated with protein levels, we used lysates from snap frozen patient samples from available RELA, YAP, Group A, Group B, and normal brain. We found that PD-L1 protein levels were higher in RELA tumors compared to patients from other EPN subtypes (Figure 2A and B). Protein levels, as measured by densitometry, correlated very strongly with gene expression levels across EPN subtypes.
Fig. 2.
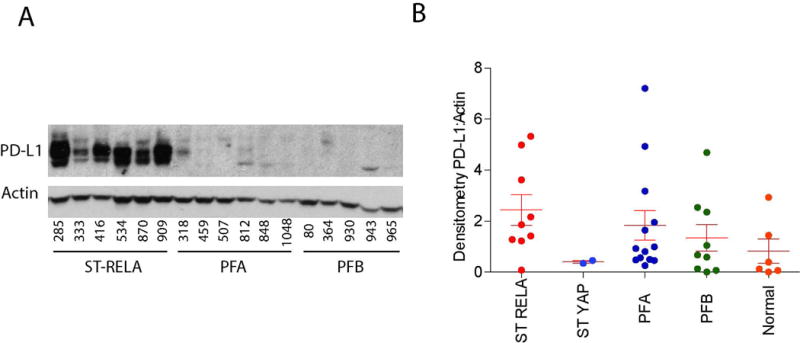
PD-L1 protein expression in our EPN patient cohort. PD-L1 protein expression in supratentorial YAP fusion (ST YAP) (2), supratentorial RELA fusion (ST RELA) (9), posterior fossa Group A (PFA) (13), posterior fossa Group B (PFB) (9) EPN, and Normal brain samples (6). Densitometry ratio of PD-L1 to Actin.
Involvement in clinical trials for PD-1/PD-L1 blockade requires immunohistochemistry-positive staining for PD-L1, thus, we tested and scored 8 pediatric EPN paraffin fixed tissues (4 RELA, 2 Group A, and 2 Group B). All RELA tumors tested positive for PD-L1 (Figure 3). Two RELA tumors tested had diffuse strong staining (score 3) (Figure 3A), or high positivity, 1 had medium positivity (score 2) (Figure 3B) and one had low positivity (score 1) (Figure 3C), with patchy staining. All four posterior fossa EPN scored 0, with no staining present (Figure 3D). No apparent restriction to discrete cells that would be indicative of immune cell staining was found, but rather extensive staining of tumor cells.
Fig. 3.
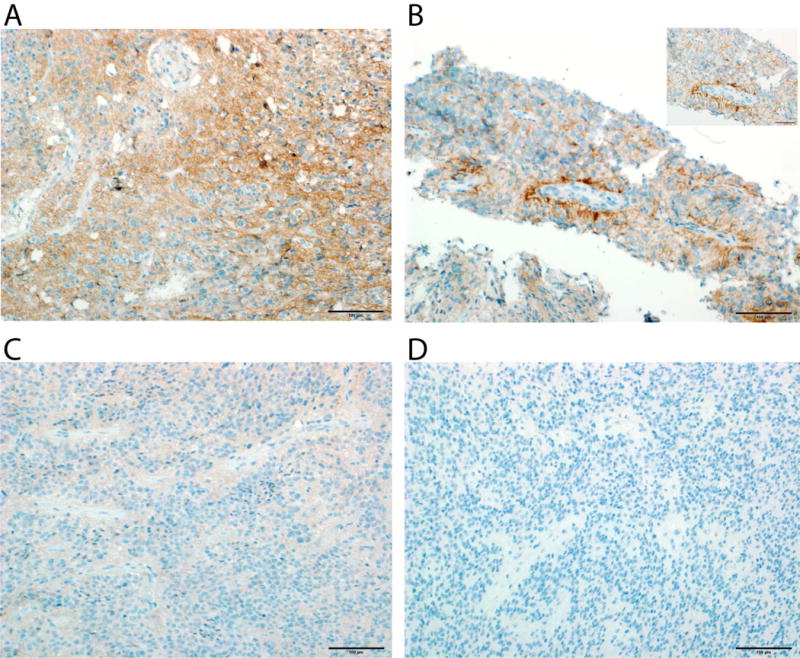
Representative examples of PD-L1 staining patterns in pediatric EPN. (A) Strong IHC signal and diffuse distribution seen (score 3) (RELA tumor, UPN 909) (20× magnification). (B) Medium staining intensity (score 2) (RELA tumor, UPN 1158) (20× and 40× magnification). (C) Low staining intensity (score 1) (RELA tumor, UPN 870) (20× magnification). (D) Posterior Fossa EPN with no PD-L1 staining present (score 0) (Group B tumor, UPN 930).
Based on our observation that PD-L1 gene expression correlated strongly with protein expression (Supplemental Table S1), PD-L1 transcript may therefore provide a valuable surrogate for determination of PD-L1 protein levels for clinical trial selection. We therefore examined PD-L1 gene expression in our transcriptomic dataset containing the majority of pediatric and some adult brain tumor types. We established a minimum expression level of 3 as our cutoff, as this represents a value double the background level in our microarray data (Supplemental Figure S3). We were able to see bands on our western blots at expression levels as low as 2.49, but chose 3 as our cut off in order to be more stringent. From this cutoff we determined the percent of PD-L1 positive patient tumor samples for each tumor type that was further subdivided by either molecular subtype or anatomic location within the CNS (Figure 4). This analysis showed that Adamantinomatous Craniopharyngioma, low grade Astrocytomas and some high grade Astrocytomas expressed PD-L1 at levels equal to or higher than RELA, whereas some other common tumor types, in particular Medulloblastomas and Diffuse Intrinsic Pontine Gliomas, showed no PD-L1 expression. These data suggests that PD-L1 transcript can be helpful in determining which patients would be candidates for future clinical trials, although this would require some protein expression validation.
Fig. 4.
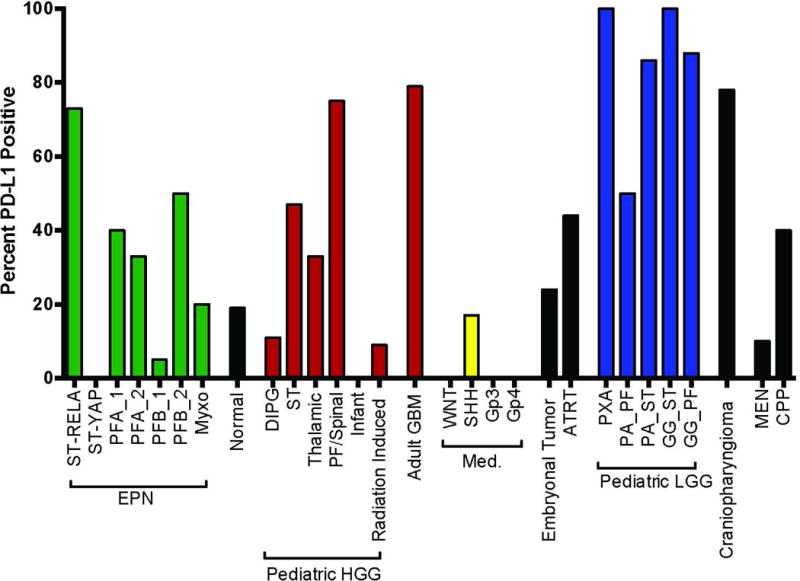
Percent PD-L1 positive patients per diagnosis across all pediatric brain tumors in our cohort, determined by gene expression.
PD-L1 found on both tumor and myeloid cells in RELA
It is known that PD-L1 can be upregulated by either tumor cells or myeloid cells. Given that EPN have significant infiltration of immune cells, particularly myeloid cells, we investigated which cellular population was expressing PD-L19,16. Using flow cytometry on viable frozen disaggregated EPN from different subtypes, we identified PD-L1 to be expressed on both tumor and myeloid cell populations for the RELA samples with high PD-L1 transcriptomic expression (Supplemental Figure S4). The patient with low PD-L1 gene expression had little expression on either tumor or myeloid cells (RELA_790) (Figure 5A and 5B). As was seen by both gene expression and Western blot protein analysis, YAP, Group A and Group B tumors had very little PD-L1 on either tumor or myeloid cell compartments. These data shows that both tumor and myeloid cells upregulate PD-L1 in RELA patients.
Fig. 5.
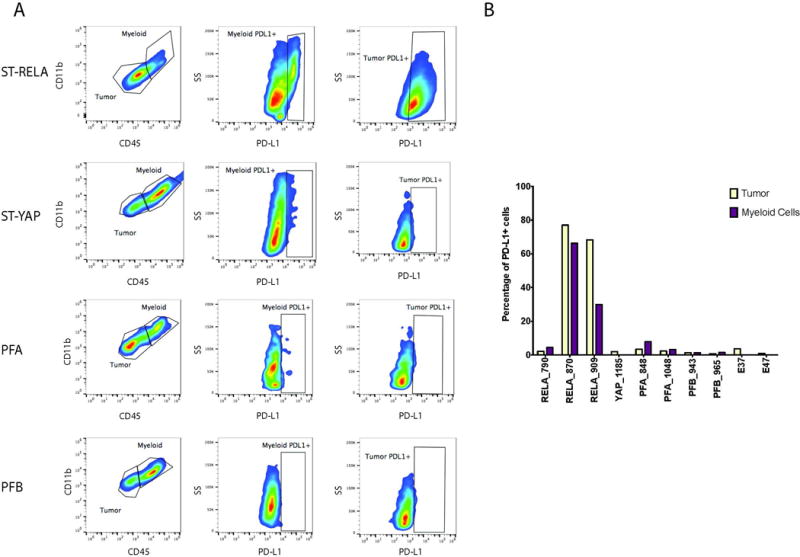
Supratentorial RELA fusion (ST RELA) EPN express PD-L1 on both tumor and myeloid cells. (A) Flow Cytometry reveals only ST RELA tumor samples expressed PD-L1 on both tumor and myeloid cells. (B) Percentage of myeloid and tumor cells that were positive for PD-L1 in ST RELA, supratentorial YAP fusion (ST YAP), posterior fossa Group A (PFA), posterior fossa Group B (PFB) and normal patient samples.
T-cells in RELA patients express high levels of PD-1 and are exhausted
We have previously shown that T-cell infiltration, specifically CD4 infiltration, correlated with outcome in EPN patients but its association with EPN molecular subtypes was not evaluated16. We therefore measured T-cell infiltration in RELA, Group A and Group B EPN patients by immunohistochemistry. We found that RELA patients had significantly more CD4 infiltration than either posterior fossa subtype (Figure 6A). CD8 infiltration was also significantly higher in RELA patients compared to Group B, but not when compared to Group A (Figure 6A).
Fig. 6.
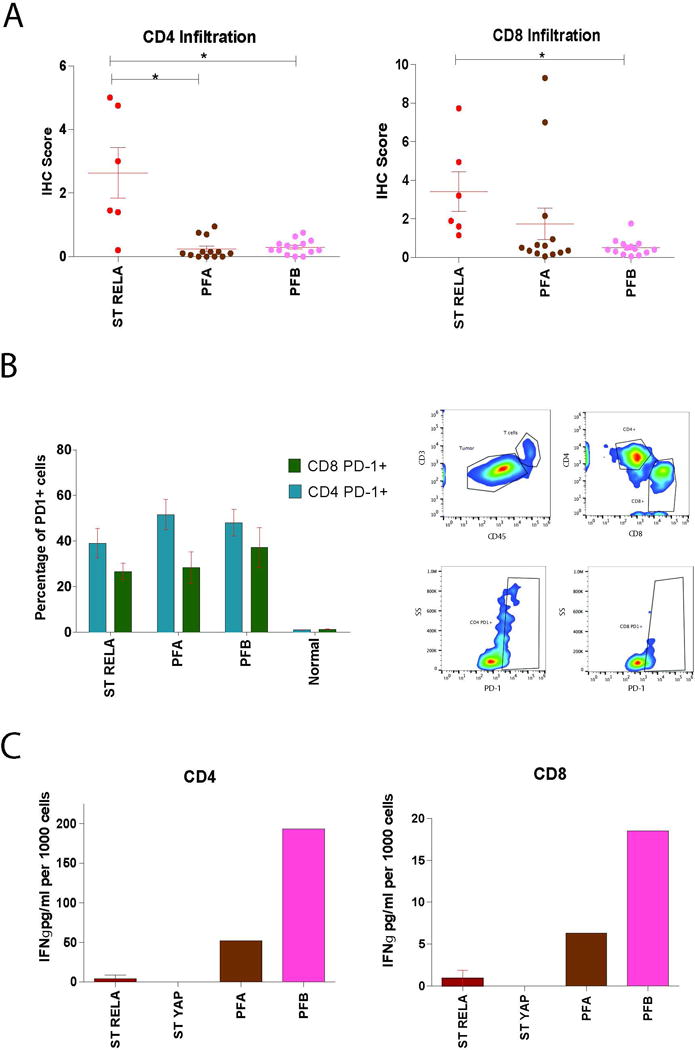
Infiltrating T-cells in supratentorial RELA fusion (ST RELA) tumors express high levels of PD-1 and are functionally exhausted. (A) IHC scoring performed identifying infiltrating CD4 and CD8 T-cells in ST RELA, posterior fossa Group A (PFA) and posterior fossa Group B (PFB) patient samples. *p<0.05 (B) Flow cytometry characterization of PD-1 expression on ST RELA, PFA, PFB, and normal brain samples in CD4 and CD8 T-cells. (C) Secretion of IFNγ in CD4 and CD8 T-cells from ST RELA, supratentorial YAP fusion (ST YAP), PFA, and PFB patient samples. Results normalized per 1000 cells.
T-cell PD-1 interaction with tumor or myeloid PD-L1 results in inhibition of T-cell proliferation and subsequent T-cell exhaustion. T-cell exhaustion is one of the mechanisms by which tumors evade immune mediated clearance4. In order to identify if this immune suppressive mechanism was present in pediatric EPN subtypes, we measured PD-1 levels on both CD4 and CD8 EPN infiltrating T-cells by flow cytometry (Supplemental Figure S5). We found that RELA do in fact express PD-1 on both of their infiltrating T-cell populations (Figure 6B). We also found the same to be true for Group A and Group B patient samples.
Using a functional T-cell exhaustion assay, earlier studies by our group had showed that Group A infiltrating T-cells were unable to induce cytokine secretion in response to a non-specific stimulus in comparison to Group B10. In order to evaluate whether RELA infiltrating T-cells were equally exhausted, we repeated this assay using RELA tumors. Following PMA/ionomycin stimulation, T-cells from RELA were unable to secrete IFN-γ (Figure 6C). These findings in RELA suggest that tumor evasion and immunosuppression is due to PD-L1/PD-1 mediated T-cell exhaustion. In Group A patients, we found high levels of PD-1 on both subsets of T-cells (Figure 6B). Similar to the RELA patients, the T-cells in Group A patients were unable to produce a significant level of IFN-γ in response to PMA/ionomycin suggesting the T-cells are also exhausted (Figure 6C). However, given we found very little PD-L1 in Group A patients, it is likely the mechanism of T-cell exhaustion is due to the previously described Group A inflammatory microenvironment driven by tumor secreted IL-612. Upon investigation of IL-6 secretion across EPN subtypes, we found that Group A secrete significantly higher amounts of IL-6 than any other subtype and RELA patients do not secrete IL-6 at all (Supplemental Figure S6). Group B patients also expressed high levels of PD-1, however both CD4 and CD8 T-cells were able to secrete IFN-γ after PMA/Ionomycin stimulation which indicates that PD-1 levels are due to normal T-cell antigen-activation, as has been a documented function of PD-16.
Discussion
EPN is an aggressive childhood brain tumor with poor survival and significant long-term morbidity. Standard therapy has not changed in two decades and consists of surgery and radiation. Chemotherapy and small molecule inhibitors have failed and up to half the children with EPN will relapse within a decade and almost all of these relapsed patients will die17. There is a vital need for novel therapeutic approaches for these very high risk patients. Given the recent successes of immunotherapy, such as the PD-1 checkpoint inhibitor studies in adult cancers, this approach should be explored in resistant brain tumors18. Careful selection of pediatric populations to test these agents is paramount if the agents are to be successfully introduced in the resistant tumors of childhood. Pediatric tumors are rarer and generally have less mutational load than those of adults19. It is also thought, that due to this generally decreased mutational load, immune checkpoint inhibitors would be less effective20. It is apparent from our data there may be significant differences in PD-L1 expression status even between subtypes of a tumor. Chromothrypsis, and thus mutational load, identified in RELA tumors may result in increased neoantigen expression21. The relatively high level of neoantigens in RELA may underlie the exhausted T-cell phenotype inferred by PD-L1 expression in these tumors. Lastly, NF-kB activity has been implicated as a driver of PD-L1 expression in melanoma22. Collectively, these data provide optimism that RELA might be responsive to immune checkpoint inhibitors23.
In our study, we showed that expression of PD-1 on the T-cells, and PD-L1 on the myeloid and tumor cells was common amongst the RELA fusion subtype but uncommon in the other 3 types of EPN. We have also shown that T-cells isolated from RELA tumors are nonresponsive to stimulus ex vivo and do not produce inflammatory cytokines. It is reasonable to assume that this T-cell phenotype in RELA tumors is secondary to the PD-1/PD-L1 interaction. This would support selectively recruiting RELA fusion positive EPN to a PD-1 inhibitor trial given the data about the predictive value of PD-L18. Questions remain how reliable PD-L1 expression is in predicting response to a PD-1 inhibitor and whether the level of PD-L1 expression or protein is important, although currently PD-L1 expression remains the best predictor of response to PD-1 inhibitor therapy14,24.
Our data also shows that T-cells isolated from YAP fusion tumors and Group A tumors are also non-responsive ex vivo and do not produce inflammatory cytokines. Yet these tumors lack PD-L1 and a PD-1 interaction with PD-L1 does not explain why the T-cells are functionally exhausted in these tumors. This is in comparison to the Group B tumors with functional T-cells and excellent clinical outcomes10. This would suggest that while PD-1 inhibitors would be reasonable to try in RELA, an alternative immunotherapy approach may be necessary in YAP and Group A tumors. Indeed, our previous work would suggest that an immunotherapy approach to Group A may involve inhibiting an IL-6/myeloid interaction12. We know from previous work that the variation in immunobiology amongst different childhood brain tumors is profound and this paper and others from our group documents that this extends into tumor subtypes. Extending our understanding of differing immunobiology among tumors and their subtypes is necessary in order to provide better clinical care, maximizing personalized medicine and rational treatment for these patients.
A technical point from our observations in this study may help enrich patients likely to respond to a particular immunotherapy. We observed that transciptome data corresponded well to protein by both Western blot and IHC staining for PD-L1. With the expansion of genetic and transcriptome evaluation of tumors at diagnosis, this observation should be extended to other tumors and the relationship of expression to protein for other immunomodulating factors should be explored. Given the existence of large expression data banks this may improve our ability to choose appropriate immunotherapy agents to explore for different tumors and their subtypes.
This study investigated the presence of PD-L1 in EPN by immunohistochemistry. There is presently some difficulty surrounding the use of this technique to interpret PD-L1 in EPN, as identified by a recent study25. Despite these problems, their study concluded that PD-L1 was absent in all pediatric EPN. In contrast, our study clearly identified the presence of PD-L1 in supratentorial RELA EPN. Importantly, the antibody used was recently described as one of high reliability26. These results enhance the rigor and reliability of this study. In conclusion, any PD-1 inhibitor therapy trial, if conducted in EPN should be enriched for relapsed RELA patients. Alternative immunotherapies should be developed for the other subtypes of EPN with functionally exhausted T-cells but without evidence of PD-L1 expression on myeloid or tumor cells.
Supplementary Material
Supplementary Figure S1 Characterization of Supratentorial Ependymoma. (A) Z score of the primary ST cohort for expression levels of ARL4D, CLDN1, RELA, and L1CAM. (B) RELA gene transcript comparing supratentorial RELA fusion (ST RELA), supratentorial YAP fusion (ST YAP), posterior fossa Group A (PFA) and, posterior fossa Group B (PFB) samples. *p<0.05 (C) P65 RELA and C11orf95 RELA fusion protein expression in ST YAP (2), ST RELA (8), PFA (6), and PFB (2) EPN.
Supplementary Figure S2 Methylation status of PD-L1 promoter region across EPN subtypes. (A) Posterior fossa Group A (PFA) (n=14), posterior fossa Group B (PFB) (n=11), and supratentorial (ST) (n=10) comparing methylation status of PD-L1 promoter region.
Supplementary Figure S3 PD-L1 gene expression in all pediatric and adult brain tumor types in our cohort.
Supplementary Figure. S4 Representative flow cytometry control gating for the presence of PD-L1 in EPN.
Supplementary Figure S5 Representative flow Cytometry control gating for the presence of PD-1 in EPN.
Supplementary Figure S6 IL-6 secretion in supratentorial RELA fusion (ST RELA), supratentorial YAP fusion (ST YAP), posterior fossa Group A (PFA) and posterior fossa Group B (PFB) EPN subtypes. *p<0.05.
Acknowledgments
We would like to thank the University of Colorado Denver Genomics and Microarray Core and the University of Colorado Anschutz Histology Core.
Funding: This work was funded by Hyundai Hope on Wheels, the Tanner Seebaum Foundation and the Morgan Adams Foundation. JML is supported by an elope, Inc. St. Baldrick’s Foundation Scholar Award and NIH/NCI (K08CA193982). The Genomics and Microarray Core and the Flow Cytometry Shared Resources receive direct funding support from the National Cancer Institute (P30CA046934).
Abbreviations Key
- EPN
Ependymoma
- Group A
Posterior Fossa Ependymoma Group A
- Group B
Posterior Fossa Ependymoma Group B
- RELA
Supratentorial C11orf95-RELA Fusion
- YAP
Supratentorial YAP1 fusion
- PD-L1
Programmed Death Ligand 1
- PD-1
Programmed Death 1
- Myxo
Myxopapillary Ependymoma
- ITAC
Interferon-inducible T-cell alpha chemoattractant
- MIP-1α
Macrophage Inflammatory Protein-1 alpha
- MIP-1β
Macrophage Inflammatory Protein-1 beta
- bsDNA
bisulfide Deoxyribonucleic acid
- ARL4D
ADP Ribosylation Factor Like GTPase 4D
- CLDN1
Claudin 1
- RELA
RELA Proto-Oncogene, NF-κB Subunit
- L1CAM
L1 Cell Adhesion Molecule
- PMA
Phorbol 12-myristate 13-acetate
Footnotes
Conflict of Interest:
There are no conflicts of interest for this study.
References
- 1.Yao Y, Mack SC, Taylor MD. Molecular genetics of ependymoma. Chin J Cancer. 2011;30(10):669–681. doi: 10.5732/cjc.011.10129. [DOI] [PMC free article] [PubMed] [Google Scholar]
- 2.Parker M, Mohankumar KM, Punchihewa C, et al. C11orf95-RELA fusions drive oncogenic NF-kappaB signalling in ependymoma. Nature. 2014;506(7489):451–455. doi: 10.1038/nature13109. [DOI] [PMC free article] [PubMed] [Google Scholar]
- 3.Pajtler KW, Witt H, Sill M, et al. Molecular Classification of Ependymal Tumors across All CNS Compartments, Histopathological Grades, and Age Groups. Cancer cell. 2015;27(5):728–743. doi: 10.1016/j.ccell.2015.04.002. [DOI] [PMC free article] [PubMed] [Google Scholar]
- 4.Chen L, Han X. Anti-PD-1/PD-L1 therapy of human cancer: past, present, and future. The Journal of clinical investigation. 2015;125(9):3384–3391. doi: 10.1172/JCI80011. [DOI] [PMC free article] [PubMed] [Google Scholar]
- 5.Lakin N, Rulach R, Nowicki S, Kurian KM. Current Advances in Checkpoint Inhibitors: Lessons from Non-Central Nervous System Cancers and Potential for Glioblastoma. Front Oncol. 2017;7:141. doi: 10.3389/fonc.2017.00141. [DOI] [PMC free article] [PubMed] [Google Scholar]
- 6.Afreen S, Dermime S. The immunoinhibitory B7-H1 molecule as a potential target in cancer: killing many birds with one stone. Hematol Oncol Stem Cell Ther. 2014;7(1):1–17. doi: 10.1016/j.hemonc.2013.09.005. [DOI] [PubMed] [Google Scholar]
- 7.Taube JM, Klein A, Brahmer JR, et al. Association of PD-1, PD-1 ligands, and other features of the tumor immune microenvironment with response to anti-PD-1 therapy. Clin Cancer Res. 2014;20(19):5064–5074. doi: 10.1158/1078-0432.CCR-13-3271. [DOI] [PMC free article] [PubMed] [Google Scholar]
- 8.Vilain RE, Menzies AM, Wilmott JS, et al. Dynamic Changes in PD-L1 Expression and Immune Infiltrates Early During Treatment Predict Response to PD-1 Blockade in Melanoma. Clin Cancer Res. 2017 doi: 10.1158/1078-0432.CCR-16-0698. [DOI] [PubMed] [Google Scholar]
- 9.Griesinger AM, Birks DK, Donson AM, et al. Characterization of distinct immunophenotypes across pediatric brain tumor types. Journal of immunology. 2013;191(9):4880–4888. doi: 10.4049/jimmunol.1301966. [DOI] [PMC free article] [PubMed] [Google Scholar]
- 10.Hoffman LM, Donson AM, Nakachi I, et al. Molecular sub-group-specific immunophenotypic changes are associated with outcome in recurrent posterior fossa ependymoma. Acta neuropathologica. 2014;127(5):731–745. doi: 10.1007/s00401-013-1212-8. [DOI] [PMC free article] [PubMed] [Google Scholar]
- 11.Tumeh PC, Harview CL, Yearley JH, et al. PD-1 blockade induces responses by inhibiting adaptive immune resistance. Nature. 2014;515(7528):568–571. doi: 10.1038/nature13954. [DOI] [PMC free article] [PubMed] [Google Scholar]
- 12.Griesinger AM, Josephson RJ, Donson AM, et al. Interleukin-6/STAT3 Pathway Signaling Drives an Inflammatory Phenotype in Group A Ependymoma. Cancer immunology research. 2015;3(10):1165–1174. doi: 10.1158/2326-6066.CIR-15-0061. [DOI] [PMC free article] [PubMed] [Google Scholar]
- 13.Griesinger AM, Witt DA, Grob ST, et al. NF-kappaB upregulation through epigenetic silencing of LDOC1 drives tumor biology and specific immunophenotype in Group A ependymoma. Neuro-oncology. 2017 doi: 10.1093/neuonc/nox061. [DOI] [PMC free article] [PubMed] [Google Scholar]
- 14.Mahoney KM, Freeman GJ, McDermott DF. The Next Immune-Checkpoint Inhibitors: PD-1/PD-L1 Blockade in Melanoma. Clin Ther. 2015;37(4):764–782. doi: 10.1016/j.clinthera.2015.02.018. [DOI] [PMC free article] [PubMed] [Google Scholar]
- 15.Barton VN, Donson AM, Kleinschmidt-DeMasters BK, Birks DK, Handler MH, Foreman NK. Unique molecular characteristics of pediatric myxopapillary ependymoma. Brain Pathol. 2010;20(3):560–570. doi: 10.1111/j.1750-3639.2009.00333.x. [DOI] [PMC free article] [PubMed] [Google Scholar]
- 16.Donson AM, Birks DK, Barton VN, et al. Immune gene and cell enrichment is associated with a good prognosis in ependymoma. Journal of immunology. 2009;183(11):7428–7440. doi: 10.4049/jimmunol.0902811. [DOI] [PubMed] [Google Scholar]
- 17.Ramaswamy V, Hielscher T, Mack SC, et al. Therapeutic Impact of Cytoreductive Surgery and Irradiation of Posterior Fossa Ependymoma in the Molecular Era: A Retrospective Multicohort Analysis. Journal of clinical oncology : official journal of the American Society of Clinical Oncology. 2016;34(21):2468–2477. doi: 10.1200/JCO.2015.65.7825. [DOI] [PMC free article] [PubMed] [Google Scholar]
- 18.Iwai Y, Hamanishi J, Chamoto K, Honjo T. Cancer immunotherapies targeting the PD-1 signaling pathway. J Biomed Sci. 2017;24 doi: 10.1186/s12929-017-0329-9. [DOI] [PMC free article] [PubMed] [Google Scholar]
- 19.Alexandrov LB, Nik-Zainal S, Wedge DC, et al. Signatures of mutational processes in human cancer. Nature. 2013;500(7463):415–421. doi: 10.1038/nature12477. [DOI] [PMC free article] [PubMed] [Google Scholar]
- 20.Chabanon RM, Pedrero M, Lefebvre C, Marabelle A, Soria JC, Postel-Vinay S. Mutational Landscape and Sensitivity to Immune Checkpoint Blockers. Clin Cancer Res. 2016;22(17):4309–4321. doi: 10.1158/1078-0432.CCR-16-0903. [DOI] [PubMed] [Google Scholar]
- 21.Kass EM, Moynahan ME, Jasin M. When Genome Maintenance Goes Badly Awry. Molecular cell. 2016;62(5):777–787. doi: 10.1016/j.molcel.2016.05.021. [DOI] [PMC free article] [PubMed] [Google Scholar]
- 22.Gowrishankar K, Gunatilake D, Gallagher SJ, Tiffen J, Rizos H, Hersey P. Inducible but not constitutive expression of PD-L1 in human melanoma cells is dependent on activation of NF-kappaB. PloS one. 2015;10(4):e0123410. doi: 10.1371/journal.pone.0123410. [DOI] [PMC free article] [PubMed] [Google Scholar]
- 23.Parker M, Mohankumar KM, Punchihewa C, et al. C11orf95-RELA fusions drive oncogenic NF-kappaB signalling in ependymoma. Nature. 2014;506(7489):451–455. doi: 10.1038/nature13109. [DOI] [PMC free article] [PubMed] [Google Scholar]
- 24.Wang X, Teng F, Kong L, Yu J. PD-L1 expression in human cancers and its association with clinical outcomes. Onco Targets Ther. 2016;9:5023–5039. doi: 10.2147/OTT.S105862. [DOI] [PMC free article] [PubMed] [Google Scholar]
- 25.Dumont B, Forest F, Dal Col P, et al. PD1 and PD-L1 in ependymoma might not be therapeutic targets. Clin Neuropathol. 2017;36(2):90–92. doi: 10.5414/NP300988. 2017. [DOI] [PubMed] [Google Scholar]
- 26.Buttner R, Gosney JR, Skov BG, et al. Programmed Death-Ligand 1 Immunohistochemistry Testing: A Review of Analytical Assays and Clinical Implementation in Non-Small-Cell Lung Cancer. Journal of clinical oncology : official journal of the American Society of Clinical Oncology. 2017:JCO2017747642. doi: 10.1200/JCO.2017.74.7642. [DOI] [PubMed] [Google Scholar]
Associated Data
This section collects any data citations, data availability statements, or supplementary materials included in this article.
Supplementary Materials
Supplementary Figure S1 Characterization of Supratentorial Ependymoma. (A) Z score of the primary ST cohort for expression levels of ARL4D, CLDN1, RELA, and L1CAM. (B) RELA gene transcript comparing supratentorial RELA fusion (ST RELA), supratentorial YAP fusion (ST YAP), posterior fossa Group A (PFA) and, posterior fossa Group B (PFB) samples. *p<0.05 (C) P65 RELA and C11orf95 RELA fusion protein expression in ST YAP (2), ST RELA (8), PFA (6), and PFB (2) EPN.
Supplementary Figure S2 Methylation status of PD-L1 promoter region across EPN subtypes. (A) Posterior fossa Group A (PFA) (n=14), posterior fossa Group B (PFB) (n=11), and supratentorial (ST) (n=10) comparing methylation status of PD-L1 promoter region.
Supplementary Figure S3 PD-L1 gene expression in all pediatric and adult brain tumor types in our cohort.
Supplementary Figure. S4 Representative flow cytometry control gating for the presence of PD-L1 in EPN.
Supplementary Figure S5 Representative flow Cytometry control gating for the presence of PD-1 in EPN.
Supplementary Figure S6 IL-6 secretion in supratentorial RELA fusion (ST RELA), supratentorial YAP fusion (ST YAP), posterior fossa Group A (PFA) and posterior fossa Group B (PFB) EPN subtypes. *p<0.05.