

Abstract
Objective
Astrocytes fulfill neuronal trophic roles normally, but are transformed in Alzheimer's disease (AD) into A1-type reactive astrocytes that may destroy neurons through unknown mechanisms.
Methods
To investigate astrocyte inflammatory mechanisms, astrocyte-derived exosomes (ADEs) were isolated immunochemically from plasmas of AD patients and matched controls for ELISA quantification of complement proteins.
Results
ADE levels of C1q, C4b, C3d, factor B, factor D, Bb, C3b and C5b-C9 terminal complement complex (TCC), but not mannose-binding lectin (MBL), normalized by the CD81 exosome marker were significantly higher for AD patients (n=28) than age- and gender-matched controls (all p<0.0001). ADE normalized levels of IL-6, TNF-α and IL-1β were significantly higher for AD patients than controls, but there was greater overlap between the two groups than for complement proteins. Mean ADE levels of complement proteins for AD patients in a longitudinal study were significantly higher (n=16, p<0.0001) at the AD2 stage of moderate dementia than at the AD1 preclinical stage five to 12 years earlier, which were the same as for controls. ADE levels of complement regulatory proteins CD59, CD46, decay-accelerating factor (DAF) and complement receptor type 1 (CR1), but not factor I, were significantly lower for AD patients than controls (p<0.0001 for CD59 and DAF), were diminished by the AD1 stage and were further decreased at the AD2 stage.
Interpretation
ADE complement effector proteins in AD are produced by dysregulated systems, attain higher levels than in controls, and may potentially damage neurons in the late inflammatory phase of AD.
Keywords: Dementia, neurodegeneration, cytokines, neurotoxicity, inflammation
Astrocytes are abundant glial cells in the human central nervous system (CNS), that normally have a major neuronal trophic role through diverse homeostatic maintenance activities. Neuronal supportive functions of astrocytes include promotion of development, nutrition, survival, dendrite outgrowth and synapse formation 1-3. Most inflammatory, neurodegenerative and ischemic diseases of the CNS elicit a highly coordinated multicellular response that encompasses an increase in the total number of astrocytes and their differentiation into reactive astrocytes of inflammatory type A1 and/or ischemia-related type A2 4-6. Activated microglia are critical inducers of A1 inflammatory-neurotoxic astrocytes through NFκB-dependent pathways and a range of cytokines, but a greater understanding of mechanisms and specific mediators is still emerging7-9. A2-type reactive astrocytes upregulate expression of neuronal protective functions and factors. In contrast, A1-type reactive astrocytes lose neuronal trophic potential and instead increase expression of pro-inflammatory pathways as well as toxic activities that damage synapses and destroy neurons 2, 4, 10, 11. It is currently unclear which of the neuronal toxic mediators generated and secreted by A1-type astrocytes are pathogenically critical in human neurodegenerative diseases.
Findings in postmortem brain tissues of patients with neurodegenerative and neuroinflammatory diseases have begun to delineate specific components of type A1 astrocyte-mediated neuronal toxicity. Approximately 60% of type A1 (glial fibrillary acidic protein [GFAP]-positive) astrocytes in the prefrontal cortex of patients with Alzheimer's disease (AD) express an abnormally high level of complement component 3 (C3), that is characteristically upregulated in induced A1-type astrocytes and has potential neuronal cytotoxic activity 4. The absence of C3 from type A2 (S100A10-positive) astrocytes in the same regions of brain tissues of patients with AD confirms the likely absence of complement-mediated neuronal cytotoxic activity of A2 astrocytes. Evidence of the possible pathogenic involvement of complement systems in AD has been presented, but it was not clear that astrocytes are the principal source of the complement mediators 5, 12-14. Further, in some animal models of AD reactive astrocytes and complement have been found to protect neurons from the proteinopathic factors in AD 15, 16.
Enriched populations of astrocyte-derived exosomes (ADEs) obtained from human plasma by sequential precipitation and immunochemical absorption contain much higher levels of the astrocyte biomarkers glutamine synthetase and GFAP than plasma neuron-derived exosomes (NDEs) 17. In contrast, NDEs have much higher levels than ADEs of the neuronal markers neurofilament light chain and neuron-specific enolase 17. One pathogenic role for astrocytes in AD was suggested initially by our finding of higher levels of β-site amyloid precursor protein-cleaving enzyme 1 (BACE-1) and soluble amyloid precursor protein β (sAPPβ) of the Aβ42 peptide-generating system in ADEs than NDEs and in ADEs of patients with AD than in those of matched controls 17.
Our current findings support possible pathogenic roles of type A1 astrocytes in AD through inflammatory complement proteins of both the classical and alternative systems in ADEs, that are elevated in patients with AD compared to those of matched controls. Diminished ADE levels of several complement regulatory proteins early in preclinical AD suggest that loss of normal inhibition of the classical and alternative complement pathways may be one primary cause of complement-mediated neuroinflammation in AD. These results also indicate that existing complement-directed therapies may benefit some patients with AD who have high levels of complement-mediated neuroinflammation.
Methods
Experimental design and patient evaluation
For cross-sectional studies, we retrospectively identified 28 patients with early AD (mild cognitive impairment [MCI] or mild dementia) who had been evaluated extensively in the Clinical Research Unit of the U.S. National Institute on Aging (NIA; Baltimore, MD, USA) and 28 age- and gender-matched cognitively normal controls who had donated blood at the Jewish Home of San Francisco (JHSF) in the same time period as the patients (Table 1a). For longitudinal studies, we selected 16 patients at the University of Kentucky, Lexington (UKY) AD Center with moderate AD who had provided blood at two times: first when cognitively intact (AD1, Table 1b) and again five to 12 yr later after diagnosis of dementia (AD2, Table 1b). Sixteen cognitively normal controls, who were age- and gender-matched with the AD1 group, were found at JHSF based on their plasmas having been obtained in the same time period. One investigator (E.J.G.) supervised identification and storage of all plasmas by the same methods and processed all plasmas together by the same procedures. Plasmas from patients in the longitudinal studies were analyzed without knowledge of the clinical data.
Table 1. Characteristics of AD Patients and Control Subjects.
| Total | ||||||
|---|---|---|---|---|---|---|
| Diagnosis | Number | Male/Female | Ages | MMSE | ADAS-cog | |
| Mean±S.E.M. | Mean±S.E.M. | Mean±S.E.M. | ||||
| a. Cross-Sectional Sets | ||||||
| C | 28 | 12/16 | 73.2±1.47 | 29.7±0.13 | 3.32±0.31 | |
| AD | 28 | 12/16 | 73.1±1.44 | 25.6±0.83* | 13.7±1.31* | |
| b. Longitudinal Sets | ||||||
| C | 16 | 9/7 | 69.7±2.04 | 29.1±0.87 | 3.42±0.58 | |
| AD1 | 16 | 9/7 | 70.3±1.75 | 28.5±0.62 | 3.94±0.60 | |
| AD2 | 16 | 9/7 | 79.1±1.83 | 21.6±1.46* | 19.8±1.89* | |
AD and C are the patients and controls in the cross-sectional study of Alzheimer's disease (AD). AD1 and AD2 are the groups of AD patients evaluated at two times in the longitudinal study, at a preclinical phase and after conversion to moderate dementia, respectively, and C here are the controls matched to the AD1 patients. MMSE = Mini-Mental State Examination. ADAS-cog = AD assessment scale-cognitive subscale. The significance of differences between cognitive state (MMSE, ADAS-cog) values of the groups were calculated by an unpaired t test for C vs. AD (a) and for C vs. AD1, and by a paired t test for AD1 vs. AD2 (b);
= p<0.001.
Patients with AD and controls had mental status testing at the time of each blood sampling. Mini-Mental State Examination (MMSE) and the AD Assessment Scale-cognitive subscale (ADAS-cog) were conducted as described 18. Cross-sectional study patients from the NIA had amnestic MCI or mild dementia with high probability of AD and a Clinical Dementia Rating global score of 0.5 or 1.0 according to the NIA-AA and IWG-2 criteria 19, 20. All cross-sectional patients with AD had abnormal CSF levels of amyloid β-peptide (Aβ) 1–42 and P-T181-tau that supported their diagnosis 21. AD1/AD2 patients from UKY had probable AD and mild-to-moderate dementia at the AD2 stage by NINCDS-ADRDA criteria and had a Clinical Dementia Rating global score of 1.0 at the time of the second blood collection 22.
The protocol and procedures of this study received prior approval by the Institutional Review Boards of the UC San Francisco, the University of Kentucky and the NIA Intramural Program. Informed Consent was obtained from each subject.
Blood and CSF sampling of patients and control participants
Ten ml of venous blood were drawn by syringe into 0.5 ml of saline with EDTA, incubated for 10 min at room temperature, and centrifuged for 15 min at 2500 ×g. Plasmas were stored in 0.25-ml aliquots at -80°C. CSF levels of P-T181-tau and Aβ 1–42 were quantified by xMAP Technology (Luminex Corp., Austin, TX, USA) using Inno-Bia AlzBio3 kits (Innogenetics, Ghent, Belgium).
Enrichment of plasma astrocyte-derived exosomes (ADEs) for extraction and ELISA quantification of proteins
Aliquots of 0.25 ml plasma were incubated with 0.1 ml thromboplastin D (Thermo Fisher Scientific, Waltham, MA, USA), followed by addition of 0.15 ml of calcium- and magnesium-free Dulbecco's balanced salt solution (DBS-2) with protease inhibitor cocktail (Roche, Indianapolis, IN, USA) and phosphatase inhibitor cocktail (Thermo Fisher Scientific) (DBS++) 17. After centrifugation at 3000 ×g for 30 min at 4°C, total exosomes were harvested from resultant supernatants by precipitation with 126 uL per tube of ExoQuick (System Biosciences, Mountain View, CA, USA) and centrifugation at 1500 ×g for 30 min at 4°C. To enrich ADEs, total exosomes were resuspended in 0.35 ml of DBS-2 and incubated for 60 min at room temperature with 1.5 μg of mouse anti-human Glutamine Aspartate Transporter (GLAST) (ACSA-1) biotinylated antibody (Miltenyi Biotec, Inc., Auburn, CA) in 50 μL of 3% BSA (1:3.33 dilution of Blocker BSA 10% solution in DBS-2 [Thermo Scientific, Inc.]) per tube with mixing, followed by addition of 10 μl of streptavidin-agarose Ultralink resin (Thermo Scientific, Inc.) in 40 μL of 3% BSA and incubation for 30 min at room temperature with mixing. After centrifugation at 800 ×g for 10 min at 4°C and removal of the supernate, each pellet was suspended in 100 μL of cold 0.05 M glycine-HCl (pH 3.0) by gentle mixing for 10 sec and centrifuged at 4000 ×g for 10 min, all at 4°C. Supernatants then were transferred to clean tubes containing 25 μL of 10% BSA and 10 μL of 1 M Tris-HCl (pH=8.0) and mixed before addition of 365 μL of mammalian protein extraction reagent (M-PER) (ThermoFisher Scientific). Resultant 0.5 ml lysates of ADEs were stored at -80°C. NDEs were prepared as described 23.
ADE and NDE proteins were quantified by ELISA kits for human tetraspanning exosome marker CD81, complement fragment C4b, DAF (CD55) (American Research Products–Cusabio, Waltham, MA, USA), glutamine synthetase (GluSyn), CR1, factor I (American Research Products-Cloud-Clone Corp., Waltham, MA), glial fibrillary acidic protein (GFAP) (EMD-Millipore Corp., Billerica, MA), complement fragment C3d, CD46 (LifeSpan Biosciences, Inc., Seattle, WA), complement fragment C3b, complement factor B, C1q portion of the C1 complement complex (Abcam, Inc., Cambridge, MA), Bb fragment of complement factor B (Quidel-Microvue, San Diego, CA), terminal complement complex C5b-C9 (Elabscience, Bethesda, MD), CD59, interleukin-1- β (IL-1β), mannose-binding lectin (MBL) (Ray Biotech, Inc., Norcross, GA), tumor necrosis factor- α (TNF-α), complement factor D and IL-6 (ThermoFisher-Invitrogen, LaFayette, CO). The mean value for all determinations of CD81 in each assay group was set at 1.00 and relative values of CD81 for each sample were used to normalize their recovery.
Statistical analyses
The Shapiro-Wilks test showed that data in all sets were distributed normally. Statistical significance of differences between means for cross-sectional groups AD and C, and between longitudinal groups AD1 and C were determined with an unpaired Student's t test, including a Bonferroni correction, and the significance of differences between means for longitudinal groups AD1 and AD2 were determined with a paired Student's t test (Prism 6; GraphPad Software, La Jolla, CA, USA).
Results
Patients at the AD2 stage in the longitudinal study were older and had greater mean cognitive impairment at a level of mild to moderate dementia than the AD patients in the cross-sectional study with MCI or mild dementia (Table 1). There was no significant difference in cognitive abilities between the control group and those at the A1 preclinical stage of AD in the longitudinal study.
For the cross-sectional study, mean CD81-normalized ADE levels of IL-6, TNF-α and IL-1β all were significantly higher for AD patients than age- and gender-matched controls, but there was extensive overlap between the sets of values for AD patients and controls (Fig. 1). To contrast quantities of the cytokine protein cargoes of ADEs with those of NDEs, NDEs were harvested immunochemically from the same precipitated populations of total plasma exosomes as the ADEs for ten of the AD patients and their matched controls. CD81-normalized NDE values of TNF-α were 20.8±2.15 pg/ml (mean±S.E.M.) for AD patients and 26.3±2.47 pg/ml for controls, respectively, that were significantly lower than those of ADEs (p<0.001). Cytokine protein levels of IL-6 and IL-1β were not reliably detected in any of the NDE samples.
Figure 1. ADE levels of inflammatory cytokines in cross-sectional control and AD groups.
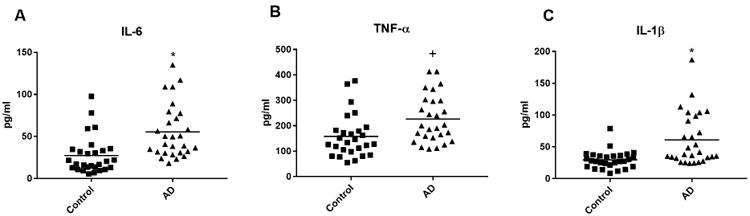
Each point represents the value for a control subject or AD patient and the horizontal line in point clusters is the mean level for that group. Mean±S.E.M. control and AD patient values, respectively, are 27.4±4.22 pg/ml and 55.5±6.02 pg/ml for IL-6, 158±16.2 pg/ml and 226±17.9 pg/ml for TNF-α, and 29.6±2.63 pg/ml and 61.3±7.75 pg/ml for IL-1β. The significance of differences between values for controls and AD patients was calculated by an unpaired Student's t test; +=p<0.01 and *=p<0.001.
ADE levels of components, fragments and complexes of the complement systems all were substantially higher than those of the immune cytokines assessed (Fig. 2). CD81-normalized mean ADE levels of components exclusively of the classical pathway of complement, C1q and C4b, and exclusively of the alternative pathway of complement, factor B, factor D and Bb were significantly higher for AD patients than controls (p<0.0001) (Fig. 2). CD81-normalized mean ADE values of the complement fragments C3b and C3d, and of the C5b-C9 terminal complement complex (TCC) generated by both pathways also were significantly higher for AD patients than controls (p<0.0001). Perhaps more importantly, there was far less overlap between values of the AD patients and controls for the complement effector protein analytes than the cytokines. In contrast, levels of mannose-binding lectin (MBL) of the lectin-activated complement pathway in ADEs from AD patients and controls were indistinguishable and far lower than normal MBL concentrations in plasma of >7,800 pg/ml (Fig. 2) 24. As for cytokines, NDEs had substantially lower CD81-normalized levels of complement effector components than ADEs (Table 2).
Figure 2. ADE levels of complement effector proteins in cross-sectional control and AD groups.
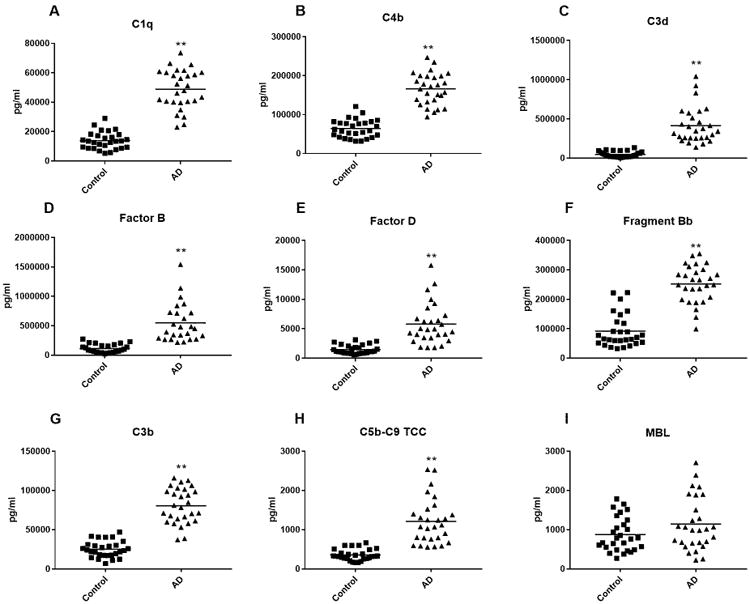
Each point represents the value for a control subject or AD patient and the horizontal line in point clusters is the mean level for that group. Mean±S.E.M. control and AD patient values, respectively, are 13,902±1105 pg/ml and 48,906±2528 for C1q, 64,305±4408 pg/ml and 166,151±7647 pg/ml for C4b, 48,705±6,966 pg/ml and 416,093±44,866 pg/ml for C3d, 113,321±14,402 pg/ml and 547,292±66,082 pg/ml for complement factor B, 1465±140 pg/ml and 5800±658 pg/ml for complement factor D, 91,933±10,641 pg/ml and 252,271±11,912 pg/ml for factor B fragment Bb, 25,175±1973 pg/ml and 80,703±4286 pg/ml for C3b, 355±27.1 pg/ml and 1212±109 pg/ml for C5b-C9 TCC, and 874±82.1 pg/ml and 1141±128 pg/ml for MBL. The significance of differences between values for controls and AD patients was calculated by an unpaired Student's t test; **=p<0.0001. For comparison, NDE values were 68.8±7.09 pg/ml, 11,562±987 pg/ml, 9,354±602 pg/ml, 14,624±835 pg/ml, 7,128±840 pg/ml and 306±29.1 pg/ml for C5b-C9 TCC, C3d, C4b, Bb, factor B and factor D, respectively, in AD patients and were 54.2±6.37 pg/ml, 1,855±134 pg/ml, 3,851±276 pg/ml, 6,029±438 pg/ml, 2,055±276 pg/ml and 94.2±10.7 pg/ml for C5b-C9 TCC, C3d, C4b, Bb, and factors B and D, respectively, in controls (Table 2).
Table 2. Differences in levels of complement components in ADEs and NDEs.
| ADEs | C5b-C9 TCC | C3d | C4b | Bb | Factor B | Factor D | ||||||
| Subjects | Cntrl | AD | Cntrl | AD | Cntrl | AD | Cntrl | AD | Cntrl | AD | Cntrl | AD |
| 355 | 1212 | 48,705 | 416,093 | 64,305 | 166,151 | 91,933 | 252,271 | 113,321 | 547,292 | 1465 | 5800 | |
| NDEs | C5b-C9 TCC | C3d | C4b | Bb | Factor B | Factor D | ||||||
| Subjects | Cntrl | AD | Cntrl | AD | Cntrl | AD | Cntrl | AD | Cntrl | AD | Cntrl | AD |
| 54.2 | 68.8 | 1855 | 11,562 | 3851 | 9354 | 6059 | 14,624 | 2055 | 7128 | 94.2 | 306 | |
Cntrl= controls and AD= Alzheimer's disease patients. All values shown are mean pg/ml (values for mean±S.E.M. are in the text of Results or in the legend for Figure 2). All differences between levels of corresponding analytes in ADEs and NDEs are significant with p<0.0001.
In cross-sectional studies, CD81-normalized mean ADE levels of four membrane-associated complement regulatory proteins, but not fluid-phase regulatory protein factor I, were significantly lower for AD patients than controls (p<0.01 for CR1, p=0.0003 for CD46, and p<0.0001 for CD59 and DAF) (Fig 3). Attempts to quantify factor H with two Elisa kits based on different antibody pairs and ranges of sensitivity (Abcam 137975 and RayBiotech ELH-CFH-1) yielded more than three-fold disparate values presumably attributable to differential recognition of factor H-like and other cross-reactive proteins.
Figure 3. ADE levels of complement regulatory proteins in cross-sectional control and AD groups.
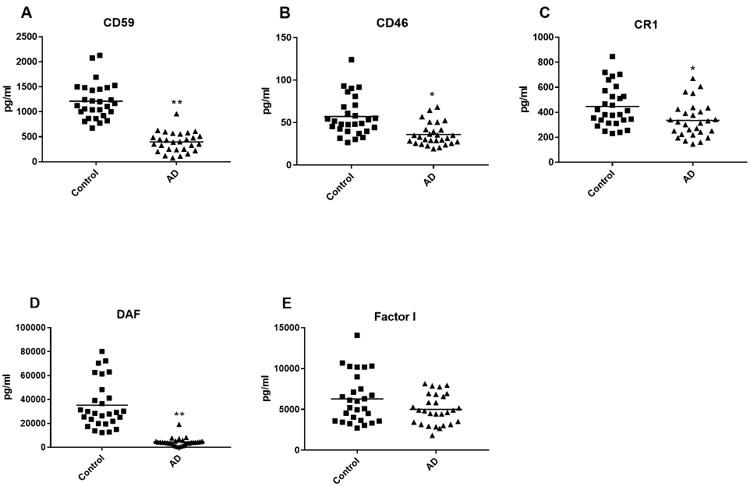
Each point represents the value for a control subject or AD patient and the horizontal line in point clusters is the mean level for that group. Mean±S.E.M. control and AD patient values, respectively, are 1211±68.5 pg/ml and 398±37.1 pg/ml for CD59, 57.2±4.39 pg/ml and 36.1±2.47 pg/ml for CD46, 447±31.4 pg/ml and 336±26.1 pg/ml for CR1, 35,197±3735 pg/ml and 4,563±654 pg/ml for DAF, and 6281±562 pg/ml and 5010±346 pg/ml for factor I. The significance of differences between values for controls and AD patients was calculated by an unpaired Student's t test; *= p<0.01 and **=p<0.0001.
In longitudinal studies, mean ADE levels of all complement effector proteins quantified were significantly higher at the AD2 stage of mild to moderate dementia than at the AD1 preclinical stage and for controls (Fig. 4). However, there were no differences between the mean ADE levels of any complement effector protein assessed at the AD1 preclinical stage and those of matched controls. In contrast, for CD59 and DAF, the two complement regulatory proteins with the greatest difference in levels between AD patients and controls in the cross-sectional studies, mean ADE levels were significantly lower at the AD1 preclinical stage than for controls (Fig. 4). Progressive decline in ADE levels of CD59 and DAF with cognitive loss resulted in significantly lower levels of both complement regulatory proteins at the AD2 stage of moderate dementia than at the AD1 preclinical stage (Fig. 4).
Figure 4. ADE levels of complement proteins and cytokines in the longitudinal study.
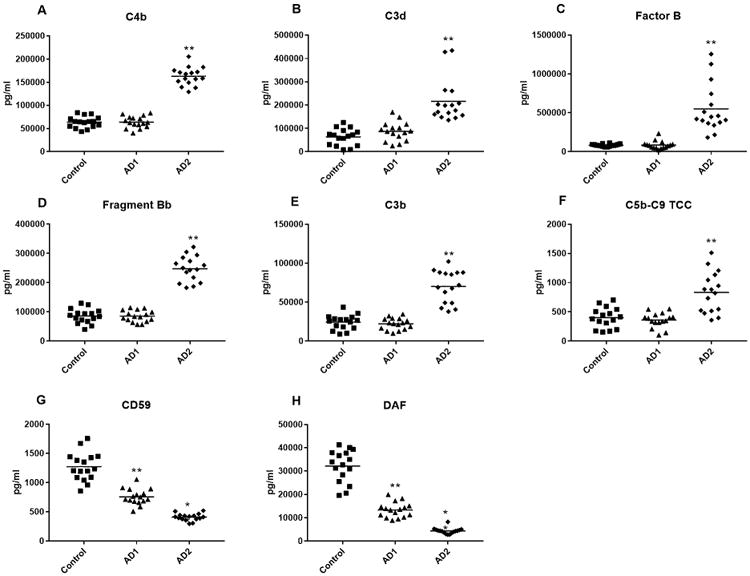
Each point represents the value for a control subject or AD patient and the horizontal line in point clusters is the mean level for that group. Control, AD1 patient and AD2 patient values (mean±S.E.M.), respectively, are 63,621±3056, 63,901±3130 and 163,273±4864 for C4b, 62,958±8,945, 86,911±10,020 and 215,660±23,018 pg/ml for C3d, 82,681±3,921, 84,385±12,808 and 548,930±77,855 pg/ml for complement factor B, 85,716±6181, 85,123±4836 and 247,574± 10,740 pg/ml for factor B fragment Bb, 24,347±2350, 22,212±1866 and 70,039±5245 pg/ml for C3b, 400±43.4, 359±31.7 and 832±87.2 pg/ml for C5b-C9 TCC; 1272±61.4, 757±33.6 and 409±15.4 pg/ml for CD59, and 32,123±1733, 13,352±803 and 4369+320 pg/ml for DAF. The significance of differences between values for controls and AD1 patients was calculated by an unpaired Student's t test and for differences between values for AD1 and AD2 patients was calculated by a paired Student's t test; **=p<0.0001.
Control, AD1 and AD2 patient values (mean±S.E.M.), respectively, were 29.4±4.20, 24.0±3.32 and 71.8±6.21 pg/ml for IL-6, 141±10.32, 131±7.46 and 221±10.3 pg/ml for TNF-α, and 28.1±2.91, 18.5±2.07 and 54.0±5.75 pg/ml for IL-1β. Thus, as for complement effector proteins, there were no differences between ADE levels of inflammatory cytokines at the AD1 preclinical stage and those of matched controls, but the levels at the AD2 stage were significantly higher than at the AD1 stage (p<0.001).
Discussion
The capacity to enrich NDEs and ADEs separately from the same plasma samples has allowed analyses of a wide range of neural cargo proteins which are relevant to the pathogenesis of AD and other neurodegenerative diseases 17, 23, 25. Differences in levels of NDE proteins, that have primary and amplifying pathogenic roles, have proven to be practically useful for preclinical prediction of risk of development of AD and conversion from MCI to dementia 26. Abnormal levels of some NDE proteins correlate with the severity of dementia in AD, as determined by significant relationships with decreases in cognitive function and with losses of brain mass in MRI studies 23, 27, 28. Levels of some proteins involved in the generation of neurotoxic amyloid peptides are higher in ADEs than NDEs, suggesting that transfer of these enzymes in ADEs to neurons may represent one mechanism for neurotoxic effects of reactive astrocytes. Measuring the levels and activities of amyloid peptide-generating enzymes in ADEs before and after treatment may provide a test method for assessing in vivo effects of drugs directed to these pathways 17.
New findings described here of elevated ADE levels of classical and alternative complement pathway proteins in AD patients compared to those of matched control subjects suggest that type A1 reactive astrocytes may generate these inflammatory mediators and deliver them to other CNS cells by ADEs (Fig. 2). Elevated concentrations of C4b and Bb in ADEs of AD patients support involvement of both the classical and alternative complement pathways in the generation of C3b and C5b-C9 TCC. The low levels of MBL without a difference between ADEs of AD patients and controls is against involvement of the lectin complement pathway. Delivery of C3b to neurons by ADEs and its display on neuronal surface membranes may initiate microglial cytotoxic attacks on the affected neurons. C3b on neuronal surface membranes also may evoke local generation of C5b-C9 TCC in addition to the preformed C5b-C9 TCC delivered by ADEs, both of which complexes would be capable of damaging neurons. These neurotoxic complement fragments and complexes may be delivered largely by ADEs through their established mechanism of direct intercellular communication. Enhanced activity of C3 convertases of the classical and alternative complement systems, greater generation of C5b and increased assembly of C5b-C9 TCC all would be amplified by the acquired deficiencies of multiple complement regulatory proteins, especially CD59 and DAF (Fig. 3). Levels of the plasma-based factor I, which with co-factor H or CD46 constitutes a C3b/C4b inactivator, were no different in AD patients than controls. Neuronal damage by the complement pathways also could be mediated by C3a and C5a, the inflammatory anaphylatoxins generated concurrently with larger fragments, although these have not been examined in the present study 29.
Diminished ADE levels of membrane-associated complement regulatory proteins CD59 and DAF in AD relative to those in control subjects were found at the preclinical AD1 stage of AD, when complement effector proteins were still at control levels (Fig. 4). This time-course for development of complement abnormalities suggests that inadequate control is the primary underlying mechanism of enhanced complement activation in reactive astrocytes. An immunohistochemical study of post-mortem human brain tissues in AD had shown staining for C3 and C4 fragments, C1q and C5b-C9, with intensities that paralleled amyloid plaque density 30. In the same brain tissues, the complement regulatory proteins CD59, CR1, DAF and MCP (CD46) were not detected raising the possibility of lack of control of activation of complement pathways. CR1 antigens were detected in astrocytes in culture and in brain tissues subsequently, but neither CR1 levels nor binding activity accounted for the associations of sporadic AD with some genetic variants of CR1 31. More complete analyses may be required however, as results of genome-wide association studies of AD have implicated single nucleotide polymorphism variants of CR1 as possible risk factors 32, 33.
ADE cytokine and effector complement abnormalities are not present preclinically, but were manifested significantly at the time of onset of MCI or dementia (Figs. 1, 2 and 4). Abnormal levels of complement and cytokine proteins show the greatest abnormalities in later stages of the disease in this small number of study subjects (Fig. 4). ADE levels of TNF-α and IL-1β in AD are similar to those generated by microglia, that initiate transformation of astrocytes into the neurotoxic reactive A1 type. Thus these low levels of cytokines in ADEs may be most important for promoting continued production of neurotoxic type A1 astrocytes in AD lesions rather than mediating neuronal damage directly.
Many types of future investigations of the astrocyte sources and cytotoxic mechanisms of complement proteins in ADEs will be required to validate our initial findings. If distinctive membrane protein markers of the A1 and A2 sub-types of astrocytes are identified, it will be important to resolve these sub-types and investigate their respective capacities to generate complement proteins and to evaluate the separate neurotoxic potential of ADEs from A1 and A2 astrocytes. Further, larger numbers of subjects will be needed to delineate the relative roles of the classical and alternative complement pathways in AD, better define the time-course of involvement of each ADE cargo protein mechanism and improve our understanding of potential roles of these measurements as late-phase biomarkers in AD and other neurodegenerative diseases. It is of special interest that both complement pathways and their neurotoxic products are present at potentially functional levels in ADEs of cognitively normal elderly subjects. Complement mediators thus may be one mechanism for induction of neuroinflammation in normal aging, but such conclusions will require at the least studies with younger control groups.
If our findings are validated, they may inform possible future therapies. The administration or enhanced local generation of one or more recombinant complement control proteins early in AD, guided by their diminished levels in plasma ADEs of individual patients, could limit recruitment of complement mechanisms preventatively. In later phases of AD, when complement activation has appeared, neutralizing monoclonal antibodies to effector complement components or their receptors, decoy complement receptors or receptor antagonists, and esterase inhibitors of complement mediator generation may suppress ongoing complement-mediated neuronal injury.
Acknowledgments
We are grateful to Professors John Atkinson (Washington U., St. Louis, MO) and K. Frank Austen (Harvard U., Boston, MA) for their advice about studying complement. The authors thank Judith H. Goetzl (Jewish Home of San Francisco) for expert preparation of the illustrations. This work was supported by a grant from the Biomarkers Across Neurodegenerative Diseases 2 (BAND2) program of the Michael J. Fox Foundation for Parkinson's Research, the Alzheimer's Association, Alzheimer's Research United Kingdom, and the Weston Brain Institute (to E.J.G.); and by the U.S. National Institutes of Health (NIH) National Institute on Aging (NIA) (Grant P30028383; to G.A.J.). D.K. was supported by the Intramural Research Program of the NIH NIA.
Abbreviations
- AD
Alzheimer's disease
- ADE
astrocyte-derived exosome
- NDE
neuron-derived exosome
- TCC
terminal complement complex
- MCI
mild cognitive impairment
- DBS-2
calcium- and magnesium-free Dulbecco's balanced salt solution
- DBS++
DBS-2 with protease and phosphatase inhibitors; glial fibrillary acidic protein
- C1q
a component of the C1 complex of complement
- C3
third component of complement
- C3b
major fragment of C3
- C3d
stable fragment of the C3b portion of C3
- C4b
major fragment of the fourth component of complement
- C5b
major fragment of the fifth component of complement
- Bb
major fragment of complement factor B
- C9
ninth component of complement
- BACE-1
β-site amyloid precursor protein-cleaving enzyme 1
- sAPPβ
soluble amyloid precursor protein β
- Aβ42 peptide
amyloid-β peptide 1-42
- MBL
mannose-binding lectin
- AD1
preclinical stage of AD
- AD2
later stage of AD with documented dementia
- GluSyn
glutamine synthetase
- GLAST
Glutamine Aspartate Transporter
- CD59
a complement regulatory protein also known as membrane attack complex-inhibitory protein
- DAF
decay-accelerating factor
- CR1
complement receptor type 1
- CD46
a complement regulatory protein also known as membrane cofactor protein (MCP)
Footnotes
Author contributions: EJG and DK contributed to the conception and design of the study; EJG, ELA, GAJ, DK and JBS contributed to the acquisition and analysis of data; EJG, DK, ELA and JBS contributed to drafting the text.
Potential Conflicts of Interest: E.J.G. has filed an application with the U.S. Patent Office for the platform and methodologies described in this report. The remaining authors declare no potential conflicts of interest.
References
- 1.Sofroniew MV, Vinters HV. Astrocytes: biology and pathology. Acta Neuropathol. 2010 Jan;119(1):7–35. doi: 10.1007/s00401-009-0619-8. [DOI] [PMC free article] [PubMed] [Google Scholar]
- 2.Zamanian JL, Xu L, Foo LC, et al. Genomic analysis of reactive astrogliosis. J Neurosci. 2012 May 02;32(18):6391–410. doi: 10.1523/JNEUROSCI.6221-11.2012. [DOI] [PMC free article] [PubMed] [Google Scholar]
- 3.Anderson MA, Burda JE, Ren Y, et al. Astrocyte scar formation aids central nervous system axon regeneration. Nature. 2016 Apr 14;532(7598):195–200. doi: 10.1038/nature17623. [DOI] [PMC free article] [PubMed] [Google Scholar]
- 4.Liddelow SA, Barres BA. Reactive Astrocytes: Production, Function, and Therapeutic Potential. Immunity. 2017 Jun 20;46(6):957–67. doi: 10.1016/j.immuni.2017.06.006. [DOI] [PubMed] [Google Scholar]
- 5.Ben Haim L, Carrillo-de Sauvage MA, Ceyzeriat K, Escartin C. Elusive roles for reactive astrocytes in neurodegenerative diseases. Front Cell Neurosci. 2015;9:278. doi: 10.3389/fncel.2015.00278. [DOI] [PMC free article] [PubMed] [Google Scholar]
- 6.Goetzl EJ, Miller BL. Multicellular hypothesis for the pathogenesis of Alzheimer's disease. Faseb J. 2017 May;31(5):1792–5. doi: 10.1096/fj.201601221R. [DOI] [PubMed] [Google Scholar]
- 7.Choi SS, Lee HJ, Lim I, Satoh J, Kim SU. Human astrocytes: secretome profiles of cytokines and chemokines. PLoS One. 2014;9(4):e92325. doi: 10.1371/journal.pone.0092325. [DOI] [PMC free article] [PubMed] [Google Scholar]
- 8.Liddelow SA, Guttenplan KA, Clarke LE, et al. Neurotoxic reactive astrocytes are induced by activated microglia. Nature. 2017 Jan 26;541(7638):481–7. doi: 10.1038/nature21029. [DOI] [PMC free article] [PubMed] [Google Scholar]
- 9.Crotti A, Ransohoff RM. Microglial Physiology and Pathophysiology: Insights from Genome-wide Transcriptional Profiling. Immunity. 2016 Mar 15;44(3):505–15. doi: 10.1016/j.immuni.2016.02.013. [DOI] [PubMed] [Google Scholar]
- 10.Sofroniew MV. Multiple roles for astrocytes as effectors of cytokines and inflammatory mediators. Neuroscientist. 2014 Apr;20(2):160–72. doi: 10.1177/1073858413504466. [DOI] [PubMed] [Google Scholar]
- 11.Ceyzeriat K, Abjean L, Carrillo-de Sauvage MA, Ben Haim L, Escartin C. The complex STATes of astrocyte reactivity: How are they controlled by the JAK-STAT3 pathway? Neuroscience. 2016 Aug 25;330:205–18. doi: 10.1016/j.neuroscience.2016.05.043. [DOI] [PubMed] [Google Scholar]
- 12.Stevens B, Allen NJ, Vazquez LE, et al. The classical complement cascade mediates CNS synapse elimination. Cell. 2007 Dec 14;131(6):1164–78. doi: 10.1016/j.cell.2007.10.036. [DOI] [PubMed] [Google Scholar]
- 13.Lian H, Yang L, Cole A, et al. NFkappaB-activated astroglial release of complement C3 compromises neuronal morphology and function associated with Alzheimer's disease. Neuron. 2015 Jan 07;85(1):101–15. doi: 10.1016/j.neuron.2014.11.018. [DOI] [PMC free article] [PubMed] [Google Scholar]
- 14.Hong S, Beja-Glasser VF, Nfonoyim BM, et al. Complement and microglia mediate early synapse loss in Alzheimer mouse models. Science. 2016 May 06;352(6286):712–6. doi: 10.1126/science.aad8373. [DOI] [PMC free article] [PubMed] [Google Scholar]
- 15.Kraft AW, Hu X, Yoon H, et al. Attenuating astrocyte activation accelerates plaque pathogenesis in APP/PS1 mice. Faseb J. 2013 Jan;27(1):187–98. doi: 10.1096/fj.12-208660. [DOI] [PMC free article] [PubMed] [Google Scholar]
- 16.Heppner FL, Ransohoff RM, Becher B. Immune attack: the role of inflammation in Alzheimer disease. Nat Rev Neurosci. 2015 Jun;16(6):358–72. doi: 10.1038/nrn3880. [DOI] [PubMed] [Google Scholar]
- 17.Goetzl EJ, Mustapic M, Kapogiannis D, et al. Cargo proteins of plasma astrocyte-derived exosomes in Alzheimer's disease. Faseb J. 2016 Nov;30(11):3853–9. doi: 10.1096/fj.201600756R. [DOI] [PMC free article] [PubMed] [Google Scholar]
- 18.Cano SJ, Posner HB, Moline ML, et al. The ADAS-cog in Alzheimer's disease clinical trials: psychometric evaluation of the sum and its parts. J Neurol Neurosurg Psychiatry. 2010 Dec;81(12):1363–8. doi: 10.1136/jnnp.2009.204008. [DOI] [PubMed] [Google Scholar]
- 19.Petersen RC. Mild cognitive impairment as a diagnostic entity. J Intern Med. 2004 Sep;256(3):183–94. doi: 10.1111/j.1365-2796.2004.01388.x. [DOI] [PubMed] [Google Scholar]
- 20.Sperling RA, Aisen PS, Beckett LA, et al. Toward defining the preclinical stages of Alzheimer's disease: recommendations from the National Institute on Aging-Alzheimer's Association workgroups on diagnostic guidelines for Alzheimer's disease. Alzheimers Dement. 2011 May;7(3):280–92. doi: 10.1016/j.jalz.2011.03.003. [DOI] [PMC free article] [PubMed] [Google Scholar]
- 21.Shaw LM, Vanderstichele H, Knapik-Czajka M, et al. Cerebrospinal fluid biomarker signature in Alzheimer's disease neuroimaging initiative subjects. Ann Neurol. 2009 Apr;65(4):403–13. doi: 10.1002/ana.21610. [DOI] [PMC free article] [PubMed] [Google Scholar]
- 22.Dubois B, Feldman HH, Jacova C, et al. Research criteria for the diagnosis of Alzheimer's disease: revising the NINCDS-ADRDA criteria. Lancet Neurol. 2007 Aug;6(8):734–46. doi: 10.1016/S1474-4422(07)70178-3. [DOI] [PubMed] [Google Scholar]
- 23.Goetzl EJ, Kapogiannis D, Schwartz JB, et al. Decreased synaptic proteins in neuronal exosomes of frontotemporal dementia and Alzheimer's disease. Faseb J. 2016 Dec;30(12):4141–8. doi: 10.1096/fj.201600816R. [DOI] [PMC free article] [PubMed] [Google Scholar]
- 24.Thiel S, Frederiksen PD, Jensenius JC. Clinical manifestations of mannan-binding lectin deficiency. Mol Immunol. 2006 Jan;43(1-2):86–96. doi: 10.1016/j.molimm.2005.06.018. [DOI] [PMC free article] [PubMed] [Google Scholar]
- 25.Mustapic M, Eitan E, Werner JK, Jr, et al. Plasma Extracellular Vesicles Enriched for Neuronal Origin: A Potential Window into Brain Pathologic Processes. Front Neurosci. 2017;11:278. doi: 10.3389/fnins.2017.00278. [DOI] [PMC free article] [PubMed] [Google Scholar]
- 26.Winston CN, Goetzl EJ, Akers JC, et al. Prediction of conversion from mild cognitive impairment to dementia with neuronally derived blood exosome protein profile. Alzheimers Dement (Amst) 2016;3:63–72. doi: 10.1016/j.dadm.2016.04.001. [DOI] [PMC free article] [PubMed] [Google Scholar]
- 27.Mullins RJ, Mustapic M, Goetzl EJ, Kapogiannis D. Exosomal biomarkers of brain insulin resistance associated with regional atrophy in Alzheimer's disease. Hum Brain Mapp. 2017 Apr;38(4):1933–40. doi: 10.1002/hbm.23494. [DOI] [PMC free article] [PubMed] [Google Scholar]
- 28.Goetzl EJ, Abner EL, Jicha GA, Kapogiannis D, Schwartz JB. Declining levels of functionally specialized synaptic proteins in plasma neuronal exosomes with progression of Alzheimer's disease. Faseb J. 2017 Oct 12; doi: 10.1096/fj.201700731R. [DOI] [PMC free article] [PubMed] [Google Scholar]
- 29.Hajishengallis G, Reis ES, Mastellos DC, Ricklin D, Lambris JD. Novel mechanisms and functions of complement. Nat Immunol. 2017 Nov 16;18(12):1288–98. doi: 10.1038/ni.3858. [DOI] [PMC free article] [PubMed] [Google Scholar]
- 30.Zanjani H, Finch CE, Kemper C, et al. Complement activation in very early Alzheimer disease. Alzheimer Dis Assoc Disord. 2005 Apr-Jun;19(2):55–66. doi: 10.1097/01.wad.0000165506.60370.94. [DOI] [PubMed] [Google Scholar]
- 31.Fonseca MI, Chu S, Pierce AL, et al. Analysis of the Putative Role of CR1 in Alzheimer's Disease: Genetic Association, Expression and Function. PLoS One. 2016;11(2):e0149792. doi: 10.1371/journal.pone.0149792. [DOI] [PMC free article] [PubMed] [Google Scholar]
- 32.Lambert JC, Heath S, Even G, et al. Genome-wide association study identifies variants at CLU and CR1 associated with Alzheimer's disease. Nat Genet. 2009 Oct;41(10):1094–9. doi: 10.1038/ng.439. [DOI] [PubMed] [Google Scholar]
- 33.Corneveaux JJ, Myers AJ, Allen AN, et al. Association of CR1, CLU and PICALM with Alzheimer's disease in a cohort of clinically characterized and neuropathologically verified individuals. Hum Mol Genet. 2010 Aug 15;19(16):3295–301. doi: 10.1093/hmg/ddq221. [DOI] [PMC free article] [PubMed] [Google Scholar]