Summary
Background
In clinical dermatology, the identification of subsurface vascular and structural features known to be associated with numerous cutaneous pathologies remains challenging without the use of invasive diagnostic tools.
Objective
To present an advanced optical coherence tomography angiography (OCTA) method to directly visualize capillary-level vascular and structural features within skin in vivo.
Methods
An advanced OCTA system with a 1310 nm wavelength was used to image the microvascular and structural features of various skin conditions. Subjects were enrolled and OCTA imaging was performed with a field of view of approximately 10 × 10 mm. Skin blood flow was identified using an optical microangiography (OMAG) algorithm. Depth-resolved microvascular networks and structural features were derived from segmented volume scans, representing tissue slabs of 0 – 132 µm, 132 – 330 µm, and 330 – 924 µm, measured from the surface of the skin.
Results
Subjects with both healthy and pathological conditions, such as benign skin lesions, psoriasis, chronic graft-versus-host-disease (cGvHD) and scleroderma, were OCTA scanned. Our OCTA results detailed variations in vascularization and local anatomical characteristics, for example, depth-dependent vascular and structural alterations in psoriatic skin, alongside their resolve over time; vascular density changes and distribution irregularities, together with corresponding structural depositions in the skin of cGvHD patients; and vascular abnormalities in the nail folds of a patient with scleroderma.
Conclusion
OCTA can image capillary blood flow and structural features within skin in vivo, which has the potential to provide new insights into the pathophysiology, as well as dynamic changes of skin diseases, valuable for diagnoses and non-invasive monitoring of disease progression and treatment.
Introduction
Current knowledge concerning the organization of cutaneous vasculature emerged in the last forty years1, showing skin vascular networks organized into upper- (superficial dermis, 1 – 1.5 mm) and lower horizontal plexuses (dermal-subcutaneous junction, 2 – 3 mm). Cutaneous microcirculation consists of ascending arterioles, capillary loops and venules, and is formed by the upper plexus within the dermal papillae1,2. This superficial plexus supplies the epidermis and superficial dermis, and changes within such occur in numerous conditions, including psoriasis, scleroderma and melanoma3–10. Despite plausible relevance, however, the role of microvasculature in skin disease has remained largely unexplored due to a lack of detailed, non-invasive assessment methods. To date, few methods are capable of demonstrating 3D morphological features of cutaneous microcirculation in vivo11.
Here, we present optical coherence tomography angiography (OCTA), a novel method for visualizing superficial vascular plexus in situ, in real-time, at capillary-level resolution, and with a large field-of-view (FoV). The goals of this study are to present OCTA as a viable tool for clinical and research investigations of skin microvasculature, and to demonstrate microvascular and structural alterations that may be of clinical importance. OCTA combines a laser-based, non-invasive OCT imaging technology with an algorithm that contrasts the motion of red blood cells from static tissue12,13. The principle of OCT is likened to that of ultrasound, but uses backscattered light in place of ultrasound waves14,15. This method provides lateral and axial resolutions of ~10 µm and 5 µm, respectively, and has a penetration depth of ~2 mm. The FoV of an individual scan could reach 100 mm2, but more commonly, smaller scans of 9 mm2 are mosaicked, allowing for the imaging of entire anatomical regions, such as the hand. Volumetric angiography with 3D architectural and morphological information, including vessel size and density, is constructed using OCTA technology. Here, the microvasculature of healthy tissue, benign lesions, and inflammatory conditions are shown.
Methods
OCT Configuration
Here, we used a previously reported, swept source OCT (SS-OCT) system16. In short, a 200-kHz vertical-cavity surface-emitting (VCSEL) swept laser source (SL1310V1-10048, Thorlabs Inc.) provided light with a central wavelength of 1310 nm (IR range) and a spectral bandwidth of 100 nm. The scanning probe was configured as a hand-held device affixed with a spacer, within which a 5× or 10× objective lens (LSM03/LSM02, Thorlabs Inc.) focused a beam spot onto the skin with an incident power of 5 mW. The beam spot was scanned by a paired X–Y galvo scanner (6210H, Cambridge Technology), forming raster sampling patterns comprising fast (x-axis) and slow (y-axis) scans. The FoV was 40 – 100 mm2 with a depth of ~2 mm.
Subject Volunteers
Subjects with chronic sclerotic skin conditions (cGvHD and scleroderma) were diagnosed and referred by hematologists/oncologists from a hematopoietic cell transplant program, and rheumatologists, respectively, as patients were pre- or post-transplant. Subjects met diagnostic criteria for their respective diseases. Two subjects were recruited with cGvHD, and one subject was recruited with scleroderma. One psoriatic subject was recruited after being diagnosed by a dermatologist, and five, otherwise healthy, subjects were recruited after their benign skin lesions were identified. The study was conducted in accordance with a protocol approved by the Institutional Review Board of the University of Washington and informed consent was obtained from all subjects. The study followed the tenets of the Declaration of Helsinki and was conducted in compliance with the Health Insurance Portability and Accountability Act.
Image acquisition
For scanning, the hand-held probe was positioned approximately perpendicular to the skin surface and mineral oil was used as a refractive index matching medium. Each visit comprised multiple scans, each taking ~10 seconds; totaling ~45 minutes.
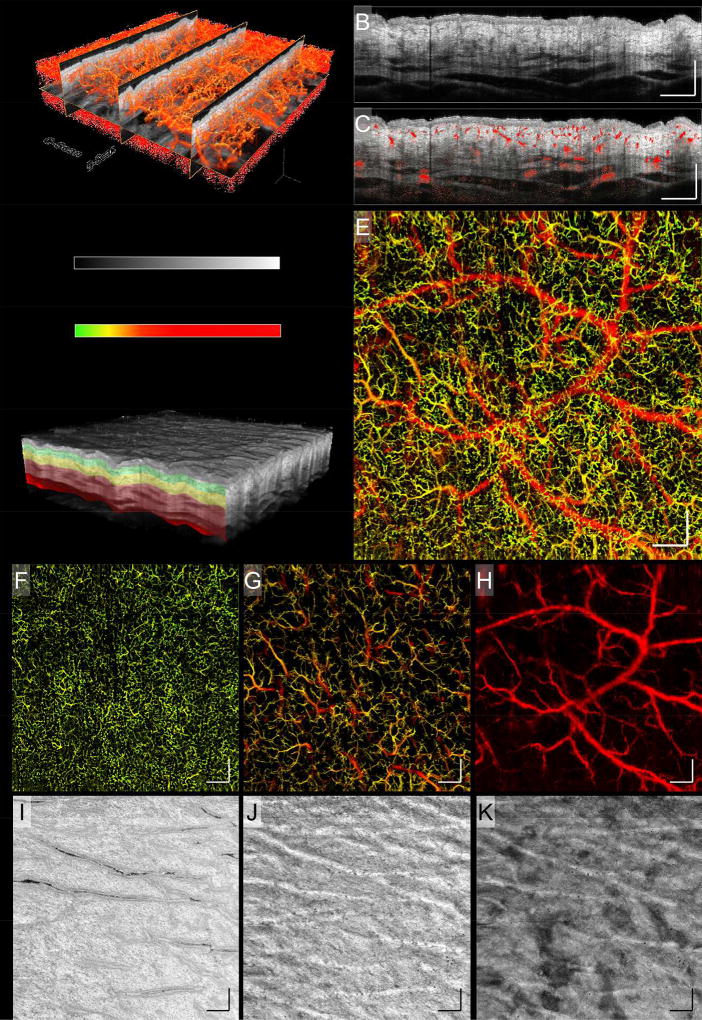
Figure 1 (A) outlines how 3D OCT volume scans were acquired prior to further processing and enface projection. Conventionally, an A-scan takes a depth profile snapshot of a spatial position on the skin. Multiple A-scans are taken at consecutive positions along the fast axis to create a 2D cross-sectional (vertical) image, a B-scan. Multiple B-scans are taken at adjacent locations along the slow axis to form a 3D C-scan. The 3D C-scan is then processed post-collection using an in-house-developed algorithm that was designed to perform the functions of 1) signal normalization, 2) motion-derived artifact removal, 3) registration, and 4) 2D enface projection of 3D datasets. Here, 800 A-scans produced a B-scan, and 800 B-scans produced a C-scan. Figure 1 (B) shows a B-scan displaying static tissue structure. Blood flow within the skin is distinguished using an optical microangiography (OMAG) algorithm17. Simply, by taking multiple B-scans at a single location, four in this case, one can contrast movement from stationary tissue based on the light scattering properties of flowing red blood cells. Figure 1 (C) shows the same B-scan from (B) overlaid with vascular information derived from OMAG. Figure 1 (D) shows a 3D C-scan. Extracting the vascular information from each B-scan position allows for an enface image to be compiled displaying only functional blood vessels (Fig. 1 (E)). Equally, structural enface images can be created. To denote vessel depth within an enface projected image, color coding is applied (Fig. 1).
Figure 1. Healthy skin (upper arm, male, Asian, 53 year old).
A schematic diagram of 3D OCT, OMAG, and volume segmentation. A) The component scans that produce a 3D OCT image. B) A typical 2D B-scan representing a cross-section of static tissue (structure). C) The same 2D B-scan from (B) overlaid with vascular information, showing the locations of functional blood vessels in relation to tissue structure. D) A 3D OCT volume scan highlighting how segmented slabs might be positioned. E) An enface projection of the 3D OCTA vasculature. F – H) The different vessel networks of the skin’s dermis layer, derived from the slabs highlighted in (D). The three slabs represent depths of 0 – 132 µm, 132 – 330 µm, and 330 – 924 µm, as measured from the skin’s surface, respectively. Shown are different vascular traits, i.e. size, density, and tortuosity, at each depth. I – K) Corresponding with the vascular slabs, shown is how tissue structure also differs with depth. The insert between (A) and (D) shows the color bars used to code OCT structural intensity, and depth information of blood vessels. These same color bars apply to all OCTA images in the study. Scale bars = 1 mm.
Image Segmentation
To better visualize the skin’s vascular and structural features, we segmented the 3D OCTA data into multiple horizontal slabs. This technique has been employed previously to visualize the various layers of the eye18–20, the skin21,22, and the brain23. Figure 1 (D) shows a 3D OCTA volume scan, or C-scan, segmented into three colored slabs. Each slab can be separated to visualize its vascular (Figs. 1 (F) – (H)) or structural features (Figs. 1 (I) – (K)). Here, enface vascular images derived from segmented volume scans represent slabs of 0 – 132 µm, 132 – 330 µm, and 330 – 924 µm, measured from the surface of the skin, closely representing vessels innervating the dermal-epidermal junction, papillary dermis, and reticular dermis, respectively. Similarly, enface structure images were derived from these segmented slabs. The chosen slab depths best display the characteristic vascular and structural features of each tissue layer.
Additionally, for qualitative comparative purposes, both upper and lower epidermal boundaries were highlighted on each of the cross-sectional B-scans (Figs. 2 – 5). This was carried out using structural B-scans because on such cross-sectional images, both boundaries are visible: the upper boundary is simply the surface of the skin, and lower boundary, i.e. the epidermal-dermal junction (EDJ), is visible through a severe shift in contrast from one side of the boundary to the other.
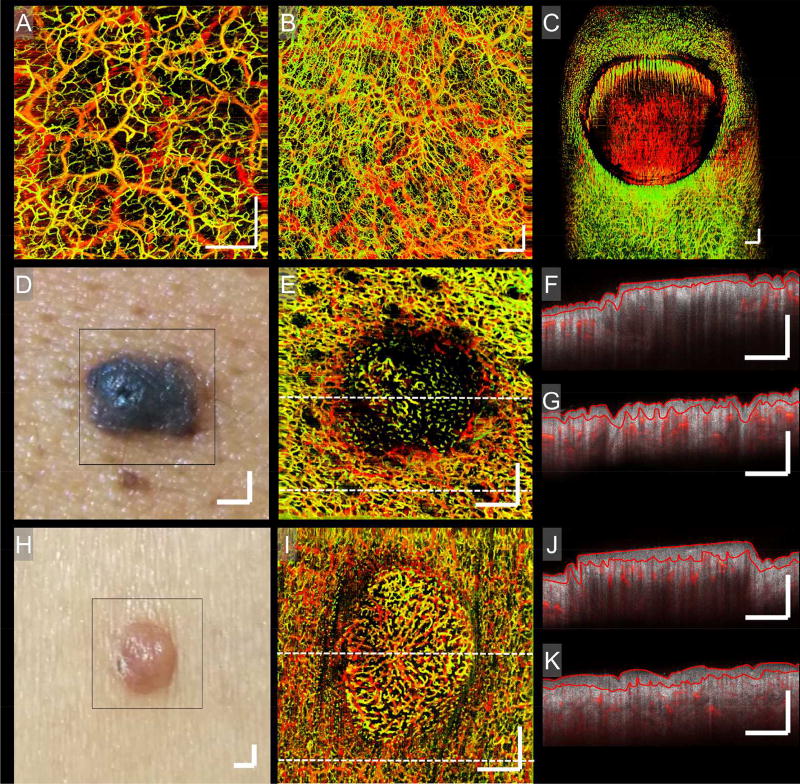
Figure 2. Normal and benign skin lesions.
Enface OCTA images showing the vasculatures of normal skin and benign skin lesions taken from different anatomic sites on numerous individuals. A) Normal skin, right shoulder. B) Normal skin, palm of the right hand. C) Normal nail unit. D) Photograph of a common blue nevus. E) An enface vascular image of (D). F and G) Two typical B-scans corresponding to the central and lower regions of (E), respectively; their locations highlighted by the corresponding perforated lines in (E). H) Photograph of an achrocordon. I) An enface vascular image of (H). J and K) Two B-scans corresponding to the central and lower regions of (I), respectively; their locations highlighted by the corresponding perforated lines in (I). Each B-scan shows the static tissue structure overlaid with the vasculature of their respective regions. On each of the B-scans, red lines highlight avascular epidermal boundaries. Shown is the normally homogenous distribution of vessels being altered by topographical and structural features, demonstrating the link between tissue structure and vasculature. Scale bars = 1 mm.
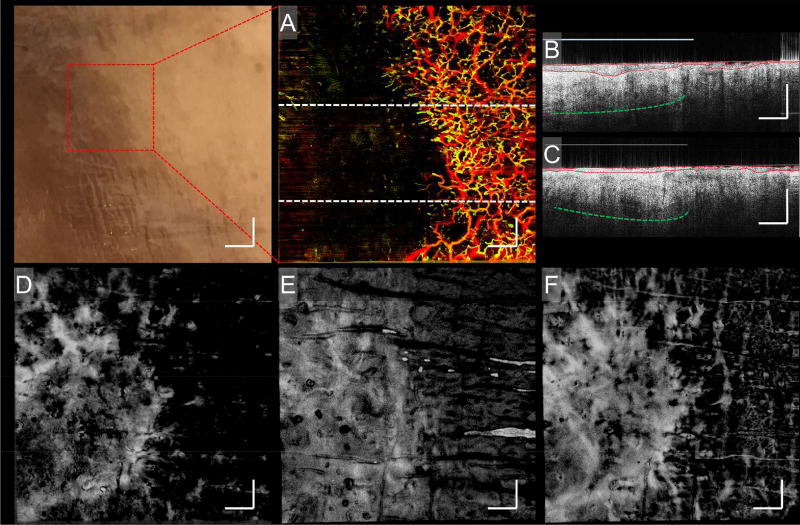
Figure 5. cGvHD.
A photograph and corresponding enface vascular, B-scan and enface structure images of a cutaneous cGvHD patient’s foot. The photograph identifies the region chosen for imaging. A) An enface vascular image corresponding to the site identified in the photograph. B and C) Two B-scans corresponding to the upper and lower regions of (A), respectively; their locations highlighted by the corresponding perforated lines in (A). On both B-scans, red lines highlight avascular epidermal boundaries, perforated green lines highlight enhanced structural brightness, and light blue lines highlight enhanced dermal reflectivity. Numerous structural features, such as fluctuating epidermal thickness, enhanced structural brightness and enhanced dermal reflectivity, are seen here to correlate with vasculature. D – F) Enface structure images corresponding to (A), segmented into three slabs representing depths of 0 – 132 µm, 132 – 330 µm, and 330 – 924 µm, approximately, respectively. Structural alterations correlating with vasculature appear most prominent in the papillary dermis region, (E). Scale bars = 1 mm.
Results
Normal skin
OCTA visualizes vasculatures from two separate layers of skin, the small capillaries of the superficial papillary dermis and the larger vessels of the deeper reticular dermis21,24. Figures 2 (A) and (B) show vasculatures from normal skin. The depth-specific color coding shows homogenous horizontal vessel distribution despite depth-dependent vessel density changes. Figure 2 (C) shows vasculature of a healthy nail unit, where vascular changes coincide with structural features, i.e. nail fold, nail bed, and surrounding skin. The capillary loops of the proximal nail fold appear aligned compared to random distribution within the adjacent skin, and vessels in the nail bed appear more aligned along its leading edge. This is evidence that vascular traits and tissue structures are invariably linked.
Pathological Skin Conditions
Also shown in Fig. 2 are two benign skin lesions, blue nevus and achrocordon. In both cases, vessel density, distribution and alignment differ from the surrounding skin (Figs. 2 (E) and (I)). In Figs. 2 (D) and (E), vessel orientation surrounding the blue nevus is aligned with topography, whilst vessel density within the blue nevus is reduced and orientated haphazardly. In the achrocordon, vessels are oriented centrally in a somewhat “starburst” pattern (Figs. 2 (H) and (I)). Figures 2 (F) and (G), and (J) and (K) are B-scans correlating with the upper and lower regions of their adjacent vascular images. Demonstrated are variations in structural features, such as epidermal and dermal thickness, within the lesions. The epidermal layer of each B-scan has been outlined because epidermal thickness, in particular, has been shown to vary significantly between anatomic sites25,26. Such structural features would be invisible to other non-invasive imaging modes, such as dermoscopy or capillaroscopy27,28. Biopsies can be used but these are invasive and the preparatory steps required for histopathology can distort the skin’s morphology leading to inaccurate estimations29. OCTA does not suffer from such constraints.
Psoriasis
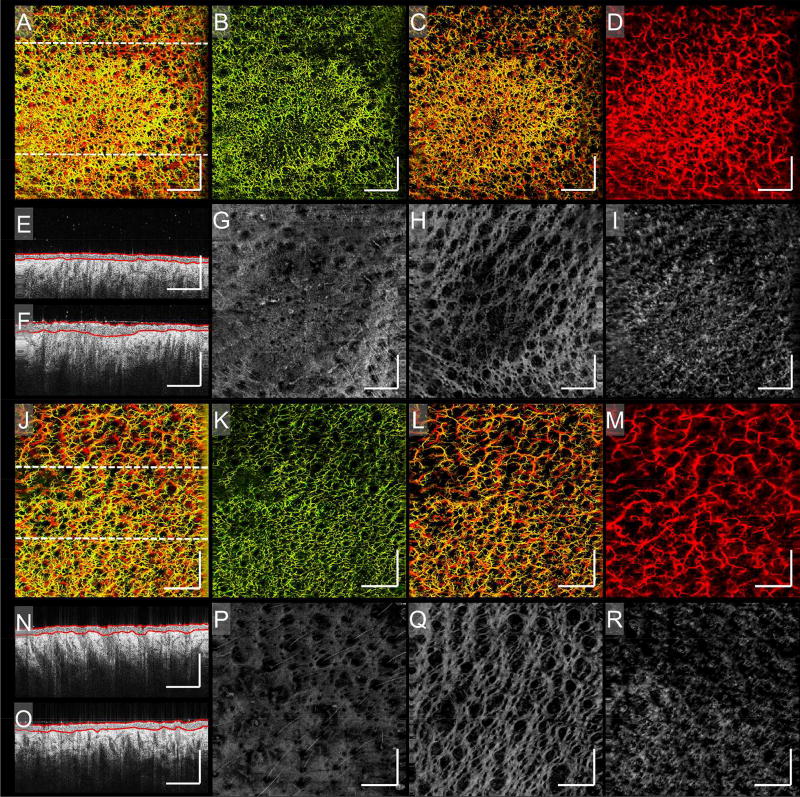
Figures 3 (A) and (J) show images of a psoriatic plaque taken two months apart. The first, (A), is an active plaque, and the second, (J), is the same plaque resolved. Increased vascular density that follows the topology of the plaque is seen in (A), which then subsides as the plaque resolves in (J). Figures 3 (E) and (F) show epidermal thickening within the active plaque, correlating with the increase of vascular density, and epidermal acanthosis seen histologically30,31. Epidermal thickness outside the plaque remains unchanged. Additionally, the increased structural brightness in the dermal region under the active plaque has been associated with increased dermal collagen deposition32. Figures 3 (N) and (O) show little structural variation between them suggesting that alongside vasculature, structural features are also normalising33.
Figure 3. Psoriasis.
Enface vascular images and corresponding structural images of a psoriatic plaque over two time points. A) An enface vascular image of an active psoriatic plaque. B – D) The vasculature of (A) segmented into three slabs of 0 – 132 µm, 132 – 330 µm, and 330 – 924 µm, approximately, respectively. Shown is the most severe vascular response to the plaque being located in the papillary dermis. E and F) Two B-scans corresponding to the upper and lower regions of (A), respectively; their locations highlighted by the corresponding perforated lines in (A). On both B-scans, red lines highlight avascular epidermal boundaries. G – I) The structure of (A) segmented into three slabs of 0 – 132 µm, 132 – 330 µm, and 330 – 924 µm, approximately, respectively. Alterations in tissue structure correlate with vascular changes and are most severe in the papillary dermis. J) An enface image of the same psoriatic plaque identified in (A), taken after two months when the plaque had resolved. K – M) The vasculature of (J) segmented into three slabs of 0 – 132 µm, 132 – 330 µm, and 330 – 924 µm, approximately, respectively. Normalization of the vasculature is clear. N and O) Two B-scans corresponding to the upper and lower regions of (J), respectively; their locations highlighted by the corresponding perforated lines in (J). On both B-scans, red lines highlight avascular epidermal boundaries. Little or no difference can be seen between either of the two regions. P – R) The structure of (J) segmented into three slabs of 0 – 132 µm, 132 – 330 µm, and 330 – 924 µm, approximately, respectively. Normalization of tissue structure correlates with vascular normalization and plaque resolution. Scale bars = 1 mm.
Figures 3 (B) – (D) and (K) – (M) show both plaque scans segmented into three vascular slabs: 0 – 132 µm, 132 – 330 µm, and 330 – 924 µm, measured from the skin surface, closely representing vessels innervating the dermal-epidermal junction, papillary dermis, and reticular dermis, respectively. The active plaque (Figs. 3 (B) – (D)) demonstrates vascular density and distribution changes predominantly located in the second slab, the papillary dermis. Figures 3 (K) – (M) show resolution of these vascular changes. The plaque’s structural information was also segmented. The papillary dermis (Figs. 3 (H) and (Q)) shows the greatest variation between active disease and resolution, with highly organized structures thought to be aligned collagen fiber bundles orientated along the same plane as the superficial plexus. The voids between the bundles appear enlarged beneath the active plaque (Fig. 3 (H)), coinciding with a deposition in the deeper reticular dermis (Fig. 3 (I)), suspected to be increased dermal collagen production. Both features resolve in Figs. 3 (Q) and (R), respectively.
Cutaneous cGvHD
Cutaneous cGvHD occurs in approximately half of patients who undergo allogeneic hematopoietic stem cell transplantation34 and is typically assessed using histopathology35,36. Non-invasive imaging modalities, such as capillaroscopy, have been used to investigate cutaneous GvHD, with conflicting results37,38 deeming it unsuitable39. High frequency ultrasound technology has also been used, but results were mixed for skin thickness measurements40,41. A more robust imaging tool, such as OCTA, may be a more suitable candidate.
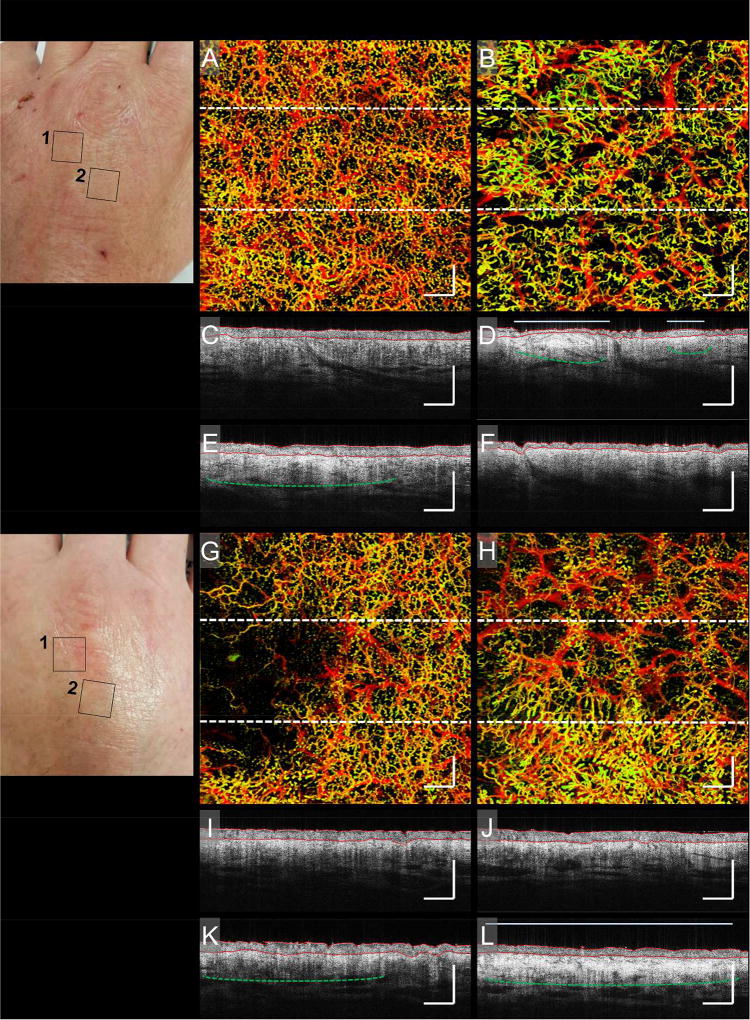
Figure 4 shows vasculatures in the hands of a cGvHD patient. Shown is a stark contrast in vascular features, such as density and distribution, between areas [1] and [2] on both hands, (A) vs. (B) and (G) vs. (H). Below each of the enface vascular images are B-scans corresponding to the perforated lines in each enface image. Figures 4 (C) and (E) show subtle structural differences correlating with variations in vascular density. The lower region has a denser vasculature and a correspondingly bright structure beneath the dense vasculature (highlighted by the perforated green line in (E)). Figure 4 (B) shows a heterogeneous vessel distribution correlating with structural features identified in Figs. 4 (D) and (F). Figure 4 (D) shows two bright deposits immediately below the epidermis (highlighted by the green perforated lines in (D)). The larger deposit corresponds with a compressed epidermis and both deposits correspond with an increased dermal reflectivity, which has been linked with epidermal hyperplasia and dermal edema42,43 (highlighted by the red and light blue lines, respectively, in (D)). All three features correlate with subtle changes in vascular distribution. Figure 4 (G) shows decreased vessel density to one side. Figure 4 (K) shows increased brightness correlating with vessel density changes (highlighted by the perforated green line in (K)). Figure 4 (H) shows significant vessel density and distribution differences between upper and lower regions. Increased vessel density correlates with increased structural brightness and dermal reflectivity (highlighted by the perforated green line and light blue line, respectively), seen in Fig. 4 (L).
Figure 4. cGvHD.
Photographs and corresponding enface vascular images and B-scans of a cutaneous cGvHD patient’s hands. The first photograph highlights two areas on the left hand, marked [1] and [2], identified for imaging. A and B) Enface vascular images corresponding to areas marked [1] and [2] on the left hand, respectively. C and E) Two B-scans corresponding to the upper and lower regions of (A); their locations highlighted by the corresponding perforated lines in (A). D and F) Two B-scans corresponding to the upper and lower regions of (B), respectively; their locations highlighted by the corresponding perforated lines in (B). The second photograph highlights two areas on the right hand, marked [1] and [2], identified for imaging. G and H) Enface vascular images corresponding to areas marked [1] and [2] on the right hand, respectively. I and K) Two B-scans corresponding to the upper and lower regions of (G), respectively; their locations highlighted by the corresponding perforated lines in (G). J and L) Two B-scans corresponding to the upper and lower regions of (H), respectively; their locations highlighted by the corresponding perforated lines in (H). On all B-scans, red lines highlight avascular epidermal boundaries, perforated green lines highlight enhanced structural brightness, and light blue lines highlight enhanced dermal reflectivity. In all cases, vasculatures correlated with strong structural features, such as enhanced brightness thought to be caused by collagen deposition, and enhanced dermal reflectivity thought to be associated with increased epidermal activity. Scale bars = 1 mm.
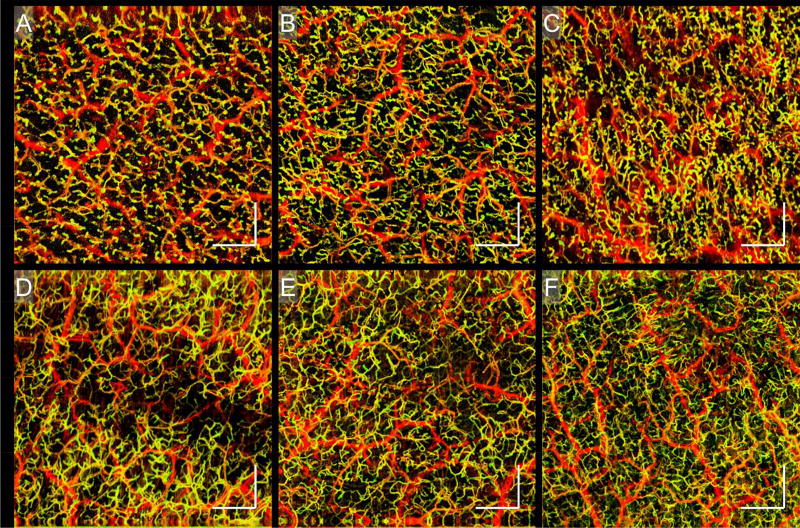
Similar findings were seen in the foot of another cGvHD patient (Fig. 5). Enface vascular images and B-scans show similar decreases in vessel density and structural features corroborating those of Fig. 4. Additionally, structural slabs show a bright deposition correlating with the vascular void. Complementary to those is an additional vascular feature observed at three different anatomic sites on a separate cGvHD patient (Fig. 6). Figures 6 (A) – (C) show numerous yellow dots, which are small circular vascular outpouchings resembling microaneurysms. This phenomenon is absent in equivalent sites of healthy skin (Figs. 6 (D) – (F)).
Figure 6. cGvHD.
Enface vascular images displaying microaneurysms in the skin of a cutaneous cGvHD patient. A – C) Enface vascular images showing the presence of microaneurysms on the left thigh, the left calf, and the right forearm, respectively. D – F) Enface vascular images of the skin of healthy individuals taken at sites corresponding to those mentioned in (A) – (C), respectively. The microaneurysms noted with the cGvHD patient were not seen with healthy subjects. Scale bars = 1 mm.
Systemic sclerosis (SS)
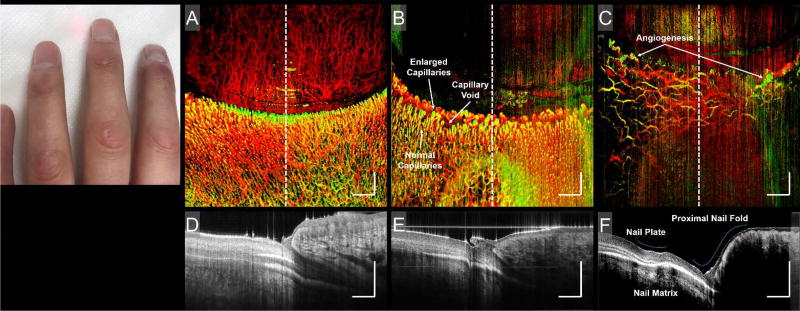
In systemic disease where vascular damage is a pathological factor, microcirculatory abnormalities often precede clinical symptoms, reflecting the involvement of internal organs44. Cutaneous manifestations of systemic sclerosis (SS or scleroderma) are commonly associated with microvascular changes in the skin, previously visualized with capillaroscopy45,46. Microvascular injury is thought to precede the development of fibrotic tissue in SS39. Figure 7 compares the proximal nail folds of a healthy individual and a patient with SS. Figures 7 (B) and (C) highlight vascular abnormalities commonly associated with SS, and whilst each vascular abnormality may be present in SS at any one time, they appear and evolve in a clearly defined sequence called the “scleroderma pattern”47. Typically, enlarged capillaries and small capillary voids (Fig. 7 (B)) are early and active stage indicators, respectively, and angiogenic capillaries (Fig. 7 (C)) are late stage indicators47. Additionally, cross-sectional structural images, Figs. 7 (D) – (F), correspond to the perforated lines in (A) – (C), respectively. The middle finger, Figs. 7 (B) and (E), shows little structural deformation other than an enlarged cuticle48. The index finger, Figs. 7 (C) and (F), shows abnormalities in the nail plate, nail matrix, and proximal nail fold.
Figure 7. Scleroderma.
Photograph and corresponding enface vascular images and B-scans of sclerodermatous nail folds. The photograph shows the fingers of a scleroderma patient. Typical sclerodermatous features, such as tightening of the fingertips and joints, can be seen. A) An enface vascular image of a healthy nail fold. B) The middle finger of a scleroderma patient. C) The ring finger of a scleroderma patient. Vascular traits commonly associated with scleroderma, such as enlarged and/or angiogenic capillaries, and capillary voids, are identified. D) B-scan corresponding to the central region identified in (A); its location highlighted by the corresponding perforated line in (A). E) B-scan corresponding to the central region identified in (B); its location highlighted by the corresponding perforated line in (B). F) B-scan corresponding to the central region identified in (C); its location highlighted by the corresponding perforated line in (C). Highlighted in (F) are abnormal nail unit features, i.e. the acute nail/proximal nail fold angle, a ridge in the nail plate, and a brighter-than-normal nail matrix. Scale bars = 1 mm.
Discussion
In healthy skin absent of lesions, vascular distribution appears homogenous, corroborating with previous OCT studies28,49; however, in the presence of benign lesions, capillary loops form symmetrical annular networks that mirror topological structures. The dermal location of these capillary networks is inferred by dermal layer thickening, as seen in B-scan structural images. In inflammatory skin conditions, such as psoriasis and cGvHD, we saw an increased vascular density at active sites, potentially reflecting vessel recruitment and increased metabolic demand during inflammation. The role of microvasculature in psoriasis was noted by Braverman et al.50,51, who visualized dilated capillaries with bridged fenestrations (leaky endothelial gaps) in psoriatic lesions. Additionally, the leaky endothelial gaps resolved with treatment, preceding clinical resolution of the plaques51. Here, we demonstrated the normalization of tortuous capillary loops coinciding with resolution of a psoriatic plaque. A future investigation should ask whether such microvascular changes precede epidermal hyperplasia or visible manifestations.
Monitoring of cGvHD progression has been proven difficult with numerous techniques; however, OCTA offers an opportunity to monitor both the microvascular and structural alterations associated with this disease. We can potentially identify those who need immunosuppression and those who do not. In SS, we have shown similar findings to that of capillaroscopy52,53, identifying enlarged capillary loops or microaneurysms and capillary voids. These findings are clinically relevant as they are thought to precede clinical symptoms and point to the potential involvement of visceral organs in SS. Further investigation into the relationship between these microvascular changes and clinical findings is warranted. As OCTA can also determine dermal thickness, it may be of potential use, not only for monitoring disease progression and severity in SS, but also cutaneous morphea/localized scleroderma.
Although not demonstrated here, functional information, such as blood flow rate, can also be provided by OCTA54. A number of studies have used OCT to measure vessel diameter and density55,56, tortuosity57, and others, further adding to the appeal of OCTA technology for use in a wide variety of clinical and research settings.
Whilst the focus of this study has been primarily centered around elucidating the potential benefits of OCTA for clinical dermatology, the study itself and the technology used are not without room for refinement. The study was designed to introduce a state-of-the-art, but continually evolving technology; therefore, the data presented here is preliminary. It is acknowledged that a larger cohort and supplementary analyses would be needed should solid conclusions be drawn. Additionally, the technology used is a prototype intended for research purposes. Should a more permanent position be found for this technology in a clinical setting, additional efforts would have to be placed on augmenting portability and ease of use. How data is extracted and presented would also require further work. Data processing and image acquisition is currently a post-scanning, multi-step process; however, an end goal would be to streamline procedures to the point where clinicians could make accurate, real time assessments simply, without compromising on detail or volume of gatherable information.
In conclusion, to our knowledge few technologies allow simultaneous in vivo 3D microvascular and structural imaging. The data gathered in this study demonstrate with different pathologies, specific microvascular changes that occur, which are relevant to the progression and resolution of the disease. OCTA technology within a clinical or research setting may prove beneficial in elucidating the relationship between microvascular alterations and pathology.
Acknowledgments
Funding sources: The National Heart, Lung, and Blood Institute (R01 HL093140), the National Eye Institute (R01 EY024158) and the National Cancer Institute (R01 CA118953, P01 CA18029).
Footnotes
Disclosure: None declared
References
- 1.Braverman IM. The Cutaneous Microcirculation. J. Investig. Dermatol. Symp. Proc. 2000;5:3–9. doi: 10.1046/j.1087-0024.2000.00010.x. [DOI] [PubMed] [Google Scholar]
- 2.Braverman IM, Schechner JS. Contour Mapping of the Cutaneous Microvasculature by Computerized Laser Doppler Velocimetry. J. Invest. Dermatol. 1991;97:1013–1018. doi: 10.1111/1523-1747.ep12492255. [DOI] [PubMed] [Google Scholar]
- 3.Braverman IM. The cutaneous microcirculation: ultrastructure and microanatomical organization. Microcirc. N. Y. N 1994. 1997;4:329–340. doi: 10.3109/10739689709146797. [DOI] [PubMed] [Google Scholar]
- 4.Albrecht HP, et al. Microcirculatory functions in systemic sclerosis: additional parameters for therapeutic concepts? J. Invest. Dermatol. 1993;101:211–215. doi: 10.1111/1523-1747.ep12363834. [DOI] [PubMed] [Google Scholar]
- 5.Chang E, Yang J, Nagavarapu U, Herron GS. Aging and survival of cutaneous microvasculature. J. Invest. Dermatol. 2002;118:752–758. doi: 10.1046/j.1523-1747.2002.01714.x. [DOI] [PubMed] [Google Scholar]
- 6.Heidenreich R, Röcken M, Ghoreschi K. Angiogenesis drives psoriasis pathogenesis. Int. J. Exp. Pathol. 2009;90:232–248. doi: 10.1111/j.1365-2613.2009.00669.x. [DOI] [PMC free article] [PubMed] [Google Scholar]
- 7.Domsic RT, et al. Endothelial dysfunction is present only in the microvasculature and microcirculation of early diffuse systemic sclerosis patients. Clin.. Exp. Rheumatol. 2014;32:S-154–160. [PMC free article] [PubMed] [Google Scholar]
- 8.De Carvalho N, et al. In vivo micro-angiography by means of speckle-variance optical coherence tomography (SV-OCT) is able to detect microscopic vascular changes in naevus to melanoma transition. J. Eur. Acad. Dermatol. Venereol. 2016;30:e67–e68. doi: 10.1111/jdv.13311. [DOI] [PubMed] [Google Scholar]
- 9.Marcoval J, et al. Angiogenesis and malignant melanoma. Angiogenesis is related to the development of vertical (tumorigenic) growth phase. J. Cutan. Pathol. 1997;24:212–218. doi: 10.1111/j.1600-0560.1997.tb01583.x. [DOI] [PubMed] [Google Scholar]
- 10.Pattanaik D, Brown M, Postlethwaite AE. Vascular involvement in systemic sclerosis (scleroderma) J. Inflamm. Res. 2011;4:105–125. doi: 10.2147/JIR.S18145. [DOI] [PMC free article] [PubMed] [Google Scholar]
- 11.Treu CM, Lupi O, Bottino DA, Bouskela E. Sidestream dark field imaging: the evolution of real-time visualization of cutaneous microcirculation and its potential application in dermatology. Arch. Dermatol. Res. 2011;303:69–78. doi: 10.1007/s00403-010-1087-7. [DOI] [PubMed] [Google Scholar]
- 12.Wang RK. Optical Microangiography: A Label Free 3D Imaging Technology to Visualize and Quantify Blood Circulations within Tissue Beds in vivo. IEEE J. Sel. Top. Quantum Electron. Publ. IEEE Lasers Electro-Opt. Soc. 2010;16:545–554. doi: 10.1109/JSTQE.2009.2033609. [DOI] [PMC free article] [PubMed] [Google Scholar]
- 13.Chen C-L, Wang RK. Optical coherence tomography based angiography [Invited] Biomed. Opt. Express. 2017;8:1056–1082. doi: 10.1364/BOE.8.001056. [DOI] [PMC free article] [PubMed] [Google Scholar]
- 14.Huang D, et al. Optical coherence tomography. Science. 1991;254:1178–1181. doi: 10.1126/science.1957169. [DOI] [PMC free article] [PubMed] [Google Scholar]
- 15.Tomlins PH, Wang RK. Theory, developments and applications of optical coherence tomography. J. Phys. Appl. Phys. 2005;38:2519. [Google Scholar]
- 16.Song S, Xu J, Men S, Shen TT, Wang RK. Robust numerical phase stabilization for long-range swept-source optical coherence tomography. J. Biophotonics. 2017 doi: 10.1002/jbio.201700034. [DOI] [PMC free article] [PubMed] [Google Scholar]
- 17.Wang RK, An L, Francis P, Wilson DJ. Depth-resolved imaging of capillary networks in retina and choroid using ultrahigh sensitive optical microangiography. Opt. Lett. 2010;35:1467–1469. doi: 10.1364/OL.35.001467. [DOI] [PMC free article] [PubMed] [Google Scholar]
- 18.Yin X, Chao JR, Wang RK. User-guided segmentation for volumetric retinal optical coherence tomography images. J. Biomed. Opt. 2014;19 doi: 10.1117/1.JBO.19.8.086020. [DOI] [PMC free article] [PubMed] [Google Scholar]
- 19.Esmaeili M, Dehnavi AM, Rabbani H. 3D Curvelet-Based Segmentation and Quantification of Drusen in Optical Coherence Tomography Images. J. Electr. Comput. Eng. 2017;2017:e4362603. [Google Scholar]
- 20.Mazzaferri J, Beaton L, Hounye G, Sayah DN, Costantino S. Open-source algorithm for automatic choroid segmentation of OCT volume reconstructions. Sci. Rep. 2017;7:42112. doi: 10.1038/srep42112. [DOI] [PMC free article] [PubMed] [Google Scholar]
- 21.Qin J, Jiang J, An L, Gareau D, Wang RK. In vivo volumetric imaging of microcirculation within human skin under psoriatic conditions using optical microangiography. Lasers Surg. Med. 2011;43:122–129. doi: 10.1002/lsm.20977. [DOI] [PMC free article] [PubMed] [Google Scholar]
- 22.Hori Y, et al. Automatic characterization and segmentation of human skin using three-dimensional optical coherence tomography. Opt. Express. 2006;14:1862–1877. doi: 10.1364/oe.14.001862. [DOI] [PubMed] [Google Scholar]
- 23.Baran U, et al. Automated segmentation and enhancement of optical coherence tomography-acquired images of rodent brain. J. Neurosci. Methods. 2016;270:132–137. doi: 10.1016/j.jneumeth.2016.06.014. [DOI] [PMC free article] [PubMed] [Google Scholar]
- 24.Ulrich M, et al. Dynamic Optical Coherence Tomography in Dermatology. Dermatol. Basel Switz. 2016;232:298–311. doi: 10.1159/000444706. [DOI] [PubMed] [Google Scholar]
- 25.Sandby-Møller J, Poulsen T, Wulf HC. Epidermal thickness at different body sites: relationship to age, gender, pigmentation, blood content, skin type and smoking habits. Acta Derm. Venereol. 2003;83:410–413. doi: 10.1080/00015550310015419. [DOI] [PubMed] [Google Scholar]
- 26.Robertson K, Rees JL. Variation in epidermal morphology in human skin at different body sites as measured by reflectance confocal microscopy. Acta Derm. Venereol. 2010;90:368–373. doi: 10.2340/00015555-0875. [DOI] [PubMed] [Google Scholar]
- 27.Vestergaard ME, Macaskill P, Holt PE, Menzies SW. Dermoscopy compared with naked eye examination for the diagnosis of primary melanoma: a meta-analysis of studies performed in a clinical setting. Br. J. Dermatol. 2008;159:669–676. doi: 10.1111/j.1365-2133.2008.08713.x. [DOI] [PubMed] [Google Scholar]
- 28.Kwon S, et al. Dermoscopy guided dark-field multi-functional optical coherence tomography. Biomed. Opt. Express. 2017;8:1372–1381. doi: 10.1364/BOE.8.001372. [DOI] [PMC free article] [PubMed] [Google Scholar]
- 29.Pfeiffer S, et al. High-pressure freezing provides new information on human epidermis: simultaneous protein antigen and lamellar lipid structure preservation. Study on human epidermis by cryoimmobilization. J. Invest. Dermatol. 2000;114:1030–1038. doi: 10.1046/j.1523-1747.2000.00966.x. [DOI] [PubMed] [Google Scholar]
- 30.Alper M, et al. Measurement of epidermal thickness in a patient with psoriasis by computer-supported image analysis. Braz. J. Med. Biol. Res. 2004;37:111–117. doi: 10.1590/s0100-879x2004000100015. [DOI] [PubMed] [Google Scholar]
- 31.Kim J, et al. Histological Stratification of Thick and Thin Plaque Psoriasis Explores Molecular Phenotypes with Clinical Implications. PLOS ONE. 2015;10:e0132454. doi: 10.1371/journal.pone.0132454. [DOI] [PMC free article] [PubMed] [Google Scholar]
- 32.Babalola O, Mamalis A, Lev-Tov H, Jagdeo J. Optical Coherence Tomography (OCT) of Collagen in Normal Skin and Skin Fibrosis. Arch. Dermatol. Res. 2014;306:1–9. doi: 10.1007/s00403-013-1417-7. [DOI] [PMC free article] [PubMed] [Google Scholar]
- 33.Morsy H, et al. Optical coherence tomography imaging of psoriasis vulgaris: correlation with histology and disease severity. Arch. Dermatol. Res. 2010;302:105–111. doi: 10.1007/s00403-009-1000-4. [DOI] [PubMed] [Google Scholar]
- 34.Mielcarek M, et al. Graft-versus-host disease after nonmyeloablative versus conventional hematopoietic stem cell transplantation. Blood. 2003;102:756–762. doi: 10.1182/blood-2002-08-2628. [DOI] [PubMed] [Google Scholar]
- 35.Hillen U, et al. Consensus on performing skin biopsies, laboratory workup, evaluation of tissue samples and reporting of the results in patients with suspected cutaneous graft-versus-host disease. J. Eur. Acad. Dermatol. Venereol. JEADV. 2015;29:948–954. doi: 10.1111/jdv.12737. [DOI] [PubMed] [Google Scholar]
- 36.Fischer A, et al. Histopathologic Features of Cutaneous Acute Graft-Versus-Host Disease in T-Cell-Depleted Peripheral Blood Stem Cell Transplant Recipients. Am. J. Dermatopathol. 2015;37:523–529. doi: 10.1097/DAD.0000000000000357. [DOI] [PMC free article] [PubMed] [Google Scholar]
- 37.Akay BN, Sanli H, Topcuoglu P, Arat M, Akyol A. Nailfold capillary abnormalities are prevalent in sclerodermoid graft-versus-host disease and readily detected with dermatoscopy. Br. J. Dermatol. 2010;162:1076–1082. doi: 10.1111/j.1365-2133.2010.09667.x. [DOI] [PubMed] [Google Scholar]
- 38.Barausse G, et al. Clinical, serologic and instrumental data of ten patients affected by sclerodermatous chronic graft versus host disease: similarities and differences in respect to systemic sclerosis. Int. J. Immunopathol. Pharmacol. 2010;23:373–377. doi: 10.1177/039463201002300139. [DOI] [PubMed] [Google Scholar]
- 39.Hofstee HMA, et al. Nailfold capillary abnormalities in sclerodermatous chronic GVHD. Bone Marrow Transplant. 2013;48:1574–1577. doi: 10.1038/bmt.2013.106. [DOI] [PubMed] [Google Scholar]
- 40.Gottlöber P, et al. Chronic cutaneous sclerodermoid graft-versus-host disease: evaluation by 20-MHz sonography. J. Eur. Acad. Dermatol. Venereol. JEADV. 2003;17:402–407. doi: 10.1046/j.1468-3083.2003.00516.x. [DOI] [PubMed] [Google Scholar]
- 41.Osmola-Mańkowska A, et al. Assessment of chronic sclerodermoid Graft-versus-Host Disease patients, using 20MHz high-frequency ultrasonography and cutometer methods. Skin. Res. Technol. 2013;19:e417–e422. doi: 10.1111/j.1600-0846.2012.00659.x. [DOI] [PubMed] [Google Scholar]
- 42.Hymes SR, Turner ML, Champlin RE, Couriel DR. Cutaneous Manifestations of Chronic Graft-versus-Host Disease. Biol. Blood Marrow Transplant. 2006;12:1101–1113. doi: 10.1016/j.bbmt.2006.08.043. [DOI] [PubMed] [Google Scholar]
- 43.Phillips KG, et al. Dermal reflectivity determined by optical coherence tomography is an indicator of epidermal hyperplasia and dermal edema within inflamed skin. J. Biomed. Opt. 2011;16:040503. doi: 10.1117/1.3567082. [DOI] [PMC free article] [PubMed] [Google Scholar]
- 44.Herrick AL, Cutolo M. Clinical implications from capillaroscopic analysis in patients with Raynaud’s phenomenon and systemic sclerosis. Arthritis Rheum. 2010;62:2595–2604. doi: 10.1002/art.27543. [DOI] [PubMed] [Google Scholar]
- 45.Anderson ME, et al. Computerized nailfold video capillaroscopy--a new tool for assessment of Raynaud’s phenomenon. J. Rheumatol. 2005;32:841–848. [PubMed] [Google Scholar]
- 46.Meli M, Gitzelmann G, Koppensteiner R, Amann-Vesti BR. Predictive value of nailfold capillaroscopy in patients with Raynaud’s phenomenon. Clin. Rheumatol. 2006;25:153–158. doi: 10.1007/s10067-005-1146-1. [DOI] [PubMed] [Google Scholar]
- 47.Chojnowski MM, Felis-Giemza A, Olesińska M. Capillaroscopy – a role in modern rheumatology. Reumatologia. 2006;54:67–72. doi: 10.5114/reum.2016.60215. [DOI] [PMC free article] [PubMed] [Google Scholar]
- 48.Elmansour I, Chiheb S, Benchikhi H. Nail changes in connective tissue diseases: a study of 39 cases. Pan Afr. Med. J. 2014;18 doi: 10.11604/pamj.2014.18.150.4637. [DOI] [PMC free article] [PubMed] [Google Scholar]
- 49.Blatter C, et al. In situ structural and microangiographic assessment of human skin lesions with high-speed OCT. Biomed. Opt. Express. 2012;3:2636–2646. doi: 10.1364/BOE.3.002636. [DOI] [PMC free article] [PubMed] [Google Scholar]
- 50.Braverman IM, Sibley J. Role of the Microcirculation in the Treatment and Pathogenesis of Psoriasis. J. Invest. Dermatol. 1982;78:12–17. doi: 10.1111/1523-1747.ep12497850. [DOI] [PubMed] [Google Scholar]
- 51.Braverman IM, Sibley J. The response of psoriatic epidermis and microvessels to treatment with topical steroids and oral methotrexate. J. Invest. Dermatol. 1985;85:584–586. doi: 10.1111/1523-1747.ep12283604. [DOI] [PubMed] [Google Scholar]
- 52.Graceffa D, et al. Capillaroscopy in Psoriatic and Rheumatoid Arthritis: A Useful Tool for Differential Diagnosis. Arthritis. 2013;2013:e957480. doi: 10.1155/2013/957480. [DOI] [PMC free article] [PubMed] [Google Scholar]
- 53.Ring HC, Themstrup L, Banzhaf CA, Jemec GBE, Mogensen M. Dynamic Optical Coherence Tomography Capillaroscopy: A New Imaging Tool in Autoimmune Connective Tissue Disease. JAMA Dermatol. 2016;152 doi: 10.1001/jamadermatol.2016.2027. [DOI] [PubMed] [Google Scholar]
- 54.Yousefi S, Qin J, Wang RK. Super-resolution spectral estimation of optical micro-angiography for quantifying blood flow within microcirculatory tissue beds in vivo. Biomed. Opt. Express. 2013;4:1214–1228. doi: 10.1364/BOE.4.001214. [DOI] [PMC free article] [PubMed] [Google Scholar]
- 55.Bhaduri B, et al. Detection of retinal blood vessel changes in multiple sclerosis with optical coherence tomography. Biomed. Opt. Express. 2016;7:2321–2330. doi: 10.1364/BOE.7.002321. [DOI] [PMC free article] [PubMed] [Google Scholar]
- 56.Mastropasqua R, et al. Optical coherence tomography angiography microvascular findings in macular edema due to central and branch retinal vein occlusions. Sci. Rep. 2017;7:srep40763. doi: 10.1038/srep40763. [DOI] [PMC free article] [PubMed] [Google Scholar]
- 57.Lee H, Lee M, Chung H, Kim HC. Quantification Of Retinal Vessel Tortuosity In Diabetic Retinopathy Using Optical Coherence Tomography Angiography. Retina. 2017 doi: 10.1097/IAE.0000000000001618. Publish Ahead of Print. [DOI] [PubMed] [Google Scholar]


