Abstract
Clinical assessment of right ventricular (RV) contractility in diseases such as pulmonary arterial hypertension (PAH) has been hindered by the lack of a robust methodology. Here, a novel, clinically viable, single-beat method was developed to assess end-systolic elastance (Ees), a measure of right ventricular (RV) contractility. We hypothesized that this novel approach reduces uncertainty and interobserver variability in the estimation of the maximum isovolumic pressure (Piso), the key step in single-beat methods. The new method was designed to include a larger portion of the RV pressure data and minimize subjective adjustments by the operator. Data were obtained from right heart catheterization of PAH patients in a multicenter prospective study (data set 1) and a single-center retrospective study (data set 2). To obtain Piso, three independent observers used an established single-beat method (based on the first derivative of the pressure waveform) and the novel method (based on the second derivative). Interobserver variability analysis included paired t-test, one-way ANOVA, interclass correlation (ICC) analysis, and a modified Bland-Altman analysis. The Piso values obtained from the two methods were linearly correlated for both data set 1 (R2 = 0.74) and data set 2 (R2 = 0.91). Compared with the established method, the novel method resulted in smaller interobserver variability (P < 0.001), nonsignificant differences between observers, and a narrower confidence interval. By reducing uncertainty and interobserved variability, this novel approach may pave the way for more effective clinical management of PAH.
NEW & NOTEWORTHY A novel methodology to assess right ventricular contractility from clinical data is demonstrated. This approach significantly reduces interobserver variability in the analysis of ventricular pressure data, as demonstrated in a relatively large population of subjects with pulmonary hypertension. This study may enable more accurate clinical monitoring of systolic function in subjects with pulmonary hypertension.
Keywords: end-systolic elastance, pulmonary arterial hypertension, right ventricle, single-beat method, ventricular contractility
INTRODUCTION
Right ventricular (RV) contractility has been recognized as an essential metric of RV function, especially for monitoring the progression of pulmonary arterial hypertension (PAH) (9, 18). However, assessment of RV contractility was not included in the latest clinical guidelines for PAH diagnosis and treatment, likely because of the lack of a robust, clinically viable procedure (8).
Several metrics have been proposed as accurate measures of ventricular contractility (7, 12). Among those, the slope of the end-systolic pressure-volume relationship (ESPVR), also known as end-systolic elastance (Ees), has been extensively used for both ventricles in preclinical and clinical research. It is generally accepted that the most accurate way to estimate Ees requires the acquisition of simultaneous ventricular pressure and volume data over multiple heartbeats while the ventricular preload is altered (1). Because of the need for invasive inferior vena cava occlusion (IVCO) to alter preload, the use of the multiple-beat method has been limited to animal studies, with very few applications in clinical research (2, 5, 16).
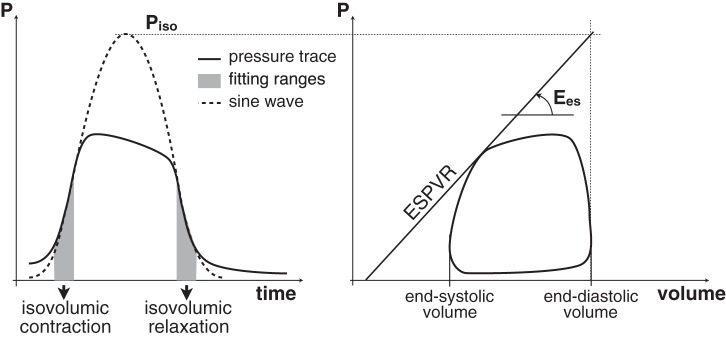
To overcome the need for IVCO, clinically viable single-beat methods were originally developed to assess Ees in the left ventricle and were later adapted to the RV (4). The most widely used version of the single-beat method is based on the interpolation of the isovolumic contraction and relaxation ranges of the pressure waveform with a sine function. The peak value of the sine function, Piso, is the maximum pressure that can be reached by an isovolumic heartbeat and is used to identify the ESPVR, as shown in Fig. 1. The single-beat method has been extensively used to assess RV contractility in both preclinical (13, 21, 23, 32) and clinical research (14, 17, 22, 24–26, 30, 31). Recently, it has been shown that estimates of hemodynamic coupling efficiency based on the single-beat method predicted mortality in PAH (31).
Fig. 1.
Illustration of the single-beat method for the calculation of Ees.
Currently, the available single-beat methods use only about half of the isovolumic portions of the pressure waveform, which is problematic in the RV because the isovolumic periods are already shorter than in the left ventricle (15). In addition, manual adjustments by the operator may be necessary to improve the fitting of the interpolating sine wave. Narrower fitting ranges and manual adjustments increase the uncertainty in Piso estimates. Here, a novel, clinically viable approach to determine the fitting ranges for evaluating Piso in the RV is proposed. This method is based on the evaluation of the second derivative of the RV pressure waveform. We hypothesize that this semiautomatic method results in reduced interobserver variability compared with the manually corrected method based on the first derivative.
METHODS
Study Population and Design
Clinical RV pressure data collected at two different sites were analyzed. The first data set was collected in a multicenter prospective study (data set 1). Subjects with diagnosed or suspected PAH underwent right heart catheterization (RHC) at Northwestern Memorial Hospital (Chicago, IL) or University of Wisconsin Hospital (Madison, WI). All subjects gave written, informed consent. The study was compliant with the Health Insurance Portability and Accountability Act (HIPAA) and approved by the institutional review boards of both institutions.
The second data set was obtained from a single-center retrospective study conducted at the Scottish Pulmonary Vascular Unit, in Glasgow, UK (data set 2). The data set included 128 subjects who underwent RHC between January 2004 and April 2014. RHC studies were performed either for routine clinical evaluation, or as part of an ongoing longitudinal research cardiovascular magnetic resonance program that was approved by institutional review committee and to which patients gave written, informed consent.
Cardiac Catheterization Study
Data set 1.
The RHC was performed from the internal jugular vein approach under fluoroscopic guidance. RV pressure traces were obtained using a high-fidelity solid-state micromanometer-tipped catheter (Millar Instruments, Houston, TX) at a sampling rate of 1 kHz. RV pressure was collected over 10–30 heartbeats and analyzed using custom routines developed in LabVIEW 2013 (National Instruments, Austin, TX).
Data set 2.
RHC was performed using a 7F triple-channel thermodilution Swan Ganz catheter (Baxter Healthcare, Irvine, CA) introduced via internal jugular vein or femoral vein under fluoroscopic guidance. RV pressures traces were available over 5–10 heartbeats and were manually redigitized using GetData Graph Digitizer 2.26. Subsequent data analysis was performed using the same custom routines used for data set 1.
The Single-Beat Method
The single-beat method is based on two fundamental observations reported in pioneering studies by Suga and Sagawa (27, 28). First, during isovolumic contraction and relaxation the RV pressure signal can be modeled as a sinusoidal wave. During systole, opening of the pulmonary valve lowers RV pressure and disrupts the simple harmonic shape of the signal. In fact, if blood ejection is prevented, RV volume would be constantly equal to the end-diastolic volume (EDV) and the entire RV pressure signal in the resulting isovolumic beat would exhibit a sinusoidal shape (20, 29). Second, the maximum RV pressure-to-volume ratio (occurring close to end systole and referred to as end-systolic elastance, Ees) is independent of afterload. This means that Ees measured during an isovolumic beat is also representative of the RV contractility in a normally ejecting beat. Building on these observations, the single-beat method postulates that the peak value (Piso) of a sine wave interpolating the isovolumic range can be combined with EDV to estimate one point of the ESPVR. From that, the slope Ees can be obtained as shown in Fig. 1 without the need for IVCO as in the multiple-beat method.
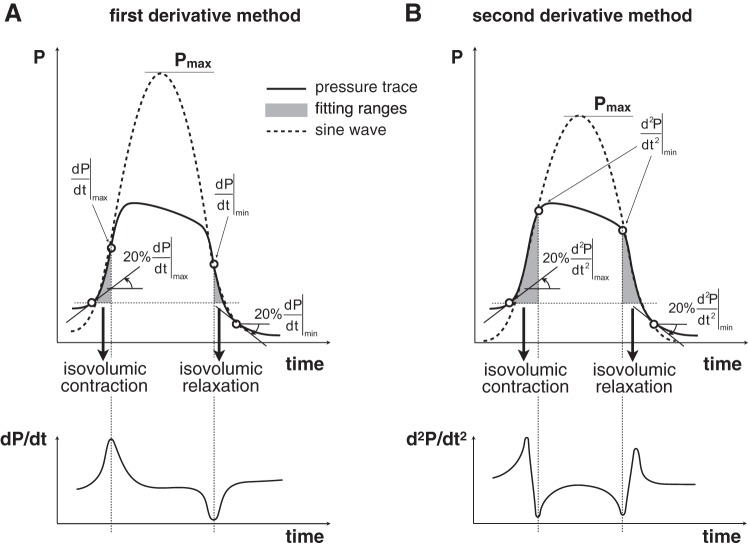
Implementations of the single-beat method use features of the RV pressure waveform to select isovolumic ranges required for the sine wave interpolation. The isovolumic contraction (IC) portion of the pressure waveform includes a point of local maximum for the first derivative of the pressure signal (dP/dt). Similarly, the isovolumic relaxation (IR) portion includes a point of local minimum for dP/dt. The locations of these extreme values of dP/dt are highlighted in Fig. 2A. During a normal ejecting beat, the RV pressure deviates from the sinusoidal shape as ejection begins, and remains lower than the ideal periodic curve while the pulmonic valve stays open. As a result, the pressure waveform exhibits two local minima for the second derivative in proximity of the opening and closing of the pulmonic valve, corresponding to the two sharp changes in slope highlighted in Fig. 2B.
Fig. 2.
Illustration of the fitting range determination and interpolation using the first derivative approach (A) and second derivative method (B).
In this study, the first derivative approach was implemented as illustrated in Fig. 2A. The fitting contraction range was set from the onset of IC to the point of maximum dP/dt, whereas the fitting relaxation range was set from the point of minimum dP/dt to the end of IR, as prescribed (4). The onset of the IC (end of the IR) was set at 20% of the maximum (minimum) dP/dt. The fitting ranges were interpolated using a sine wave to estimate Piso. Per commonly used protocol, a trained observer visually checked the quality of the interpolation and had the option to manually correct the limits of the fitting ranges to revise the estimate of Piso.
In the second derivative method, the end of the fitting contraction range and onset of fitting relaxation range were set as minimum points of the second derivative of the pressure waveform (Fig. 2B). In practice, the second derivative of the RV pressure waveform may exhibit multiple local minima in each isovolumic period; therefore, a trained observer selected the minimum points that ensured the best fit of the pressure waveform in these ranges. Figure 3 illustrates a representative example of multiple minima of the second derivative, obtained from a subject with PAH associated with connective tissue disease. The interpolation of the RV pressure trace included in Fig. 3 is based on minima that were selected by all three independent observers.
Fig. 3.
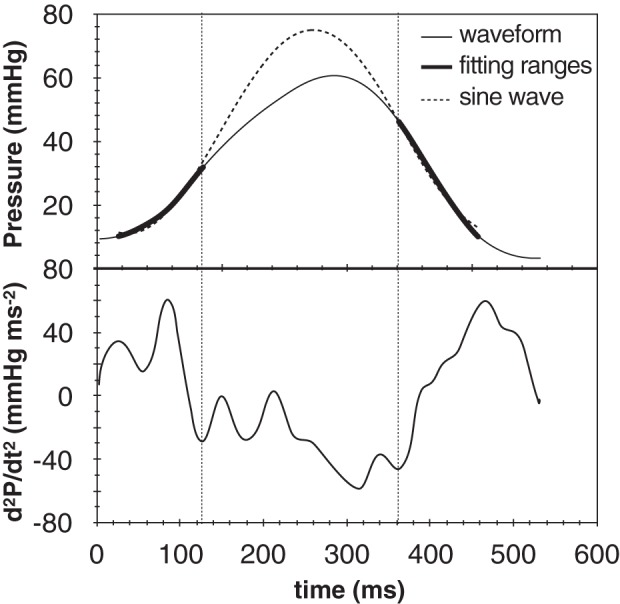
Example RV pressure trace, whose second derivative exhibited multiple minima. The same minima were selected by all 3 independent observers, as they resulted in the best interpolation of the isovolumic ranges.
The onset of the IC and end of the IR were set at 20% of the minimum points of the first derivative. Preliminary analysis suggested that the method is generally usable with any cutoff value between 5% and 40%. However, it was noted that in some cases the more inclusive cutoffs (i.e., closer to 5%) may add data that are not part of the isovolumic ranges and thus result in poorer interpolations. On the other hand, the less inclusive cutoffs (i.e., closer to 40%) limit the number of data points used for the interpolation, which may affect the robustness of the method. The value of 20% was chosen as a trade-off between these two situations. Preliminary data indicated that the variability in Piso, resulting from choosing 10% or 30% instead of 20%, would be no greater than 2.5%.
Statistical Analysis
Beat-averaged pressure waveforms were smoothed with a standard low-pass filter and subsequently analyzed using the two different methods described in the previous section. For data set 1, one group of three observers (B1, B2, B3) analyzed the data using both the standard approach based on the first derivative of the pressure waveform, and the novel approach based on the second derivative. For data set 2, one group of three observers (F1, F2, F3) analyzed the data using the standard approach based on the first derivative of the pressure waveform. Another group of three observers (S1, S2, S3) used the novel approach based on the second derivative. All observers received training in the single-beat algorithm and appropriate criteria for revising estimates of Piso.
All results are presented as means ± standard error of the mean (SE). Correlations between mean values (averaged for the 3 observers) of the two methods were investigated using Pearson’s correlation coefficient. Interobserver variability was investigated performing 1) a paired Student’s t-test to compare the SE of the two methods, 2) a one-way ANOVA to analyze the differences among the observers, 3) an interclass correlation (ICC) analysis (2-way mixed model with absolute agreement), and 4) a modified Bland-Altman analysis designed to assess the 95% limits of agreement with the mean among multiple (N > 2) observers (10). The post hoc analysis (following the 1-way ANOVA) was performed using Tukey’s honestly significant differences test. Statistical analyses were performed with SPSS (IBM, Somers, NY; version 22.0) and Excel 2016 (Microsoft, Redmond, WA; version 15.24). A P value < 0.001 was considered evidence of statistical significance.
RESULTS
The study group for data set 1 included 24 subjects (14 women, age 54 ± 2 yr, range 26–74 yr). The final diagnosis was PAH for 21 subjects. Mean pulmonary artery pressure was 43.0 ± 17.3 mmHg for the PAH subjects, and 22.7 ± 1.7 mmHg for the subjects without PAH.
Data set 2 included 131 RV pressure traces from 128 subjects (79 women, age 57 ± 1 yr, range 18–84 yr). The three additional traces were obtained during posttreatment reassessment of two subjects. The final diagnosis was PAH for 106 subjects (82.8%). Patient characteristics are presented in Table 1, grouped by diagnosis.
Table 1.
Demographics, diagnosis, and hemodynamic data of subjects included in data set 1 (n = 24) and data set 2 (n = 128)
| Data Set 1 | Data Set 2 | |
|---|---|---|
| Age, yr | 53 ± 2 | 57 ± 1 |
| Sex, % (n) | ||
| Male | 42 (10) | 38 (49) |
| Female | 58 (14) | 62 (79) |
| BSA | 1.93 ± 0.06 | 1.80 ± 0.02 |
| Diagnosis, % (n) | ||
| No PH | 8.3 (2) | 17.2 (22) |
| IPAH | 25.0 (6) | 41.4 (53) |
| CTD-PAH | 41.7 (10) | 21.1 (27) |
| POPH | 3.1 (4) | |
| CHD-PAH | 0.8 (1) | |
| HLDPH | 16.4 (21) | |
| CTEPH | 20.8 (5) | |
| PVH | 4.2 (1) | |
| mPAP, mmHg | 41.5 ± 2.9 | 42.0 ± 1.5 |
| CO, l/min | 6.0 ± 0.4 | 4.2 ± 0.1 |
| PVR, Wood units | 5.3 ± 0.7 | 9.8 ± 1.6 |
Values are means ± SE. BSA, body surface area; PH, pulmonary hypertension; PAH, pulmonary arterial hypertension; IPAH, idiopathic PAH; CTD-PAH, PAH associated with connective tissue disease; POPH, portopulmonary hypertension; CHD-PAH, PAH associated with congenital heart disease; HLDPH, PH associated with hypoxic lung disease (group III PH); CTEPH, chronic thromboembolic PH; PVH, pulmonary venous hypertension; mPAP, mean pulmonary artery pressure; CO, cardiac output; PVR, pulmonary vascular resistance.
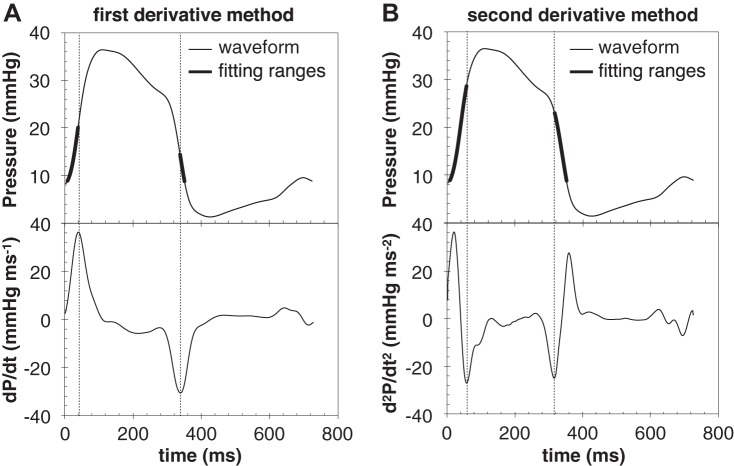
Figure 4 presents the results of both methods for one representative case. The subject was a male patient, age 55 yr, with a diagnosis of PAH associated with systemic sclerosis from data set 1. In this case maximum and minimum of dP/dt are located at about half height of IC and IR, respectively (Fig. 4A). In comparison, the two minima of the second derivative are located closer to the end of the IC and beginning of IR, respectively (Fig. 4B). As a result, both fitting ranges selected in the second derivative method include a larger portion of the isovolumic interval compared with the first derivative method.
Fig. 4.
Representative analysis of the RV pressure signal collected from a 55 yr-old male subject with PAH associated with systemic sclerosis, using the first derivative approach (A) and second derivative method (B).
The values of Piso estimated from the two methods for all subjects in both data sets are compared in Fig. 5. For each method, values averaged for the three observers are reported. The horizontal error bars represent the SE of the first derivative Piso values, whereas the vertical error bars are for the second derivative method. For both data sets, the two methods were linearly correlated (slope m = 0.70, R2 = 0.74 for data set 1; m = 0.77, R2 = 0.91 for data set 2). If the intercept of the linear correlation was forced to zero, the slope was 0.83 for data set 1 (R2 = 0.71) and 0.84 for data set 2 (R2 = 0.90). It is clear that the second derivative method produced Piso values consistently lower than the first derivative method. For data set 1, the ratio between Piso from the second and the first derivative method was 0.87 ± 0.03, and the 13% gap was significant (P < 0.001). For data set 2, the ratio between Piso from the second and the first derivative method was 0.87 ± 0.01, and the 13% gap was significant (P < 0.001).
Fig. 5.
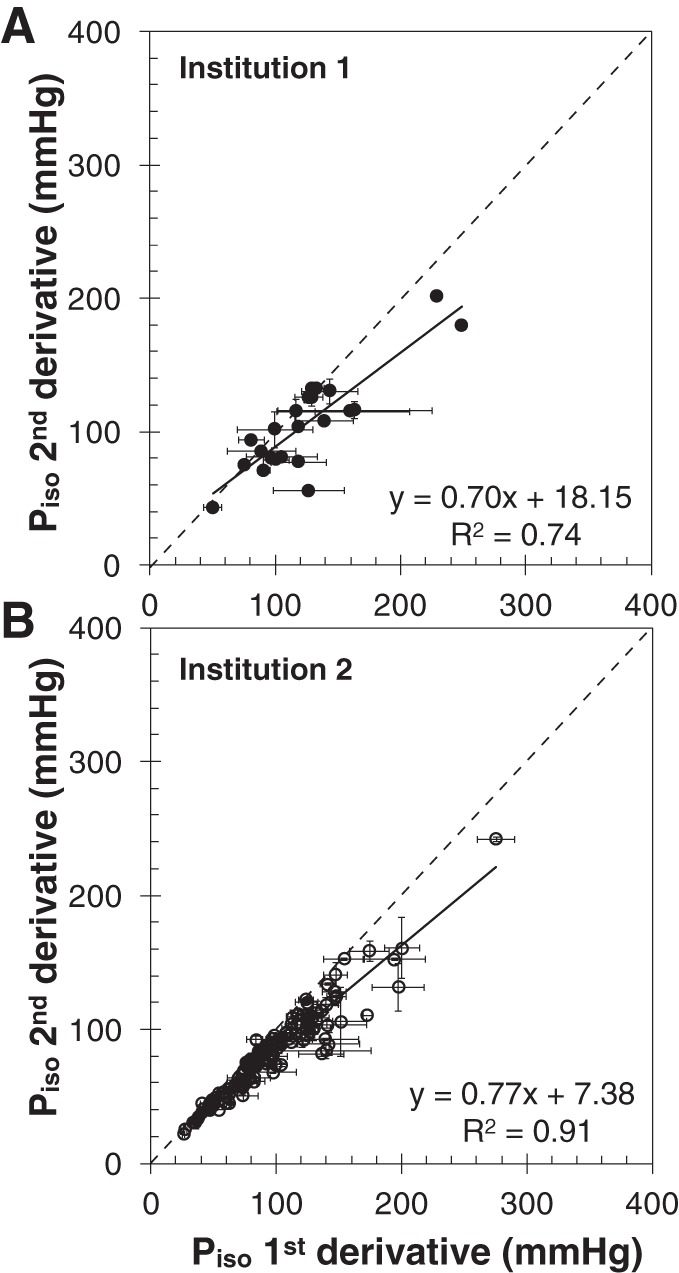
Comparison of Piso from the two methods, for data set 1 (A) and data set 2 (B). The error bars indicate the SD of the data obtained from different observers.
The error bars in Fig. 5 indicate that the first derivative method results in a greater interobserver variability. In particular, the mean value of the SE (averaged for all subjects) using the first derivative method was 15.1 ± 16.1 mmHg for data set 1. In comparison, the average SE was significantly lower with the second derivative method (2.5 ± 3.6 mmHg, P < 0.001). Similar results were observed for data set 2 when comparing the average SE obtained with the first derivative method (6.7 ± 6.5 mmHg) and the second derivative method (2.6 ± 3.9 mmHg, P < 0.001).
A comparison among observers for either method is reported in Fig. 6 for data set 2. For the first derivative method, there was a significant difference between F2 and F3 (P = 0.001). No significant differences among observers were found for the second derivative method. The ICC coefficient (a measure of the reliability of multiple observers using continuous variables) was comparable between the first derivative method (0.947, CI 0.892–0.970) and the second derivative method (0.980, CI 0.973–0.985).
Fig. 6.
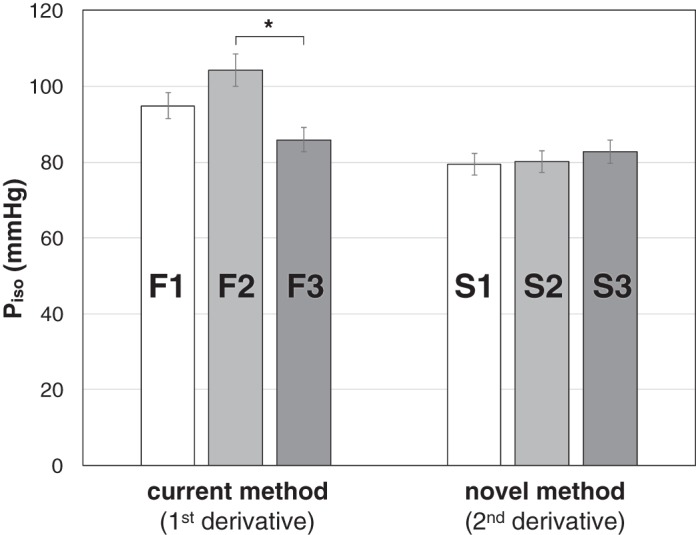
Results of the one-way ANOVA performed on data set 2 using the current (first derivative) and novel (second derivative) single-beat method. The analysis indicated significant interobserver differences for the first derivative method (observers F1–F3), in contrast to the second derivative method (observers S1–S3).
The interobserver agreement was also investigated using a modified Bland-Altman analysis, suitable for more than two observers. In contrast with the original method, the modified Bland-Altman analysis assesses the limits of agreement with the mean, and thus the bias is always zero (10). The results for data set 2 are reported in Fig. 7. The 95% confidence interval limits are ±25.8 mmHg for the first derivative method, and ±12.9 mmHg for the second derivative method.
Fig. 7.
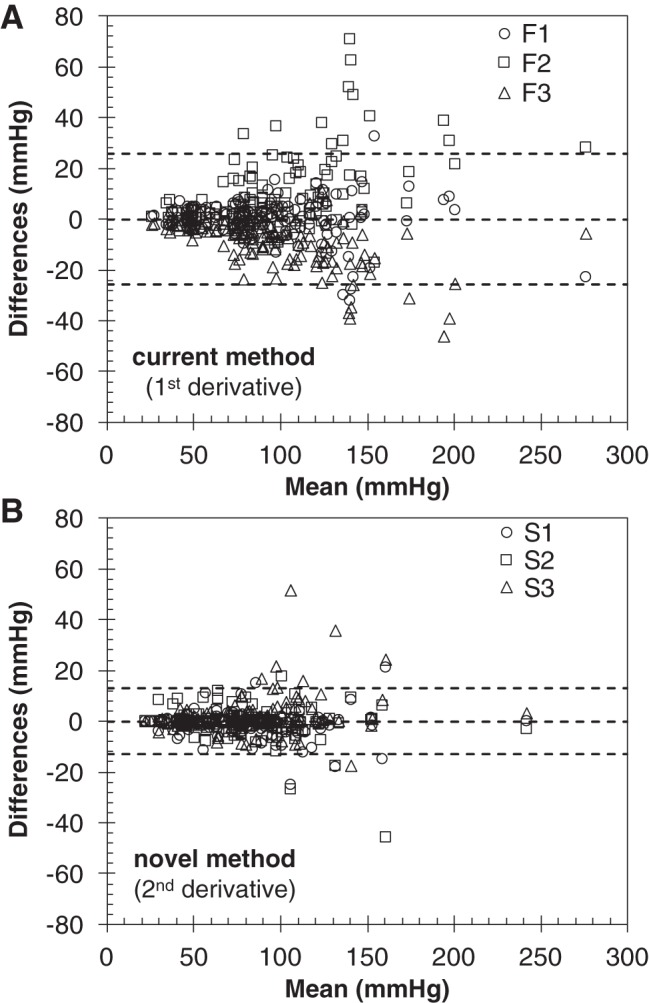
Interobserver agreement based on a modified Bland-Altman analysis of data set 2, for the current (first derivative; A) and novel (second derivative; B) single-beat method. The dashed lines indicate the limits of agreement with the mean (95% confidence intervals), which were narrower for the novel (second derivative) method.
DISCUSSION
We developed a novel approach to assess RV contractility using clinical RHC data from a single heartbeat. The main finding of this study is that the novel method produces results consistent with the established single-beat method, while reducing the uncertainty of the fitting algorithm and improving the interobserver agreement. This result was possible because the second derivative method was designed to 1) use a larger portion of the isovolumic periods for the sine wave interpolation, and 2) limit manual adjustments by the operator to a discrete set of choices (corresponding to the minima of the second derivative of the pressure waveform).
Single-beat approaches to estimating Ees in the setting of PAH have attracted considerable attention from researchers, but so far have come short of appealing to clinicians. One major reason is the difficulty validating results against the gold standard, highly invasive multiple-beat method, which in humans remains impractical. However, this shortcoming has been partly mitigated by the increasing evidence that single-beat estimates of RV contractility correlate with PAH progression and outcome (31). Another important reason that single-beat methods have not been more extensively used in the clinical management of PAH is the lack of a robust, observer-independent algorithm for the assessment of the theoretical maximum isovolumic pressure, Piso. Estimation of Piso is based on a nonlinear fitting of the two isovolumic portions of the RV pressure waveform. In the established single-beat method introduced by Brimioulle et al. (4), the limits of both fitting ranges are determined using routines based on the estimation of the first derivative of the RV pressure waveform.
Two major factors limit the robustness of the first derivative approach. First, the method uses only a portion of the actual isovolumic intervals, which may increase the uncertainty in the estimation of Piso particularly in the RV, where the isovolumic intervals are already much shorter than in the left ventricle (15). Second, the automatic first derivative routine can produce unsatisfactory results, particularly in the presence of noisy data or strongly asymmetric waveforms. In these cases, visual inspection of the fitting curve may lead to manual adjustments of the fitting ranges. The subjectivity of these corrections, combined with the limited number of data points used for the interpolation, may result in large interobserver and intraobserver variability in the values of Piso.
The novel method proposed here uses the minima of the second derivative of the RV pressure waveform to determine the limits of the isovolumic ranges. In this study, we confirmed the presence of two marked minima in the second derivative, one near the end of the isovolumic contraction, the other near the beginning of the isovolumic relaxation. By taking these points as the limits of the fitting ranges, our method used significantly larger portions of the isovolumic ranges for the nonlinear fitting routine, which resulted in reduced uncertainty in the estimate of Piso.
Furthermore, our second derivative method allows for a kind of manual correction that is substantially different from the first derivative method. Our novel method postulates the existence of at least two minima in the second derivative of the RV pressure (one for each isovolumic period), but in reality the waveform may exhibit more than two minima. Therefore, the observer can visually inspect the waveform and select the points of minima that ensure the best fitting of the isovolumic ranges. This is a key difference between the established and the novel method. In the first derivative, the operator can adjust the fitting over a continuous range of values. In contrast, the adjustments allowed in our novel method are limited to choosing from a discrete set of options (the points of minimum of the second derivative), which increases the likelihood that different operators may select the same adjustment.
It is important to point out that the second derivative method generated Piso values that were strongly correlated with the results of the first derivative method, as confirmed in both data sets. Also, the novel second derivative method consistently underestimated the established first derivative method by 13%. Whether the novel method is more accurate than the established one is beyond the scope of this study, since assessing the “true” Piso would require RV pressure data acquired during complete clamping of the PA. However, it is interesting to point out that, according to the original study by Brimioulle et al. (4), the first derivative method overestimated the values of Piso observed during an actual isovolumic beat (obtained via PA clamping) by ~15%.
This study has a number of limitations. Data set 1 included a small number of subjects, and thus was excluded from ANOVA, ICC analysis, and modified Bland-Altman analysis. Data set 2 was obtained from a retrospective study and included PAH subjects with varied etiology and medical treatment. However, the results of our analysis appeared to be consistent across different etiologies. The first and second derivative analyses for data set 2 were performed by two different groups of three observers, which may be in part responsible for the differences observed between the two methods. However, for each method the observers had received the same training to use the single-beat algorithms and instructed to adjust the available parameters (continuous for the first derivative methods, discrete for the second derivative method) to optimize fitting. In addition, the same group of three observers (B1, B2, B3) used both methods to analyze data set 1, and the findings were not dissimilar from data set 2. Our analysis was limited to the assessment of maximum isovolumic pressure, which in the single-beat method is the key step to estimate Ees. Finally, we did not compare either method to the gold-standard, multiple-beat method. Lack of full validation of the single-beat method in human subjects remains an unsolved issue, which will require development of clinically viable procedures for obtaining multiple pressure-volume loops at varying preload. It must be noted that the methods discussed in this paper for estimating ventricular contractility (both single-beat and multibeat methods) are all based on the assumption that the slope of the ESPVR is essentially independent of afterload. This assumption has come into question in recent years, especially in studies of the left ventricle (3, 6). It has also been reported that the effect of this dependence may be relatively small (6). Whether afterload independence is a good assumption in the right ventricle is unclear at this point, and more research is necessary to clarify that. Nevertheless, single-beat and multibeat methods are still considered the standard for animal and clinical research (18, 30).
Conclusions
In this study, we demonstrated a novel method to assess ventricular contractility that may be more suitable to the right ventricle. This approach, based on the second derivative of the right ventricular pressure waveform, significantly reduced the uncertainty and interobserver variability of the single-beat method, which may enable a wider adoption of this methodology as a monitoring tool in the clinical management of pulmonary arterial hypertension.
GRANTS
We gratefully acknowledge funding support from National Heart, Lung, and Blood Institute Grant 1R-01-HL-105598 (N. C. Chesler).
DISCLOSURES
No conflicts of interest, financial or otherwise, are declared by the authors.
AUTHOR CONTRIBUTIONS
A.B. and N.C.C. conceived and designed research; A.B. and M.J.B. performed experiments; A.B., R.V., and M.J.B. analyzed data; A.B. and N.C.C. interpreted results of experiments; A.B. prepared figures; A.B. and N.C.C. drafted manuscript; A.B., M.J.B., A.J.P., and N.C.C. edited and revised manuscript; A.B., R.V., M.J.B., A.J.P., and N.C.C. approved final version of manuscript.
ACKNOWLEDGMENTS
We thank all the personnel of the Catheterization Laboratories at the Univ. of Wisconsin-Madison and Scottish Pulmonary Vascular Unit for support with patient recruitment and for efforts in the collection of data.
REFERENCES
- 1.Bellofiore A, Chesler NC. Methods for measuring right ventricular function and hemodynamic coupling with the pulmonary vasculature. Ann Biomed Eng 41: 1384–1398, 2013. doi: 10.1007/s10439-013-0752-3. [DOI] [PMC free article] [PubMed] [Google Scholar]
- 2.Bishop A, White P, Oldershaw P, Chaturvedi R, Brookes C, Redington A. Clinical application of the conductance catheter technique in the adult human right ventricle Int J Cardiol 58: 211–221, 1997. doi: 10.1016/S0167-5273(96)02880-X. [DOI] [PubMed] [Google Scholar]
- 3.Blaudszun G, Morel DR. Relevance of the volume-axis intercept, V0, compared with the slope of end-systolic pressure-volume relationship in response to large variations in inotropy and afterload in rats. Exp Physiol 96: 1179–1195, 2011. doi: 10.1113/expphysiol.2011.059881. [DOI] [PubMed] [Google Scholar]
- 4.Brimioulle S, Wauthy P, Ewalenko P, Rondelet B, Vermeulen F, Kerbaul F, Naeije R. Single-beat estimation of right ventricular end-systolic pressure-volume relationship. Am J Physiol Heart Circ Physiol 284: H1625–H1630, 2003. doi: 10.1152/ajpheart.01023.2002. [DOI] [PubMed] [Google Scholar]
- 5.Brown KA, Ditchey RV. Human right ventricular end-systolic pressure-volume relation defined by maximal elastance Circulation 78: 81–91, 1988. doi: 10.1161/01.CIR.78.1.81. [DOI] [PubMed] [Google Scholar]
- 6.Burkhoff D, Mirsky I, Suga H. Assessment of systolic and diastolic ventricular properties via pressure-volume analysis: a guide for clinical, translational, and basic researchers. Am J Physiol Heart Circ Physiol 289: H501–H512, 2005. doi: 10.1152/ajpheart.00138.2005. [DOI] [PubMed] [Google Scholar]
- 7.Dickstein ML, Yano O, Spotnitz HM, Burkhoff D. Assessment of right ventricular contractile state with the conductance catheter technique in the pig Cardiovasc Res 29: 820–826, 1995. doi: 10.1016/S0008-6363(96)88618-4. [DOI] [PubMed] [Google Scholar]
- 8.Galiè N, Humbert M, Vachiery J-L, Gibbs S, Lang I, Torbicki A, Simonneau G, Peacock A, Vonk Noordegraaf A, Beghetti M, Ghofrani A, Gomez Sanchez MA, Hansmann G, Klepetko W, Lancellotti P, Matucci M, McDonagh T, Pierard LA, Trindade PT, Zompatori M, Hoeper M, Aboyans V, Vaz Carneiro A, Achenbach S, Agewall S, Allanore Y, Asteggiano R, Paolo Badano L, Albert Barberà J, Bouvaist H, Bueno H, Byrne RA, Carerj S, Castro G, Erol Ç, Falk V, Funck-Brentano C, Gorenflo M, Granton J, Iung B, Kiely DG, Kirchhof P, Kjellstrom B, Landmesser U, Lekakis J, Lionis C, Lip GY, Orfanos SE, Park MH, Piepoli MF, Ponikowski P, Revel MP, Rigau D, Rosenkranz S, Völler H, Luis Zamorano J. 2015 ESC/ERS Guidelines for the diagnosis and treatment of pulmonary hypertension. The Joint Task Force for the Diagnosis and Treatment of Pulmonary Hypertension of the European Society of Cardiology (ESC) and the European Respiratory Society (ERS). Endorsed by Association for European Paediatric and Congenital Cardiology (AEPC), International Society for Heart and Lung Transplantation (ISHLT). Eur Heart J 37: 67–119, 2016. doi: 10.1093/eurheartj/ehv317. [DOI] [PubMed] [Google Scholar]
- 9.Handoko ML, de Man FS, Allaart CP, Paulus WJ, Westerhof N, Vonk-Noordegraaf A. Perspectives on novel therapeutic strategies for right heart failure in pulmonary arterial hypertension: lessons from the left heart. Eur Respir Rev 19: 72–82, 2010. doi: 10.1183/09059180.00007109. [DOI] [PMC free article] [PubMed] [Google Scholar]
- 10.Jones M, Dobson A, O’Brian S. A graphical method for assessing agreement with the mean between multiple observers using continuous measures. Int J Epidemiol 40: 1308–1313, 2011. doi: 10.1093/ije/dyr109. [DOI] [PubMed] [Google Scholar]
- 12.Karunanithi MK, Michniewicz J, Copeland SE, Feneley MP. Right ventricular preload recruitable stroke work, end-systolic pressure-volume, and dP/dtmax-end-diastolic volume relations compared as indexes of right ventricular contractile performance in conscious dogs Circ Res 70: 1169–1179, 1992. doi: 10.1161/01.RES.70.6.1169. [DOI] [PubMed] [Google Scholar]
- 13.Kerbaul F, Brimioulle S, Rondelet B, Dewachter C, Hubloue I, Naeije R. How prostacyclin improves cardiac output in right heart failure in conjunction with pulmonary hypertension. Am J Respir Crit Care Med 175: 846–850, 2007. doi: 10.1164/rccm.200611-1615OC. [DOI] [PubMed] [Google Scholar]
- 14.Kuehne T, Yilmaz S, Steendijk P, Moore P, Groenink M, Saaed M, Weber O, Higgins CB, Ewert P, Fleck E, Nagel E, Schulze-Neick I, Lange P. Magnetic resonance imaging analysis of right ventricular pressure-volume loops: in vivo validation and clinical application in patients with pulmonary hypertension. Circulation 110: 2010–2016, 2004. doi: 10.1161/01.CIR.0000143138.02493.DD. [DOI] [PubMed] [Google Scholar]
- 15.Lambermont B, Segers P, Ghuysen A, Tchana-Sato V, Morimont P, Dogné J-M, Kolh P, Gérard P, D’Orio V. Comparison between single-beat and multiple-beat methods for estimation of right ventricular contractility. Crit Care Med 32: 1886–1890, 2004. doi: 10.1097/01.CCM.0000139607.38497.8A. [DOI] [PubMed] [Google Scholar]
- 16.Latus H, Binder W, Kerst G, Hofbeck M, Sieverding L, Apitz C. Right ventricular-pulmonary arterial coupling in patients after repair of tetralogy of Fallot. J Thorac Cardiovasc Surg 146: 1366–1372, 2013. doi: 10.1016/j.jtcvs.2013.02.039. [DOI] [PubMed] [Google Scholar]
- 17.Murch SD, La Gerche A, Roberts TJ, Prior DL, MacIsaac AI, Burns AT. Abnormal right ventricular relaxation in pulmonary hypertension. Pulm Circ 5: 370–375, 2015. doi: 10.1086/681268. [DOI] [PMC free article] [PubMed] [Google Scholar]
- 18.Naeije R, Brimioulle S, Dewachter L. Biomechanics of the right ventricle in health and disease (2013 Grover Conference series). Pulm Circ 4: 395–406, 2014. doi: 10.1086/677354. [DOI] [PMC free article] [PubMed] [Google Scholar]
- 20.Overbeek MJ, Lankhaar J-W, Westerhof N, Voskuyl AE, Boonstra A, Bronzwaer JGF, Marques KMJ, Smit EF, Dijkmans BAC, Vonk-Noordegraaf A. Right ventricular contractility in systemic sclerosis-associated and idiopathic pulmonary arterial hypertension. Eur Respir J 31: 1160–1166, 2008. doi: 10.1183/09031936.00135407. [DOI] [PubMed] [Google Scholar]
- 21.Pagnamenta A, Dewachter C, McEntee K, Fesler P, Brimioulle S, Naeije R. Early right ventriculo-arterial uncoupling in borderline pulmonary hypertension on experimental heart failure. J Appl Physiol (1985) 109: 1080–1085, 2010. doi: 10.1152/japplphysiol.00467.2010. [DOI] [PubMed] [Google Scholar]
- 22.Rain S, Handoko ML, Trip P, Gan CT-J, Westerhof N, Stienen GJ, Paulus WJ, Ottenheijm CAC, Marcus JT, Dorfmüller P, Guignabert C, Humbert M, Macdonald P, Dos Remedios C, Postmus PE, Saripalli C, Hidalgo CG, Granzier HL, Vonk-Noordegraaf A, van der Velden J, de Man FS. Right ventricular diastolic impairment in patients with pulmonary arterial hypertension. Circulation 128: 2016–2025, 2013. doi: 10.1161/CIRCULATIONAHA.113.001873. [DOI] [PubMed] [Google Scholar]
- 23.Rondelet B, Dewachter L, Kerbaul F, Dewachter C, Hubloue I, Fesler P, Franck S, Remmelink M, Brimioulle S, Naeije R. Sildenafil added to sitaxsentan in overcirculation-induced pulmonary arterial hypertension. Am J Physiol Heart Circ Physiol 299: H1118–H1123, 2010. doi: 10.1152/ajpheart.00418.2010. [DOI] [PubMed] [Google Scholar]
- 24.Sanz J, García-Alvarez A, Fernández-Friera L, Nair A, Mirelis JG, Sawit ST, Pinney S, Fuster V. Right ventriculo-arterial coupling in pulmonary hypertension: a magnetic resonance study. Heart 98: 238–243, 2012. doi: 10.1136/heartjnl-2011-300462. [DOI] [PubMed] [Google Scholar]
- 25.Schmitt B, Steendijk P, Lunze K, Ovroutski S, Falkenberg J, Rahmanzadeh P, Maarouf N, Ewert P, Berger F, Kuehne T. Integrated assessment of diastolic and systolic ventricular function using diagnostic cardiac magnetic resonance catheterization: validation in pigs and application in a clinical pilot study. JACC Cardiovasc Imaging 2: 1271–1281, 2009. doi: 10.1016/j.jcmg.2009.09.007. [DOI] [PubMed] [Google Scholar]
- 26.Spruijt OA, de Man FS, Groepenhoff H, Oosterveer F, Westerhof N, Vonk-Noordegraaf A, Bogaard H-J. The effects of exercise on right ventricular contractility and right ventricular-arterial coupling in pulmonary hypertension. Am J Respir Crit Care Med 191: 1050–1057, 2015. doi: 10.1164/rccm.201412-2271OC. [DOI] [PubMed] [Google Scholar]
- 27.Suga H, Sagawa K. Instantaneous pressure-volume relationships and their ratio in the excised, supported canine left ventricle Circ Res 35: 117–126, 1974. doi: 10.1161/01.RES.35.1.117. [DOI] [PubMed] [Google Scholar]
- 28.Suga H, Sagawa K, Shoukas AA. Load independence of the instantaneous pressure-volume ratio of the canine left ventricle and effects of epinephrine and heart rate on the ratio Circ Res 32: 314–322, 1973. doi: 10.1161/01.RES.32.3.314. [DOI] [PubMed] [Google Scholar]
- 29.Sunagawa K, Yamada A, Senda Y, Kikuchi Y, Nakamura M, Shibahara T, Nose Y. Estimation of the hydromotive source pressure from ejecting beats of the left ventricle. IEEE Trans Biomed Eng 27: 299–305, 1980. doi: 10.1109/TBME.1980.326737. [DOI] [PubMed] [Google Scholar]
- 30.Trip P, Kind T, van de Veerdonk MC, Marcus JT, de Man FS, Westerhof N, Vonk-Noordegraaf A. Accurate assessment of load-independent right ventricular systolic function in patients with pulmonary hypertension. J Heart Lung Transplant 32: 50–55, 2013. doi: 10.1016/j.healun.2012.09.022. [DOI] [PubMed] [Google Scholar]
- 31.Vanderpool RR, Pinsky MR, Naeije R, Deible C, Kosaraju V, Bunner C, Mathier MA, Lacomis J, Champion HC, Simon MA. RV-pulmonary arterial coupling predicts outcome in patients referred for pulmonary hypertension. Heart 101: 37–43, 2015. doi: 10.1136/heartjnl-2014-306142. [DOI] [PMC free article] [PubMed] [Google Scholar]
- 32.Wauthy P, Pagnamenta A, Vassalli F, Naeije R, Brimioulle S. Right ventricular adaptation to pulmonary hypertension: an interspecies comparison. Am J Physiol Heart Circ Physiol 286: H1441–H1447, 2004. doi: 10.1152/ajpheart.00640.2003. [DOI] [PubMed] [Google Scholar]


