

Abstract
Cardiovascular diseases (CVDs) are prevalent in the US, and many forms of CVD primarily affect the mechanical aspects of heart function. Wearable technologies for monitoring the mechanical health of the heart and vasculature could enable proactive management of CVDs through titration of care based on physiological status as well as preventative wellness monitoring to help promote lifestyle choices that reduce the overall risk of developing CVDs. Additionally, such wearable technologies could be used to optimize human performance in austere environments. This review describes our progress in developing wearable ballistocardiogram (BCG)- and seismocardiogram-based systems for monitoring relative changes in cardiac output, contractility, and blood pressure. Our systems use miniature, low-noise accelerometers to measure the movements of the body in response to the heartbeat and novel machine learning algorithms to provide robustness against motion artifacts and sensor misplacement. Moreover, we have mathematically related wearable BCG signals—representing local, cardiogenic movements of a point on the body—to better understood whole body BCG signals, and thereby improved estimation of key health parameters. We validated these systems with experiments in healthy subjects, studies in patients with heart failure, and measurements in austere environments such as water immersion. The systems can be used in future work as a tool for clinicians and physiologists to measure the mechanical aspects of cardiovascular function outside of clinical settings, and to thereby titrate care for patients with CVDs, provide preventative screening, and optimize performance in austere environments by providing real-time in-depth information regarding performance and risk.
Keywords: ballistocardiography, heart failure, hemodynamic monitoring, wearable physiological sensors
INTRODUCTION
Wearable technologies for assessing the mechanical aspects of cardiovascular function can benefit myriad health and performance applications. Patients with cardiovascular diseases (CVDs) or disorders impacting the pumping function of the heart, such as heart failure (HF), could use wearable technologies at home to facilitate titration of care based on their changing needs, as is currently possible only with implantable devices (1, 11). Early detection of CVD risk, such as stiffening of the arteries (10, 78), could be enabled in a large population of users by enabling more frequent monitoring with wearable technology outside of clinical settings. Optimization of performance in austere environments, such as exercise in heat stress (62), could be achieved by wearable measurements of the mechanical aspects of heart function coupled with machine learning algorithms to derive person-specific measures of reserve (18). All of these applications require the accurate measurement of parameters such as cardiac output (CO), blood pressure (BP), cardiac contractility, and systemic vascular resistance (SVR).
Commercially available wearable technologies for cardiovascular monitoring are, unfortunately, limited mainly to measurements of cardiac electrophysiology [i.e., electrocardiogram (ECG) (20, 40)] and peripheral blood volume pulse [i.e., photoplethysmogram (PPG) (4, 57)], in forms such as chest straps, adhesive patches, smartwatches, and wristbands (83). These systems can provide estimates of heart rate, rhythm, and heart rate variability but cannot directly provide information regarding the mechanical health of the heart and vasculature. In the research domain, investigators have developed wearable physiological sensing systems for impedance cardiography (ICG) (50, 70) or finger cuff-based arterial BP measurement (30, 39). These systems do provide measurements of the mechanical health of the heart and vasculature, such as CO (16, 66), BP (49, 63), cardiac contractility (7, 56), and SVR (67), but the hardware is cumbersome, bulky, and expensive, thus precluding translation from the laboratory to clinical settings or the home.
Our group has investigated wearable measurement of the vibrations of the body in response to the heartbeat as a means of providing comprehensive assessment of the mechanical aspects of cardiovascular function in forms that are convenient, inexpensive, and suitable for use in the general population (13, 23, 75). Specifically, we have used miniature accelerometers to measure whole body movements [ballistocardiogram (BCG) (36, 64, 73)] and chest wall vibrations [seismocardiogram (SCG) (36, 37, 59)] and derived from these acceleration signals information related to relative changes in CO, BP, and cardiac contractility. This review describes the engineering challenges that were addressed and the human subject verification studies with the developed devices and identifies some additional applications for this emerging wearable technology.
ENGINEERING OF WEARABLE BCG AND SCG SYSTEMS
We have developed multimodal systems for wearable BCG and SCG sensing, with simultaneous measurement of ECG or PPG signals (13, 23). Prototypes of these two systems are shown in Fig. 1. One is a patch that mounts on the chest with three gel-based adhesive electrodes (Fig. 1A) (23). The patch measures ECG, SCG, movement (via an accelerometer), temperature, and barometric pressure (to calculate user’s altitude and thereby, for example, stairs climbed). All hardware is self-contained, including a microprocessor and associated circuitry required for storing the data locally on a micro secure digital (microSD) card. The battery life for the system is >48 h, and the mechanical packaging is water resistant, such that perspiration of the user does not damage the device. Even when placed on the upper back or other locations on the body besides the chest, the patch has sufficient sensitivity to measure wearable BCG vibrations in all three axes as well. The second system is worn on the wrist in the form of a watch and is used by placing the wrist against the sternum for the measurement (Fig. 1B) (13). This system is less mature and measures SCG (when placed against the chest) and includes reflectance PPG from the wrist. Only the sensing and front-end electronics hardware is contained on the device at this stage of development, and thus the device is tethered to a laptop computer for data acquisition. The purpose of the first system (patch) is to measure systolic time intervals such as the preejection period (PEP) and changes in CO (from the SCG signal) continuously from subjects and to place these measures of cardiovascular health in the context of stressors. The second system (watch) captures pulse transit time (PTT)—the time it takes for the arterial pulse to travel from a proximal location (aortic valve opening) to a distal location (pulse arrival at the wrist)—and from this PTT measurement and an initial calibration step calculates BP.
Fig. 1.

A: wearable patch for continuous seismocardiogram (or ballistocardiogram if placed on a location other than the sternum), electrocardiogram, temperature, and barometric pressure measurement. The patch mounts onto the chest with 3 adhesive-backed gel electrodes. Data are stored locally on the patch on a micro secure digital (microSD) card. B: wrist-worn device for measuring seismocardiogram (when placed against the chest by the user) and photoplethysmogram [from the inside of the wrist as shown by photo (inset) via an array of photodiodes and infrared light emitting diodes (LEDs)]. The wrist-worn device is in the earlier prototyping stages and thus provides an analog output that is stored on a separate laptop or other external device.
There have been several key challenges in wearable BCG and SCG measurement using algorithmic innovations: 1) wearable BCG measurements capture only local skin movements rather than whole body movements as measured on more traditional bed- or table-based BCG systems (43, 64), and thus the waveforms were processed to more closely resemble a standard BCG signal (75, 76); 2) motion artifacts that corrupt the BCG and SCG signals measured with wearable devices can compromise the accuracy of the extracted features from the signals, and thus dedicated algorithms for removing these artifacts were designed (37, 38); and 3) sensor misplacement on the chest can impact SCG measurements, and thus the differences between sensor location-based distortion of SCG waveforms and changes in the waveform due to underlying differences in cardiovascular mechanics were automatically detected (5). Details of the efforts to address these challenges are outlined below.
Interpretation of waveforms from wearable BCG measurements.
Previously, researchers had measured BCG signals with wearable accelerometers from different locations on the body such as the ear (27, 28), but the waveforms were interpreted analogously to whole body BCG signals measured with a table or bed while the morphology was quite different between the two modalities. We instead applied machine learning-based domain adaptation algorithms to simultaneously measure whole body and wearable BCG signal first to adapt the wearable BCG into a whole body measurement and second to interpret features of that “calibrated” measurement (Fig. 2A). When positioned on a BCG measurement table (64), bed (43), or weighing scale (31), the ejection of blood from the heart and movement of the blood through the vasculature result in the movements of the whole body that are captured by the measurement hardware (36, 41). The signal describing these movements is the BCG and is shown in Fig. 2B (second signal) together with a simultaneously obtained ECG (first signal). The BCG signal has several distinct peaks or waves (I, J, and K waves) that can be reproducibly obtained from nearly all subjects, including subjects with CVDs (32, 36). The most commonly studied axis of movement for BCG signals is the head-to-foot direction, although researchers have studied BCG measurements in all three axes in microgravity, where the body can freely float in all three directions (45, 46). When an accelerometer is placed on the body in terrestrial settings, for example on the upper arm or wrist, the accelerations in the head-to-foot direction can be measured and have been referred to as wearable BCG measurements in the literature (75). An example accelerometer-based wearable BCG signal from the lower back (in the head-to-foot direction) is shown in Fig. 2B (third signal).
Fig. 2.
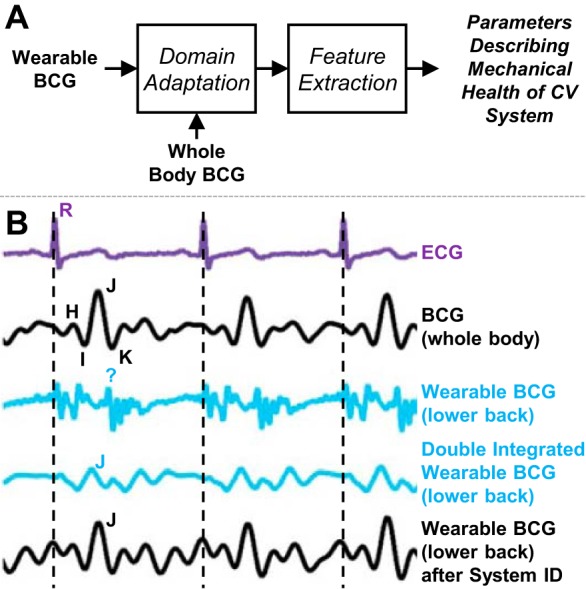
Overview of signal processing methodology applied to wearable ballistocardiogram (BCG) signals to improve the extraction of health-related parameters such as the preejection period (PEP) of the heart. A: block diagram depiction of domain adaptation approach employed by our group. Rather than extracting features directly from the wearable BCG waveform, which does not incorporate the same characteristics as a whole body BCG, this approach involves first transforming the wearable BCG with a simultaneously obtained whole body BCG and then extracting features from the transformed waveform. B: example signals obtained from 1 subject, including (in order from top to bottom) the electrocardiogram (ECG), the whole body BCG, the wearable BCG signal in the head-to-foot direction measured with an accelerometer placed on the subject’s back, the same wearable BCG signal after double integration (to convert acceleration to displacement, as measured with the whole body BCG device), and the wearable BCG after linear system identification-based adaptation. Bottom 2 signals more closely resemble the properties of the whole body BCG, including the characteristic waves (e.g., J wave) and timings of typical BCG signals. Thus, the information extracted from these signals is more in line with physiological expectations than for the wearable BCG signal itself.
We characterized these wearable BCG measurements with a miniature, instrumentation-grade accelerometer placed at multiple locations on the body and with reference standard measurements for optimizing the extracted physiological information (75–77). Next, several algorithms processed the wearable BCG signals to convert the wearable measurements to the better-understood whole body movement domain: double integration to convert acceleration waveforms to displacement (which is typically measured with bed or table systems) (75), linear system identification with a simultaneously obtained weighing scale-based whole body BCG (76), and person-specific band-pass filtering with a reference standard ICG obtained simultaneously (77). Such domain adaptation approaches have been successfully employed in other fields (17, 48) but not previously for wearable BCG signals. With these approaches the accuracy of wearable BCG-derived physiological parameters was improved substantially, specifically in the extraction of the aortic valve opening timing, which is a key element in assessing cardiac contractility [via PEP (42)] and cuffless BP estimation [via PTT (47)]. The waveforms that have been “calibrated” with these methods are shown as the fourth and fifth signals in Fig. 2B. The system identification-based approach yielded the best results, as shown in the fifth waveform in Fig. 2B, which was derived from the wearable BCG signal but very closely matches the simultaneously measured whole body BCG waveform. An improvement of nearly 3× was achieved with this approach in the estimation of the PEP compared with the standard approach of simply using features directly from the acceleration waveform itself.
Reduction of motion artifacts in wearable SCG signals.
Wearable SCG signals are typically measured on ambulant subjects, and thus the waveforms are susceptible to corruption by motion artifacts. Motion artifact reduction algorithms exist for similar waveforms such as the PPG but typically require the use of an auxiliary accelerometer to measure motion that can then be used together with the optical sensing to cancel out motion-related interferences in the PPG signal (26, 81). However, in the case of SCG measurements, the accelerometer itself is the sensor for the physiological measurement and thus cannot be readily used for both motion cancellation and physiological sensing in such algorithms. Our approach to removing artifacts relied on empirical mode decomposition (EMD) and feature tracking algorithms to provide robust estimation of aortic valve opening timing from SCG signals during walking at speeds up to 1.45 m/s (37). EMD is an analytical and adaptive method that decomposes a signal into multiple components, called intrinsic mode functions, and is designed specifically for nonstationary signals (29). Algorithms based on EMD have been used to remove baseline wander and other noise from the ECG waveform previously (9) and thus were a logical choice for denoising the BCG signal. Through EMD, the components of the SCG signal that were related to movement were sifted from the components related to heartbeats.
EMD improved SCG waveform morphology, and the improvement was then quantified with dynamic time warping (DTW) (58), an algorithm that quantifies the similarity between two waveforms while allowing for time shift and temporal dilation/contraction between them. A higher DTW distance between the SCG beats at rest and during walking for a given subject would indicate that motion artifacts had rendered the waveforms very dissimilar and thus the signal quality would be distorted; in contrast, a shorter DTW distance would indicate that motion artifacts were successfully reduced in the SCG signal during walking and the waveform shape was similar to that at rest. We found a significant reduction in DTW distance with EMD (P < 0.01) and concluded that the EMD-based denoising was effective. Moreover, we determined that the PEP could be estimated from ECG and SCG waveforms detected with our wearable device with low error [−8.1% to 12.5% limits of agreement (95% confidence)] during walking.
Automatic detection of sensor misplacement using machine learning algorithms.
We discovered that the placement of the accelerometer on the chest can affect the shape of SCG signals measured with the wearable hardware and thus designed machine learning algorithms to automatically detect sensor misplacement. Multiple features were extracted from SCG signals measured on healthy subjects in five different chest positions representing locations at which a user may accidentally misplace the hardware. We then labeled instances representing the correct position on the chest—deemed to be the midsternal position—and incorrect positions (all 4 other locations). A boosted J48 decision tree classifier with an Adaptive Boosting algorithm was trained on the testing set of the data and then tested on the remaining subjects in the testing set. The goal was to automatically determine sensor misplacement and to successfully differentiate changes in the signal associated with underlying physiological changes from those associated with sensor location. An overall precision of 0.83 and recall of 0.82 were achieved with our classifier. This performance would be sufficient to reduce the error in PEP estimation in unsupervised settings by >10 ms.
ELUCIDATING PHYSIOLOGICAL RELATIONSHIPS
With both the wearable measurement hardware described above and our previous weighing scale-based whole body BCG measurement systems, multiple human studies were conducted to elucidate relationships between BCG signal timings and amplitudes with other better-understood physiological parameters. The BCG reflects a series of mechanical movements of the body in response to cardiac ejection and blood movement through the peripheral vasculature (36, 64). Regardless of the measurement instrument, the primary movements are indicated by the BCG H, I, J, and K waves shown in Fig. 3A. The H and I waves coincide with aortic valve opening, and the J wave occurs at peak systole. The K wave is less reproducible but typically occurs in late systole, approximately at the time when the arterial pressure wave reaches the aortic bifurcation. The SCG, which is measured at the sternum, also contains reproducible waves, including the second positive (dorso-ventral) deflection, which represents aortic valve opening. A strictly mechanical derivation of these waves, using either fundamental dynamics equations and/or computational fluid dynamics, is an active area of investigation (41, 72) and is beyond the scope of this review.
Fig. 3.
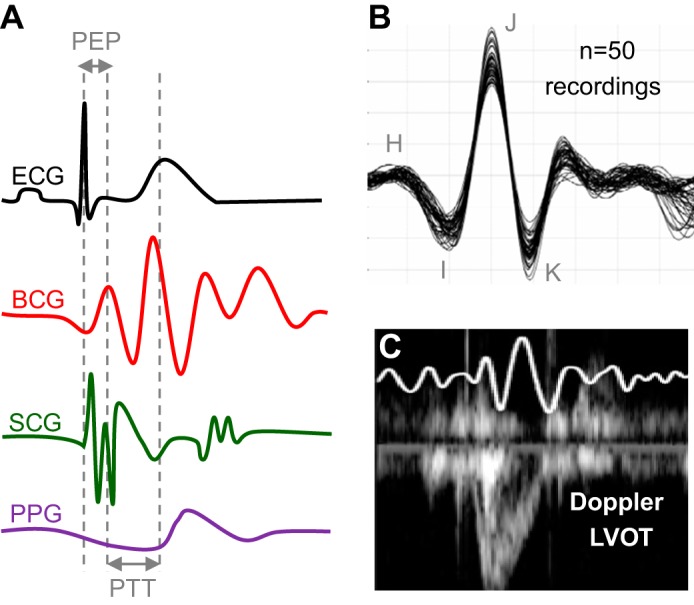
A: ECG, BCG, SCG, and PPG signals, showing the key time intervals extracted from these signals: preejection period (PEP) and pulse transit time (PTT). B: a total of 50 recordings were obtained from 1 subject over multiple weeks to evaluate the intrasubject variability of BCG recordings. C: simultaneously obtained BCG and Doppler ultrasound from the left ventricular outflow tract (LVOT). Reproduced from References 31 and 34 with permission of IOP Publishing.
The following focuses on comparing and correlating BCG-derived waveform features to other cardiovascular signals of mechanical origin. PPG-, ICG-, and echocardiogram-derived cardiomechanical signals have well-established physiological origins as well as clinical applications. Table 1 summarizes the physiological correlations of the BCG signals to these other cardiomechanical signals, and the following is a detailed account of each.
Table 1.
Summary of physiologically motivated correlations of BCG signals with other cardiomechanical signals
| BCG-Derived Metric | Gold Standard | Nonobtrusive Standard | Summary of Correlation |
|---|---|---|---|
| RMS power | Cardiac output measured by right- or left-heart catheterization | Velocity time integral of Doppler echocardiogram | Strong correlation between changes in BCG RMS power and cardiac output measured by echocardiogram during exercise recovery (34) |
| RJ interval | dP/dTmax measured by left-heart catheterization | Preejection period (PEP) measured by impedance cardiography | Strong correlation between RJ interval and PEP (6, 22) |
| Estimate of pulse transit time (PTT) | Tonometry | ICG and PPG estimate | BCG-based PTT excludes the PEP and thereby exhibits a stronger correlation to true PTT (13, 44) |
| Estimate of diastolic blood pressure using PTT | Auscultation by skilled provider | Oscillometric estimate | BCG-based DBP estimate exhibits RMS error < 8 mmHg (13, 44) |
Volume and heart rate.
While heart rate can readily be measured by numerous methods, individual stroke volume measures are most reliably measured with catheterization or echocardiography, and in some cases ICG. Starr and colleagues, when developing BCG measurement instrumentation, attempted to estimate absolute values of CO from subjects in units of liters per minute (64). However, because of the large intersubject variability in BCG waveform shape and amplitude, such absolute correlations between BCG-derived CO (and stroke volume) and gold standard (catheterization based) measurements were not found to be strong. While in our early studies of BCG waveforms we also found the intersubject variability in BCG signals to be high, and therefore did not expect to achieve any results different from those of Starr et al. In terms of absolute CO estimation, we discovered that the intrasubject variability was quite low and thus posited that relative changes in CO could be robustly extracted from the same person’s measurements over time. Figure 3B shows 50 recordings assembled together that were obtained from the same subject over the course of multiple weeks in the same conditions: the J-wave amplitude fluctuated, but the waveform features and morphology were very similar among all 50 measurements. The tables used by Starr et al. were large, cumbersome, and bulky and required expert mechanical maintenance; accordingly, they could only be used in clinical settings and thus were only intended for one-time, snapshot measurements (diagnostics) rather than longitudinal monitoring. With our inexpensive and portable weighing scale-based BCG measurement system, and with our wearable hardware, measurements could readily be obtained frequently outside of clinical settings.
With this knowledge, we evaluated whether BCG-derived relative changes in CO were accurate compared with echocardiography (34). A total of nine healthy subjects exercised on a treadmill according to the Bruce protocol. After completion of the exercise test, each subject stood still as the BCG signal was measured continuously for 10 min, and simultaneously a trained sonographer obtained Doppler echocardiogram measurements from the left ventricular outflow tract (LVOT) approximately every 30–60 s of exercise recovery. Thus, our experiment represented a condition of falling CO (from an elevated state during exercise), and minute-to-minute comparisons between the BCG- and Doppler LVOT-derived CO changes were made. A typical BCG waveform obtained simultaneously with the Doppler LVOT is shown in Fig. 3C. Changes in CO from the baseline resting condition were computed with both the BCG and the Doppler echocardiogram measurements, and the correlation and agreement were found to be strong. Specifically, we found a strong correlation between changes in the root mean square (RMS) power of the BCG and changes in CO [Fig. 4A (34)]. We selected the RMS power of the BCG as a metric for capturing relative changes in CO because RMS incorporates both amplitude and timing information. Specifically, by windowing several beats of BCG waveforms and computing RMS power over these time windows, our approach captured changes in CO related to both heart rate (more BCG beats per window) and stroke volume (larger beats and thus higher amplitude).
Fig. 4.
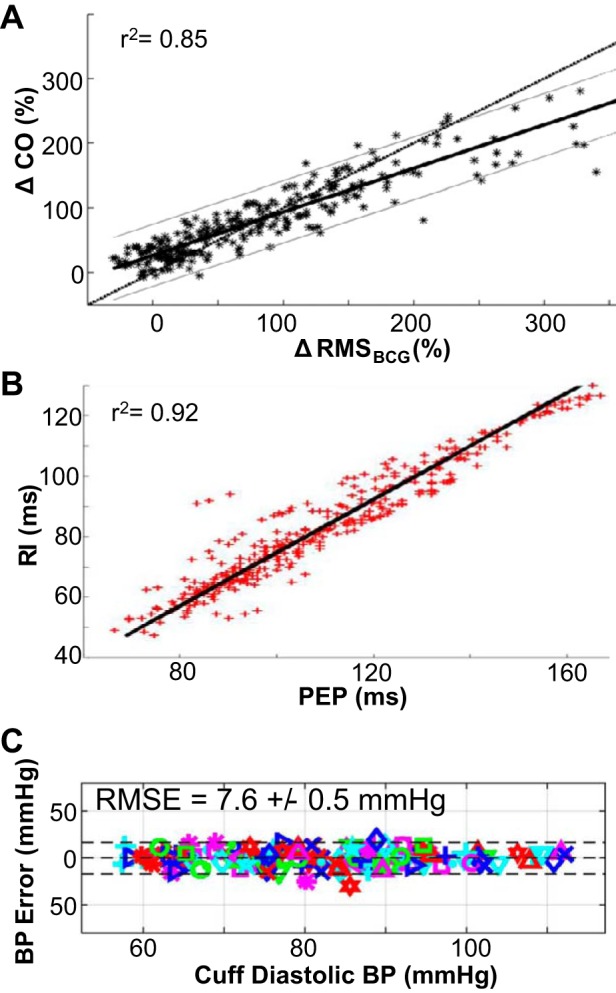
A: changes in BCG root mean square (RMS) power were strongly correlated to changes in cardiac output (CO) measured by Doppler ultrasound during exercise recovery. B: PEP measured using ECG and impedance cardiography (ICG) was strongly correlated to the RI interval measured from the ECG and BCG signals, with a regression line slope of near unity. C: the agreement between PTT-based diastolic blood pressure (BP) estimates from BCG and PPG signals obtained on the modified weighing scale to corresponding reference standard BP measurements was strong, with an RMS error of <8 mmHg for all subjects. Reproduced from References 6 and 44, licensed under CC BY 4.0, and from Reference 34 with permission of IOP Publishing.
Cardiac contractility.
BCG has been demonstrated to correlate with changes in contractility (6, 22, 43). Noninvasive methods of contractility are based on estimates of systolic time intervals (42, 71). Intuitively, a higher slope of the left ventricular pressure waveform can be achieved by progressing through isovolumetric contraction more quickly, as is the case with increased intrinsic contractility—this would result in a shortened PEP (defined as the time elapsed from the ECG Q wave to the opening of the aortic valve). PEP has been measured extensively using ECG and ICG signals as the time delay from the Q wave of the ECG to the B point of the ICG (21). We found that a BCG-derived time interval—the delay from the R wave of the ECG to the J wave of the BCG—was strongly correlated to PEP with near-unity slope (22). With a wide-bandwidth force plate sensor and further signal processing techniques to extract the BCG I wave, we showed that the RI interval was even more closely correlated to the PEP, shown in Fig. 4B (6). In this recent study with the force plate-based BCG measurement, 17 healthy subjects each performed exercise first and then stood still on the force plate for 5 min during recovery. The reference standard PEP (derived with ECG and ICG) and RI interval (extracted from ECG and BCG) both decreased during exercise and then recovered back to the resting value during recovery. The correlation and agreement were found to be strong (r2 = 0.92) between the PEP and RI interval. These strong correlations support that the BCG can measure not only relative changes in CO but also absolute values of PEP.
Blood pressure.
There are several scenarios (for example, the differentiation of different forms of shock) in which knowing CO and contractility alone does not give an accurate representation of cardiovascular state. Measurement of afterload is challenging because it represents vascular resistance distributed throughout the body. Afterload is often approximated by BP. The gold standard metric of measuring BP—auscultation of Korotkoff sounds with an inflatable cuff—remains difficult to automate and cannot be used for continuous measurements. Attempts at “cuffless” BP measurement commonly derive from measuring PTT, defined as the time delay for a pressure wave to travel along the arterial wall between two sites (24, 47). By interrogating the pulse wave with tonometry or ultrasound at both the carotid (proximal time, T1) and femoral (distal time, T2) sites simultaneously, a time delay can be measured: PTT = T2 − T1. This time delay has been shown numerous times to have a tight, inverse relationship with diastolic BP (DBP) when calibrated on a subject-by-subject basis (24, 47, 63); specifically, DBP = k1PTT−1 + k2, where k1 and k2 are subject-specific parameters that must be determined by calibration.
A fundamental limitation of measuring PTT is the requirement for simultaneous carotid and femoral interrogation—more obtrusive than an inflatable arm cuff. Many investigators derive an estimate of PTT as the time delay between the ECG QRS complex and the onset of the hand PPG waveform, both of which can be obtained readily and continuously. However, by using an electrical indicator for T1, this PTT estimate includes PEP. The PEP, a measurement of the intrinsic contractility of the myocardium as described above, changes in the opposite direction from true PTT (a measurement of BP) in many scenarios including vasoconstriction (82). However, in exercise they change in the same direction (80). Inclusion of PEP in the PTT estimate, while necessary when using the ECG as the T1, unfortunately adds a significant confounding time interval to the estimate.
The BCG provides a proximal T1 measurement, as it is the excursion of the body through space due to recoil from the ejection of blood through the aorta (this is even “more proximal” to the carotid upstroke). BCG-based PTT estimates can be obtained with both the wearable device shown in Fig. 1B and a weighing scale-based apparatus. Our initial validation was conducted with the weighing scale-based BCG measurement in collaboration with Drs. R. Mukkamala and J.-O. Hahn, with a simultaneously obtained PPG measurement on a strap placed over the dorsum of the foot (14). With such a setup, very tight limits of agreement to DBP (Fig. 4C) and systolic BP were found (44). By removing PEP from the PTT estimation, BCG-based PTT estimation shows promise for true, continuous, cuffless measurement of BP. The wearable SCG and PPG measurement device described above also provided high-quality estimates of BP using PTT. After calibration the DBP estimations reached a RMS error of 2.9 mmHg (13). Since the BCG, together with PPG, can provide an estimate of DBP, and the RMS power of the signal can provide an estimate of changes in CO, the BCG can potentially be used as well to estimate changes in SVR.
VALIDATION OF WEARABLE BCG IN PATIENTS WITH CARDIOVASCULAR DISEASE
Subsequent studies transitioned to assessing the potential value of wearable BCG in monitoring HF patients. HF results from diminished CO that occurs often after myocardial injury and is a prevalent disorder afflicting 6.5 million Americans (8). Reduced output impairs renal perfusion, triggering fluid retention and thereby further diminishing CO by overloading the left ventricle. Pharmacological therapies for HF work primarily by augmenting myocardial contractility and inducing diuresis. When an optimal dose of medications is achieved to prevent further fluid retention, the patient is deemed “compensated.”
BCG as a decision aid for home monitoring of HF.
Medications are commonly dosed based on in-office clinical evaluation and echocardiography with limited titration instructions given to patients based on symptoms and weight gain at home. Hypothesizing that daily titration of medications based on more accurate hemodynamic measures would lead to improved outcomes, a number of wireless, implantable monitors were developed by industry to inform medication dosing on a daily basis (2). Despite their efficacy, implantable solutions are principally limited by their cost, relegating their use to patients with advanced HF. Wearable BCG, while low cost and unobtrusive, is unlikely to provide absolute measurements of intracardiac pressures at the same accuracy as implantable solutions. However, since wearable BCG can be measured during various physiological perturbations, the responses in cardiac parameters to these perturbations may indeed overcome the limitations in absolute measures of the BCG signal.
Specifically, we hypothesized that alterations in contractility in response to physiological stressors will be affected by worsening HF before changes in the resting baseline of these same parameters. We evaluated 12 patients hospitalized for decompensated HF and 9 stable outpatients with compensated HF, each of whom wore the patch shown in Fig. 1A and performed a standardized exercise [6-min walk test (12)]. After the exercise, the patients stood still for 5 min for recovery and the changes in the RJ interval (and therefore PEP, a surrogate of contractility as discussed above) of the BCG associated with the exercise were computed. The RJ interval measured with wearable BCG after the 6-min walk test changes differently in patients with compensated vs. decompensated HF (33, 35). The RJ interval changes associated with the exercise were greater in patients with compensated HF (P < 0.05), likely because these patients had a greater myocardial reserve and thus could modulate their contractility in response to the exercise more effectively than the decompensated patients. Also, there was no difference in the heart rate after exercise, thus supporting the need for additional information regarding the mechanical aspects of cardiovascular function to differentiate compensated from decompensated HF. Furthermore, since wearable BCG is an accelerometry-based measurement, future algorithms may be able to determine not only the hemodynamic responses to exercise but the exercise dose, and thus a “dose response” relating the contractility response to the dosage of exercise can be created for HF patients, with thresholds determining at what stage the patients are compensated vs. decompensated. This could potentially allow more naturalistic monitoring conditions, where the patients do not necessarily need to perform standardized exercise tests but rather conduct their normal activities of daily living, with their PEP responses to these activities being quantified by the wearable patch.
Cardiac resynchronization therapy.
We believe that BCG might provide a tool for optimizing pacemaker parameters for patients with advanced HF. Cardiac resynchronization therapy (CRT) is indicated in patients with advanced HF where the pattern of myocardial injury has led to ventricular dyssynchrony: the delay in contraction between the left and right ventricles in some patients is so great that the overall ejection of blood from one or both ventricles is compromised. Multichamber pacemakers, with leads in the right atrium, right ventricle, and coronary sinus (approximating the left ventricle), can independently pace both sides of the heart. A significant challenge remains in determining the optimum time delays between chambers, which is nontrivial even with simultaneous echocardiography (69). It is also unknown how often the timing may need to be adjusted to compensate for slower myocardial remodeling. We performed a pilot study showing a significant difference (P < 0.05) in BCG J-wave amplitude in comparing optimal to suboptimal CRT settings (25). With greater research in this area, one can envision a closed-loop system whereby CRT parameters are tuned dynamically to increases in demand (such as during exercise) and changes in baseline (due to myocardial remodeling).
FUTURE DIRECTIONS: WEARABLE BCG MEASUREMENT FOR HEALTH AND PERFORMANCE
Wearable BCG systems hold promise as decision aids for inclusion in wearable sensor systems for caregivers and users alike. We envision several future opportunities for health and performance monitoring that may be enabled by these wearable technologies: longitudinal monitoring of pregnant women with preeclampsia; real-time physiology-guided fluid resuscitation in shock; diver performance optimization with underwater BCG recordings; and personalization of work-rest cycles for workers performing tasks in the heat. In addition to these opportunities focused on human health and performance, wearable BCG systems may also be usable for studying physiological responses in free-living small animals.
Preeclampsia.
Preeclampsia/eclampsia defines a clinical spectrum of hemodynamic compromise during pregnancy, ranging from mild hypertension and proteinuria to intractable central nervous system seizures requiring emergent cesarean delivery regardless of gestational age. Invasive study of the cardiovascular system during pregnancy is limited by 1) a lack of animal models of preeclampsia and 2) the significant risks posed to mother and fetus by unnecessary invasive procedures in humans. As such, there is a paucity of evidence to support diagnostic tools for population-level screening for preeclampsia as well as prognostic indicators for progression of preeclampsia from mild to severe forms. The clinical gold standard for monitoring progression remains the measurement of BP at home and during prenatal visits. Wearable BCG, which can measure indicators of not only BP but CO and contractility, holds promise for the possibility of screening for and management of preeclampsia. In a prospective cohort of 100 pregnant women (50 with gestational hypertension or preeclampsia) Quesada et al. showed significant differences in BCG morphology in preeclamptic compared with control subjects (54). Beyond simple changes in amplitude or RJ interval, the overall waveform morphology distorted substantially. Aside from observational morphological differences, quantifying differences between the groups requires future studies in pregnant subjects. Additionally, the watch-based SCG and PPG measurement tool for estimating BP changes shown in Fig. 1B can also be used to track BP at multiple times throughout the day, and with more convenience for the user compared with a cuff.
Fluid resuscitation in shock.
Despite the many etiologies of shock—hemorrhagic from a traumatic event, distributive from sepsis, cardiogenic in the end stages of HF—an essential, common tool in both acute resuscitation and longer-term management remains the administration of intravenous fluids. Unfortunately, even for the most invasive assessment of fluid status—the pulmonary artery catheter—a meta-analysis of 5,868 patients showed that pulmonary artery catheterization “did not alter the mortality, general ICU or hospital LOS [length of stay], or cost for adult patients in intensive care” (55). Similarly, additional biomarkers such as central venous oxygen saturation, blood lactate, and central venous-to-arterial carbon dioxide partial pressure difference, while useful diagnostically, cannot “indicate prognosis, predict progression of the disease, and guide treatment in sepsis” (79). Recent practice guidelines for trauma resuscitation in fact state that “the ideal parameter to use as an endpoint for resuscitation would be reliable, easy to use, non-invasive, safe, and cheap” (68). One candidate measurement is the recently described compensatory reserve measure, determined by Convertino et al. to provide the capability to accurately predict impending cardiovascular collapse in simulated hemorrhage (18). This prediction was based on the use of arterial BP waveforms derived from Finapres and in later work by the same group on the use of PPG signals from the finger; in future studies, the BCG waveform measured with a patch on the chest could be used as input to machine learning algorithms similar to those used in these prior works to predict the risk of cardiovascular collapse for hemorrhaging patients or to provide a decision aid for the administration of fluid.
Underwater wearable BCG recordings.
Water immersion up to the neck includes fluid redistribution with more blood volume moving from the periphery to the thorax and peripheral vasoconstriction (in cold water) or vasodilation (in warm water). Studies have shown that CO increases by 32–62% in water immersion (51, 52). Wearable BCG has been employed to monitor cardiovascular physiology underwater without the need for water-sealed electrodes or other more complex, conventional approaches. We performed a proof-of-concept study with three healthy adults, comparing wearable BCG waveforms measured immediately before and during immersion up to the neck. BCG waveforms produced high signal quality, and the RMS power of the wearable BCG signals increased by an average of 36% in cold water immersion, consistent with physiological expectations and findings in previous studies with more obtrusive hardware (74). Beyond optimization of diver performance, the measurement of wearable BCG signals from persons exposed to cold stress may itself provide benefit for determining the impact of the stress on a person’s physiology, and possibly mitigating risk. Cold stress increases total peripheral resistance and contractility and can potentially lead to life-altering injuries and even death in persons who do not tolerate the environment well (15).
BCG following exercise in the heat.
The idea of using BCG for assessing cardiovascular performance in austere environments is not new: interestingly, some of the first experiments assessing cardiovascular responses to heat stress were conducted in the 1940s and 1950s with table-based BCG measurement instrumentation (3). Heat stress can induce profound cardiovascular responses during rest (19) and exercise (61). Workers performing demanding tasks in the field are often exposed to heat stress, and wearable sensing can potentially provide a means of evaluating their tolerance as well as setting work-rest cycles based on personalized need. We measured ECG and BCG signals after exercise in the heat with dehydration, using a protocol previously described in the literature (62). Subjects exercised in the heat for 3 h without replenishing fluids, and ECG and BCG measurements were taken at 60-min intervals together. We found that the RJ interval increased for all subjects who reached 3% total body water loss, indicating that contractility was impaired, likely due to the reduction in end-diastolic volume that has been demonstrated in a prior study (65). Future research should investigate the possibility of using wearable BCG signals as a measure of cardiovascular reserve for persons experiencing exertional heat stress, to possibly indicate when the user is at high risk of physical/heat exhaustion associated with absolute (due to dehydration) and relative (due to the increased vascular space resulting from active cutaneous vasodilation) hypovolemia (60). In addition, such sensors might provide a biomarker of adaptation, as cardiovascular changes are critical to heat acclimation (53).
Wearable BCG measurements during animal studies.
Considerable research regarding health, medication, and adaptation/injury is conducted on rodent models where cardiovascular measures are difficult to obtain in free-living animals. We examined the possibility of obtaining BCG waveforms with a miniature accelerometer on the chest of an anesthetized rat simultaneously with ECG measurements. We found that high-quality BCG recordings could be obtained, with individual heartbeats readily identifiable from the chest acceleration waveforms. Additionally, the peaks of the wearable BCG waveforms were delayed with respect to the ECG, as is the case in human subjects, because of the PEP. To evaluate whether the RJ interval was indeed a measure of PEP in the rat as it is for human subjects, we introduced a perturbation to change the PEP and measured changes in the RJ interval compared with invasive measurements of RAo interval (ECG R wave to aortic valve opening as determined from aortic BP waveforms). Specifically, we performed efferent vagal nerve stimulation to increase parasympathetic tone and found an increase in both the RJ and RAo intervals of ~5–10 ms. In future studies, the physiological relationships between wearable BCG-derived health parameters (CO, BP, contractility, and SVR) should be evaluated in small animals in comparison to invasive measures. Accordingly, wearable BCG—which could be implemented in a small, lightweight, wireless backpack or strap on the animal—could be used in chronic physiological studies to assess responses to neural stimulation, pharmacological interventions, and other commonly used protocols in basic science experiments.
CONCLUSIONS
Recent advances in BCG instrumentation, signal processing, and physiological studies have provided a strong foundation for enabling the BCG to become a more prevalent wearable physiological monitoring tool. By placing the wearable patch on the body under the clothing, multiple cardiomechanical health parameters can be extracted continuously without creating discomfort for the user compared with chest straps, multielectrode ICG measurement systems, or other more obtrusive cardiovascular measurement tools. Moreover, the system can be designed to be sufficiently inexpensive such that users can potentially directly purchase such devices, since the internal parts and manufacturing complexity are comparable to personal health and fitness products presently on the market. Compared with existing wristbands and watches that measure PPG only, the BCG provides greater insight into cardiovascular health and performance and is less affected by environmental factors (peripheral vasoconstriction/vasodilation) since it is a measurement of cardiac ejection and aortic blood movement primarily and also more robust to motion artifacts since it is measured on the chest or back rather than the wrist. Although the phenomenon of BCG has been understood for nearly a century and a half, the most exciting and impactful days for the measurement may be in the decades to come, as it can successfully translate to a prevalent physiological measurement.
GRANTS
This material is based upon work supported in part by National Institutes of Health Grants 1R01 HL-130619, 1U01 EB-018818, and 1R56 AG-048458.
DISCLOSURES
No conflicts of interest, financial or otherwise, are declared by the authors.
AUTHOR CONTRIBUTIONS
M.E. and O.T.I. conceived and designed research; M.E. and O.T.I. performed experiments; M.E. and O.T.I. analyzed data; M.E. and O.T.I. interpreted results of experiments; M.E. and O.T.I. prepared figures; M.E. and O.T.I. drafted manuscript; M.E. and O.T.I. edited and revised manuscript; M.E. and O.T.I. approved final version of manuscript.
REFERENCES
- 1.Abraham WT, Adamson PB, Bourge RC, Aaron MF, Costanzo MR, Stevenson LW, Strickland W, Neelagaru S, Raval N, Krueger S, Weiner S, Shavelle D, Jeffries B, Yadav JS; CHAMPION Trial Study Group . Wireless pulmonary artery haemodynamic monitoring in chronic heart failure: a randomised controlled trial. Lancet 377: 658–666, 2011. doi: 10.1016/S0140-6736(11)60101-3. [DOI] [PubMed] [Google Scholar]
- 2.Abraham WT, Stevenson LW, Bourge RC, Lindenfeld JA, Bauman JG, Adamson PB; CHAMPION Trial Study Group . Sustained efficacy of pulmonary artery pressure to guide adjustment of chronic heart failure therapy: complete follow-up results from the CHAMPION randomised trial. Lancet 387: 453–461, 2016. doi: 10.1016/S0140-6736(15)00723-0. [DOI] [PubMed] [Google Scholar]
- 3.Adolph EF. Physiology of Man in the Desert. New York: Intersciences, 1947. [Google Scholar]
- 4.Allen J. Photoplethysmography and its application in clinical physiological measurement. Physiol Meas 28: R1–R39, 2007. doi: 10.1088/0967-3334/28/3/R01. [DOI] [PubMed] [Google Scholar]
- 5.Ashouri H, Inan OT. Automatic detection of seismocardiogram sensor misplacement for robust pre-ejection period estimation in unsupervised settings. IEEE Sens J 17: 3805–3813, 2017. doi: 10.1109/JSEN.2017.2701349. [DOI] [PMC free article] [PubMed] [Google Scholar]
- 6.Ashouri H, Orlandic L, Inan OT. Unobtrusive estimation of cardiac contractility and stroke volume changes using ballistocardiogram measurements on a high bandwidth force plate. Sensors (Basel) 16: 787, 2016. doi: 10.3390/s16060787. [DOI] [PMC free article] [PubMed] [Google Scholar]
- 7.Balasubramanian V, Mathew OP, Behl A, Tewari SC, Hoon RS. Electrical impedance cardiogram in derivation of systolic time intervals. Br Heart J 40: 268–275, 1978. doi: 10.1136/hrt.40.3.268. [DOI] [PMC free article] [PubMed] [Google Scholar]
- 8.Benjamin EJ, Blaha MJ, Chiuve SE, Cushman M, Das SR, Deo R, de Ferranti SD, Floyd J, Fornage M, Gillespie C, Isasi CR, Jiménez MC, Jordan LC, Judd SE, Lackland D, Lichtman JH, Lisabeth L, Liu S, Longenecker CT, Mackey RH, Matsushita K, Mozaffarian D, Mussolino ME, Nasir K, Neumar RW, Palaniappan L, Pandey DK, Thiagarajan RR, Reeves MJ, Ritchey M, Rodriguez CJ, Roth GA, Rosamond WD, Sasson C, Towfighi A, Tsao CW, Turner MB, Virani SS, Voeks JH, Willey JZ, Wilkins JT, Wu JH, Alger HM, Wong SS, Muntner P; American Heart Association Statistics Committee and Stroke Statistics Subcommittee . Heart Disease and Stroke Statistics—2017 update: a report from the American Heart Association. Circulation 135: e146–e603, 2017. [Errata. Circulation 135: e646, 2017; Circulation 136: e196, 2017]. doi: 10.1161/CIR.0000000000000485. [DOI] [PMC free article] [PubMed] [Google Scholar]
- 9.Blanco-Velasco M, Weng B, Barner KE. ECG signal denoising and baseline wander correction based on the empirical mode decomposition. Comput Biol Med 38: 1–13, 2008. doi: 10.1016/j.compbiomed.2007.06.003. [DOI] [PubMed] [Google Scholar]
- 10.Boutouryrie P, Vermeersch SJ; Reference Values for Arterial Stiffness’ Collaboration . Determinants of pulse wave velocity in healthy people and in the presence of cardiovascular risk factors: “establishing normal and reference values”. Eur Heart J 31: 2338–2350, 2010. doi: 10.1093/eurheartj/ehq165. [DOI] [PMC free article] [PubMed] [Google Scholar]
- 11.Bui AL, Fonarow GC. Home monitoring for heart failure management. J Am Coll Cardiol 59: 97–104, 2012. doi: 10.1016/j.jacc.2011.09.044. [DOI] [PMC free article] [PubMed] [Google Scholar]
- 12.Cahalin LP, Mathier MA, Semigran MJ, Dec GW, DiSalvo TG. The six-minute walk test predicts peak oxygen uptake and survival in patients with advanced heart failure. Chest 110: 325–332, 1996. doi: 10.1378/chest.110.2.325. [DOI] [PubMed] [Google Scholar]
- 13.Carek AM, Conant J, Joshi A, Kang H, Inan OT. SeismoWatch: wearable cuffless blood pressure monitoring using pulse transit time. Proc ACM Interactive Mobile Wearable Ubiquitous Technol 1: 40, 2017. doi: 10.1145/3130905 [DOI] [PMC free article] [PubMed] [Google Scholar]
- 14.Carek AM, Inan OT. Robust sensing of distal pulse waveforms on a modified weighing scale for ubiquitous pulse transit time measurement. IEEE Trans Biomed Circuits Syst 11: 765–772, 2017. doi: 10.1109/TBCAS.2017.2683801. [DOI] [PMC free article] [PubMed] [Google Scholar]
- 15.Castellani JW, Tipton MJ. Cold stress effects on exposure tolerance and exercise performance. Compr Physiol 6: 443–469, 2015. doi: 10.1002/cphy.c140081. [DOI] [PubMed] [Google Scholar]
- 16.Charloux A, Lonsdorfer-Wolf E, Richard R, Lampert E, Oswald-Mammosser M, Mettauer B, Geny B, Lonsdorfer J. A new impedance cardiograph device for the non-invasive evaluation of cardiac output at rest and during exercise: comparison with the “direct” Fick method. Eur J Appl Physiol 82: 313–320, 2000. doi: 10.1007/s004210000226. [DOI] [PubMed] [Google Scholar]
- 17.Chopra S, Balakrishnan S, Gopalan R. DLID: deep learning for domain adaptation by interpolating between domains (Abstract). ICML Workshop on Challenges in Representation Learning, 2013. [Google Scholar]
- 18.Convertino VA, Grudic G, Mulligan J, Moulton S. Estimation of individual-specific progression to impending cardiovascular instability using arterial waveforms. J Appl Physiol 115: 1196–1202, 2013. doi: 10.1152/japplphysiol.00668.2013. [DOI] [PubMed] [Google Scholar]
- 19.Crandall CG, Wilson TE. Human cardiovascular responses to passive heat stress. Compr Physiol 5: 17–43, 2015. doi: 10.1002/cphy.c140015. [DOI] [PMC free article] [PubMed] [Google Scholar]
- 20.Dubin D. Rapid Interpretation of EKG’s. Tampa, FL: Cover, 2000. [Google Scholar]
- 21.Ermishkin V, Lukoshkova E, Bersenev EY, Saidova M, Shitov V, Vinogradova O, Khayutin V. Beat-by-beat changes in pre-ejection period during functional tests evaluated by impedance aortography: a step to a left ventricular contractility monitoring. In: 13th International Conference on Electrical Bioimpedance and the 8th Conference on Electrical Impedance Tomography, edited by Scharfetter H, Merwa R. Berlin: Springer, 2007, p. 655–658. [Google Scholar]
- 22.Etemadi M, Inan OT, Giovangrandi L, Kovacs GT. Rapid assessment of cardiac contractility on a home bathroom scale. IEEE Trans Inf Technol Biomed 15: 864–869, 2011. doi: 10.1109/TITB.2011.2161998. [DOI] [PubMed] [Google Scholar]
- 23.Etemadi M, Inan OT, Heller JA, Hersek S, Klein L, Roy S. A wearable patch to enable long-term monitoring of environmental, activity and hemodynamics variables. IEEE Trans Biomed Circuits Syst 10: 280–288, 2016. doi: 10.1109/TBCAS.2015.2405480. [DOI] [PMC free article] [PubMed] [Google Scholar]
- 24.Geddes LA, Voelz MH, Babbs CF, Bourland JD, Tacker WA. Pulse transit time as an indicator of arterial blood pressure. Psychophysiology 18: 71–74, 1981. doi: 10.1111/j.1469-8986.1981.tb01545.x. [DOI] [PubMed] [Google Scholar]
- 25.Giovangrandi L, Inan OT, Wiard RM, Etemadi M, Kovacs GT. Ballistocardiography—a method worth revisiting. Conf IEEE Eng Med Biol Soc 2011: 4279–4282, 2011. doi: 10.1109/IEMBS.2011.6091062. [DOI] [PMC free article] [PubMed] [Google Scholar]
- 26.Han H, Kim MJ, Kim J. Development of real-time motion artifact reduction algorithm for a wearable photoplethysmography. Conf IEEE Eng Med Biol Soc 2007: 1538–1541, 2007. doi: 10.1109/IEMBS.2007.4352596. [DOI] [PubMed] [Google Scholar]
- 27.He DD, Winokur ES, Sodini CG. A continuous, wearable, and wireless heart monitor using head ballistocardiogram (BCG) and head electrocardiogram (ECG). Conf IEEE Eng Med Biol Soc 2011: 4729–4732, 2011. doi: 10.1109/IEMBS.2011.6091171. [DOI] [PubMed] [Google Scholar]
- 28.He DD, Winokur ES, Sodini CG. An ear-worn vital signs monitor. IEEE Trans Biomed Eng 62: 2547–2552, 2015. doi: 10.1109/TBME.2015.2459061. [DOI] [PMC free article] [PubMed] [Google Scholar]
- 29.Huang NE, Shen Z, Long SR, Wu MC, Shih HH, Zheng Q, Yen NC, Tung CC, Liu HH. The empirical mode decomposition and the Hilbert spectrum for nonlinear and non-stationary time series analysis. Proc R Soc Lond A Math Phys Eng Sci 454: 903–995, 1998. doi: 10.1098/rspa.1998.0193. [DOI] [Google Scholar]
- 30.Imholz BP, Wieling W, van Montfrans GA, Wesseling KH. Fifteen years experience with finger arterial pressure monitoring: assessment of the technology. Cardiovasc Res 38: 605–616, 1998. doi: 10.1016/S0008-6363(98)00067-4. [DOI] [PubMed] [Google Scholar]
- 31.Inan OT, Etemadi M, Wiard RM, Giovangrandi L, Kovacs GT. Robust ballistocardiogram acquisition for home monitoring. Physiol Meas 30: 169–185, 2009. doi: 10.1088/0967-3334/30/2/005. [DOI] [PubMed] [Google Scholar]
- 32.Inan OT. Novel Technologies for Cardiovascular Monitoring Using Ballistocardiography and Electrocardiography (PhD thesis). Stanford, CA: Stanford Univ., 2009. [Google Scholar]
- 33.Inan OT, Dorier A, Dowling S, Javaid AQ, Etemadi M, Roy S, De Marco T, Klein L. Activity-contextualized wearable ballistocardiogram measurements can classify decompensated versus compensated heart failure patients. American Heart Association Scientific Sessions, AHA, New Orleans, LA, 2016. [Google Scholar]
- 34.Inan OT, Etemadi M, Paloma A, Giovangrandi L, Kovacs GT. Non-invasive cardiac output trending during exercise recovery on a bathroom-scale-based ballistocardiograph. Physiol Meas 30: 261–274, 2009. doi: 10.1088/0967-3334/30/3/003. [DOI] [PubMed] [Google Scholar]
- 35.Inan OT, Javaid AQ, Dowling S, Ashouri H, Etemadi M, Heller JA, Roy S, Klein L. Using ballistocardiography to monitor left ventricular function in heart failure patients. J Card Fail 22: S45, 2016. doi: 10.1016/j.cardfail.2016.06.135. [DOI] [Google Scholar]
- 36.Inan OT, Migeotte PF, Park KS, Etemadi M, Tavakolian K, Casanella R, Zanetti J, Tank J, Funtova I, Prisk GK, Di Rienzo M. Ballistocardiography and seismocardiography: a review of recent advances. IEEE J Biomed Health Inform 19: 1414–1427, 2015. doi: 10.1109/JBHI.2014.2361732. [DOI] [PubMed] [Google Scholar]
- 37.Javaid AQ, Ashouri H, Dorier A, Etemadi M, Heller JA, Roy S, Inan OT. Quantifying and reducing motion artifacts in wearable seismocardiogram measurements during walking to assess left ventricular health. IEEE Trans Biomed Eng 64: 1277–1286, 2017. doi: 10.1109/TBME.2016.2600945. [DOI] [PMC free article] [PubMed] [Google Scholar]
- 38.Javaid AQ, Ashouri H, Inan OT. Estimating systolic time intervals during walking using wearable ballistocardiography. IEEE-EMBS International Conference on Biomedical and Health Informatics (BHI), 2016. [Google Scholar]
- 39.Jones RD, Kornberg JP, Roulson CJ, Visram AR, Irwin MG. The Finapres 2300e finger cuff. The influence of cuff application on the accuracy of blood pressure measurement. Anaesthesia 48: 611–615, 1993. doi: 10.1111/j.1365-2044.1993.tb07129.x. [DOI] [PubMed] [Google Scholar]
- 40.Katz AM. Physiology of the Heart. Philadelphia, PA: Lippincott Williams & Wilkins, 2010. [Google Scholar]
- 41.Kim CS, Ober SL, McMurtry MS, Finegan BA, Inan OT, Mukkamala R, Hahn JO. Ballistocardiogram: mechanism and potential for unobtrusive cardiovascular health monitoring. Sci Rep 6: 31297, 2016. doi: 10.1038/srep31297. [DOI] [PMC free article] [PubMed] [Google Scholar]
- 42.Lewis RP, Rittogers SE, Froester WF, Boudoulas H. A critical review of the systolic time intervals. Circulation 56: 146–158, 1977. doi: 10.1161/01.CIR.56.2.146. [DOI] [PubMed] [Google Scholar]
- 43.Lindqvist A, Pihlajamäki K, Jalonen J, Laaksonen V, Alihanka J. Static-charge-sensitive bed ballistocardiography in cardiovascular monitoring. Clin Physiol 16: 23–30, 1996. doi: 10.1111/j.1475-097X.1996.tb00553.x. [DOI] [PubMed] [Google Scholar]
- 44.Martin SL, Carek AM, Kim CS, Ashouri H, Inan OT, Hahn JO, Mukkamala R. Weighing scale-based pulse transit time is a superior marker of blood pressure than conventional pulse arrival time. Sci Rep 6: 39273, 2016. doi: 10.1038/srep39273. [DOI] [PMC free article] [PubMed] [Google Scholar]
- 45.McCall C, Stuart Z, Wiard RM, Inan OT, Giovangrandi L, Cuttino CM, Kovacs GT. Standing ballistocardiography measurements in microgravity. Conf IEEE Eng Med Biol Soc 2014: 5180–5183, 2014. doi: 10.1109/EMBC.2014.6944792. [DOI] [PubMed] [Google Scholar]
- 46.Migeotte PF, Lejeune L, Deliere Q, Caiani E, Casellato C, Tank J, Funtova I, Baevsky R, Prisk GK, van de Borne P. Three dimensional ballistocardiogram and seismocardiogram: what do they have in common? Conf IEEE Eng Med Biol Soc 2014: 6085–6088, 2014. doi: 10.1109/EMBC.2014.6945017. [DOI] [PubMed] [Google Scholar]
- 47.Mukkamala R, Hahn JO, Inan OT, Mestha LK, Kim CS, Töreyin H, Kyal S. Toward ubiquitous blood pressure monitoring via pulse transit time: theory and practice. IEEE Trans Biomed Eng 62: 1879–1901, 2015. doi: 10.1109/TBME.2015.2441951. [DOI] [PMC free article] [PubMed] [Google Scholar]
- 48.Natarajan A, Angarita G, Gaiser E, Malison R, Ganesan D, Marlin BM. Domain adaptation methods for improving lab-to-field generalization of cocaine detection using wearable ECG. Proceedings of the 2016 ACM International Joint Conference on Pervasive and Ubiquitous Computing, 2016, p. 875–885. [DOI] [PMC free article] [PubMed] [Google Scholar]
- 49.Parati G, Casadei R, Groppelli A, Di Rienzo M, Mancia G. Comparison of finger and intra-arterial blood pressure monitoring at rest and during laboratory testing. Hypertension 13: 647–655, 1989. doi: 10.1161/01.HYP.13.6.647. [DOI] [PubMed] [Google Scholar]
- 50.Patterson RP. Fundamentals of impedance cardiography. IEEE Eng Med Biol Mag 8: 35–38, 1989. doi: 10.1109/51.32403. [DOI] [PubMed] [Google Scholar]
- 51.Pendergast DR, Lundgren CE. The underwater environment: cardiopulmonary, thermal, and energetic demands. J Appl Physiol 106: 276–283, 2009. doi: 10.1152/japplphysiol.90984.2008. [DOI] [PubMed] [Google Scholar]
- 52.Pendergast DR, Moon RE, Krasney JJ, Held HE, Zamparo P. Human physiology in an aquatic environment. Compr Physiol 5: 1705–1750, 2015. doi: 10.1002/cphy.c140018. [DOI] [PubMed] [Google Scholar]
- 53.Périard JD, Travers GJS, Racinais S, Sawka MN. Cardiovascular adaptations supporting human exercise-heat acclimation. Auton Neurosci 196: 52–62, 2016. doi: 10.1016/j.autneu.2016.02.002. [DOI] [PubMed] [Google Scholar]
- 54.Quesada O, El Banani M, Heller J, Beach S, Etemadi M, Roy S, Inan O, Gonzalez J, Klein L. A pilot study of a modified bathroom scale to monitor cardiovascular hemodynamics in pregnancy. J Am Coll Cardiol 67: 1455, 2016. doi: 10.1016/S0735-1097(16)31456-5. [DOI] [Google Scholar]
- 55.Rajaram SS, Desai NK, Kalra A, Gajera M, Cavanaugh SK, Brampton W, Young D, Harvey S, Rowan K. Pulmonary artery catheters for adult patients in intensive care. Cochrane Database Syst Rev 2: CD003408, 2013. [DOI] [PMC free article] [PubMed] [Google Scholar]
- 56.Rasmussen JP, Sørensen B, Kann T. Evaluation of impedance cardiography as a non-invasive means of measuring systolic time intervals and cardiac output. Acta Anaesthesiol Scand 19: 210–218, 1975. doi: 10.1111/j.1399-6576.1975.tb05243.x. [DOI] [PubMed] [Google Scholar]
- 57.Reisner A, Shaltis PA, McCombie D, Asada HH. Utility of the photoplethysmogram in circulatory monitoring. Anesthesiology 108: 950–958, 2008. doi: 10.1097/ALN.0b013e31816c89e1. [DOI] [PubMed] [Google Scholar]
- 58.Sakoe H, Chiba S. Dynamic programming algorithm optimization for spoken word recognition. IEEE Trans Acoust Speech Signal Process 26: 43–49, 1978. doi: 10.1109/TASSP.1978.1163055. [DOI] [Google Scholar]
- 59.Salerno DM, Zanetti J. Seismocardiography: a new technique for recording cardiac vibrations. Concept, method, and initial observations. J Cardiovascular Technol 9: 111–118, 1990. [Google Scholar]
- 60.Sawka MN, Cheuvront SN, Kenefick RW. Hypohydration and human performance: impact of environment and physiological mechanisms. Sports Med 45, Suppl 1: S51–S60, 2015. doi: 10.1007/s40279-015-0395-7. [DOI] [PMC free article] [PubMed] [Google Scholar]
- 61.Sawka MN, Leon LR, Montain SJ, Sonna LA. Integrated physiological mechanisms of exercise performance, adaptation, and maladaptation to heat stress. Compr Physiol 1: 1883–1928, 2011. doi: 10.1002/cphy.c100082. [DOI] [PubMed] [Google Scholar]
- 62.Sawka MN, Young AJ, Latzka WA, Neufer PD, Quigley MD, Pandolf KB. Human tolerance to heat strain during exercise: influence of hydration. J Appl Physiol 73: 368–375, 1992. doi: 10.1152/jappl.1992.73.1.368. [DOI] [PubMed] [Google Scholar]
- 63.Solà J, Proença M, Ferrario D, Porchet JA, Falhi A, Grossenbacher O, Allemann Y, Rimoldi SF, Sartori C. Noninvasive and nonocclusive blood pressure estimation via a chest sensor. IEEE Trans Biomed Eng 60: 3505–3513, 2013. doi: 10.1109/TBME.2013.2272699. [DOI] [PubMed] [Google Scholar]
- 64.Starr I, Rawson A, Schroeder H, Joseph N. Studies on the estimation of cardiac ouptut in man, and of abnormalities in cardiac function, from the heart’s recoil and the blood’s impacts; the ballistocardiogram. Am J Physiol 127: 1–28, 1939. doi: 10.1152/ajplegacy.1939.127.1.1. [DOI] [Google Scholar]
- 65.Stöhr EJ, González-Alonso J, Pearson J, Low DA, Ali L, Barker H, Shave R. Dehydration reduces left ventricular filling at rest and during exercise independent of twist mechanics. J Appl Physiol 111: 891–897, 2011. doi: 10.1152/japplphysiol.00528.2011. [DOI] [PubMed] [Google Scholar]
- 66.Stok WJ, Baisch F, Hillebrecht A, Schulz H, Meyer M, Karemaker JM. Noninvasive cardiac output measurement by arterial pulse analysis compared with inert gas rebreathing. J Appl Physiol 74: 2687–2693, 1993. doi: 10.1152/jappl.1993.74.6.2687. [DOI] [PubMed] [Google Scholar]
- 67.Straver B, Roggekamp MC, de Vries PM, ter Wee PM. Systemic vascular resistance in intradialytic hypotension determined by means of impedance cardiography. Blood Purif 16: 281–289, 1998. doi: 10.1159/000014346. [DOI] [PubMed] [Google Scholar]
- 68.Tisherman SA, Barie P, Bokhari F, Bonadies J, Daley B, Diebel L, Eachempati SR, Kurek S, Luchette F, Carlos Puyana J, Schreiber M, Simon R. Clinical practice guideline: endpoints of resuscitation. J Trauma 57: 898–912, 2004. doi: 10.1097/01.TA.0000133577.25793.E5. [DOI] [PubMed] [Google Scholar]
- 69.Turcott RG, Witteles RM, Wang PJ, Vagelos RH, Fowler MB, Ashley EA. Measurement precision in the optimization of cardiac resynchronization therapy. Circ Heart Fail 3: 395–404, 2010. doi: 10.1161/CIRCHEARTFAILURE.109.900076. [DOI] [PMC free article] [PubMed] [Google Scholar]
- 70.Ulbrich M, Mühlsteff J, Sipilä A, Kamppi M, Koskela A, Myry M, Wan T, Leonhardt S, Walter M. The IMPACT shirt: textile integrated and portable impedance cardiography. Physiol Meas 35: 1181–1196, 2014. doi: 10.1088/0967-3334/35/6/1181. [DOI] [PubMed] [Google Scholar]
- 71.Weissler AM, Harris WS, Schoenfeld CD. Systolic time intervals in heart failure in man. Circulation 37: 149–159, 1968. doi: 10.1161/01.CIR.37.2.149. [DOI] [PubMed] [Google Scholar]
- 72.Wiard RM, Kim HJ, Figueroa CA, Kovacs GT, Taylor CA, Giovangrandi L. Estimation of central aortic forces in the ballistocardiogram under rest and exercise conditions. Conf IEEE Eng Med Biol Soc 2009: 2831–2834, 2009. doi: 10.1109/IEMBS.2009.5333577. [DOI] [PMC free article] [PubMed] [Google Scholar]
- 73.Wiens A, Etemadi M, Klein L, Roy S, Inan OT. Wearable ballistocardiography: preliminary methods for mapping surface vibration measurements to whole body forces. Conf IEEE Eng Med Biol Soc 2014: 5172–5175, 2014. doi: 10.1109/EMBC.2014.6944790. [DOI] [PMC free article] [PubMed] [Google Scholar]
- 74.Wiens AD, Carek AM, Inan OT. Sternal vibrations during head-out immersion: a preliminary demonstration of underwater wearable ballistocardiography. J Acoust Soc Am 138: EL342–EL346, 2015. doi: 10.1121/1.4929613. [DOI] [PubMed] [Google Scholar]
- 75.Wiens AD, Etemadi M, Roy S, Klein L, Inan OT. Toward continuous, noninvasive assessment of ventricular function and hemodynamics: wearable ballistocardiography. IEEE J Biomed Health Inform 19: 1435–1442, 2015. doi: 10.1109/JBHI.2014.2359937. [DOI] [PMC free article] [PubMed] [Google Scholar]
- 76.Wiens AD, Inan OT. A novel system identification technique for improved wearable hemodynamics assessment. IEEE Trans Biomed Eng 62: 1345–1354, 2015. doi: 10.1109/TBME.2014.2387354. [DOI] [PMC free article] [PubMed] [Google Scholar]
- 77.Wiens AD, Johnson A, Inan OT. Wearable sensing of cardiac timing intervals from cardiogenic limb vibration signals. IEEE Sens J 17: 1463–1470, 2017. doi: 10.1109/JSEN.2016.2643780. [DOI] [PMC free article] [PubMed] [Google Scholar]
- 78.Willum Hansen T, Staessen JA, Torp-Pedersen C, Rasmussen S, Thijs L, Ibsen H, Jeppesen J. Prognostic value of aortic pulse wave velocity as index of arterial stiffness in the general population. Circulation 113: 664–670, 2006. doi: 10.1161/CIRCULATIONAHA.105.579342. [DOI] [PubMed] [Google Scholar]
- 79.Wittayachamnankul B, Chentanakij B, Sruamsiri K, Chattipakorn N. The role of central venous oxygen saturation, blood lactate, and central venous-to-arterial carbon dioxide partial pressure difference as a goal and prognosis of sepsis treatment. J Crit Care 36: 223–229, 2016. doi: 10.1016/j.jcrc.2016.08.002. [DOI] [PubMed] [Google Scholar]
- 80.Wong MY, Pickwell-MacPherson E, Zhang YT, Cheng JC. The effects of pre-ejection period on post-exercise systolic blood pressure estimation using the pulse arrival time technique. Eur J Appl Physiol 111: 135–144, 2011. doi: 10.1007/s00421-010-1626-0. [DOI] [PubMed] [Google Scholar]
- 81.Wood LB, Asada HH. Low variance adaptive filter for cancelling motion artifact in wearable photoplethysmogram sensor signals. Conf IEEE Eng Med Biol Soc 2007: 652–655, 2007. doi: 10.1109/IEMBS.2007.4352374. [DOI] [PubMed] [Google Scholar]
- 82.Zhang G, Gao M, Xu D, Olivier NB, Mukkamala R. Pulse arrival time is not an adequate surrogate for pulse transit time as a marker of blood pressure. J Appl Physiol 111: 1681–1686, 2011. doi: 10.1152/japplphysiol.00980.2011. [DOI] [PubMed] [Google Scholar]
- 83.Zheng YL, Ding XR, Poon CC, Lo BP, Zhang H, Zhou XL, Yang GZ, Zhao N, Zhang YT. Unobtrusive sensing and wearable devices for health informatics. IEEE Trans Biomed Eng 61: 1538–1554, 2014. doi: 10.1109/TBME.2014.2309951. [DOI] [PMC free article] [PubMed] [Google Scholar]