

Abstract
Compromising oxygen delivery (O2D) during exercise requires compensatory vasodilatory and/or pressor responses to protect O2D:demand matching. The purpose of the study was to determine whether compensatory vasodilation is absent in some healthy young individuals in the face of a sudden reduction in exercising forearm perfusion pressure and whether this affects the exercise pressor response. Twenty-one healthy young men (21.6 ± 2.0 yr) completed rhythmic forearm exercise at a work rate equivalent to 70% of their own maximal exercise vasodilation. During steady-state exercise, the exercising arm was rapidly adjusted from below to above heart level, resulting in a reduction in forearm perfusion pressure of −30.7 ± 0.9 mmHg. Forearm blood flow (ml/min; brachial artery Doppler and echo ultrasound), mean arterial blood pressure (mmHg; finger photoplethysmography), and exercising forearm venous effluent (antecubital vein catheter) measurements revealed distinct compensatory vasodilatory differences. Thirteen individuals responded with compensatory vasodilation (509 ± 128 vs. 632 ± 136 ml·min−1·100 mmHg−1; P < 0.001), while eight individuals did not (663 ± 165 vs. 667 ± 167 ml·min−1·100 mmHg−1; P = 0.6). Compensatory pressor responses between groups were not different (5.5 ± 5.5 and 9.7 ± 9.5 mmHg; P = 0.2). Forearm blood flow, O2D, and oxygen consumption were all protected in compensators (all P > 0.05) but not in noncompensators, who therefore suffered compromises to exercise performance (6 ± 14 vs. −36 ± 29 N; P = 0.004). Phenotypic differences were not explained by potassium or nitric oxide bioavailability. In conclusion, both compensator and noncompensator vasodilator phenotype responses to a sudden compromise to exercising muscle blood flow are evident. Interindividual differences in the mechanisms governing O2D:demand matching should be considered as factors influencing exercise tolerance.
NEW & NOTEWORTHY In healthy young individuals, compromising submaximally exercising muscle perfusion appears to evoke compensatory vasodilation to defend oxygen delivery. Here we report the absence of compensatory vasodilation in 8 of 21 such individuals, despite their vasodilatory capacity and increases in perfusion with increasing exercise intensity being indistinguishable from compensators. The absence of compensation impaired exercise tolerance. These findings suggest that interindividual differences in oxygen delivery:demand matching efficacy affect exercise tolerance and depend on the nature of a delivery:demand matching challenge.
Keywords: compensatory vasodilation, oxygen delivery, perfusion pressure compromise
INTRODUCTION
Skeletal muscle oxygen delivery (O2D) and aerobic adenosine triphosphate (ATP) production appear to be tightly coupled across a range of exercise intensities. During small-muscle mass exercise in particular, where the cardiac pumping capacity is not limiting to maximal exercise, this coupling is reflected by a strong linear relationship between muscle blood flow/O2D and metabolic demand (1, 6, 38). This proportional adjustment of O2D relative to metabolic demand is achieved by vasodilation up to the heavy intensity domain, beyond which a pressor response of increasing magnitude contributes to the additional hyperemic response (36). These observations have led to the notion that O2D is effectively matched to metabolic demand during submaximal exercise in healthy persons. However, it should be noted that the slope of this linear relationship may vary considerably between skeletal muscles differing in fiber type composition (4, 34).
To achieve effective matching, the initial contributions of feedforward vasodilatory and pressor mechanisms are thought to be fine-tuned by subsequent O2D:demand mismatch-sensing feedback mechanisms (42). This would predict that when metabolic demand is increased under conditions of reduced exercising muscle perfusion pressure, a greater vasodilatory and potentially pressor response would occur to achieve O2D:demand matching. This has been previously observed during leg extension as well as forearm handgrip exercise in rest-to-submaximal exercise transitions (27, 33). However, more recently we have established the existence of distinct compensator phenotypes (5). We found that while compensatory vasodilation occurred during progressive increases in work rate under reduced perfusion pressure in some individuals, this compensation was inadequate at higher exercise intensities. More importantly, it was completely absent in other individuals, resulting in greater hypoperfusion. As a result, these individuals with a “noncompensator” phenotype experienced a greater compromise to exercise performance. Interestingly, we also found no pressor compensation in either phenotype even at higher exercise intensities despite compromised forearm perfusion. The manifestation of exacerbated compromise to exercise performance in the noncompensator phenotype, and the lack of pressor compensation during hypoperfusion, speaks to the importance of understanding interindividual differences in the mechanisms governing O2D:demand matching in response to challenges in O2D.
However, this previous work (5) challenged O2D:demand matching by performing incremental increases in exercising muscle work rate, and therefore metabolic demand, under fixed control vs. reduced perfusion pressure conditions. This challenged both feedforward (e.g., compression-evoked rapid vasodilation) and feedback mechanisms associated with hyperemic adjustment to increased demand for oxygen. It remains unknown whether compensator and noncompensator vasodilator phenotypes are evident when O2D is suddenly reduced during exercise at a fixed metabolic demand and whether the presence or absence of compensatory vasodilation determines the occurrence of a compensatory pressor response. A manipulation of perfusion pressure during steady-state exercise creates a sudden O2D:demand mismatch to which only feedback mechanisms would respond and therefore differs fundamentally from our previous study (5).
Prior studies investigating cardiovascular responses to sudden O2D compromise during steady-state exercise have assessed findings at the group level and yielded conflicting results. In animal models, terminal aortic cuff inflation resulted in a pressor response restoring ~50% of the flow deficit, with evidence for some additional exercising hindlimb vasodilation contribution (37). In humans, constant-work rate exercise with steady-state compromises to muscle blood flow imposed by intra-arterial balloon inflation (10) or steady-state perfusion pressure reductions during constant-work rate exercise (43) result in partial (10) or nonexistent (43) compensatory vasodilation when analyzed at the group level. On the basis of our previous phenotype identification work (5), we propose that the distribution of phenotypes within a particular study participant sample might contribute to conflicting observations, supporting the need to determine the existence of response phenotypes with sudden compromises to O2D in exercise.
The primary aim of the present study was therefore to utilize a sudden compromise to exercising muscle blood flow, which tasks feedback mechanisms associated with O2D:demand matching, to explore the potential for compensator and noncompensator vasodilation phenotypes and whether this determined the presence of a pressor response compensation. To provide greater insight into potential explanations of phenotype should we find them, our secondary aim was to determine whether vasodilator compensation phenotypes demonstrated characteristic differences in venous effluent, which could serve as indicators of the mechanisms that might contribute to compensatory vasodilation. In response to hypoxic exercise or hypoperfusion, nitric oxide (NO) (9, 11, 17) has been identified as a contributor to compensatory vasodilation. Meanwhile, the importance of potassium (K+) has been demonstrated in exercise hyperemia (18, 35) and rapid vasodilation (2). We therefore explored K+ and NO bioavailability via nitrite.
We hypothesized that both compensator and noncompensator vasodilator phenotypes would be evident, with the latter experiencing greater compromise to exercise performance. We also hypothesized greater nitrite and K+ in the compensator phenotype, suggesting a role for these mechanisms in explaining phenotype differences.
METHODS
Participants
Twenty-one recreationally active healthy men (21.6 ± 2.0 yr) with no history of smoking, cardiovascular disease, hypertension, or specific forearm training (e.g., tennis, racquetball) participated. It was confirmed that all participants avoided exercise for 24 h, caffeine for 12 h, and food consumption for 4 h before their laboratory visits. This study was approved by the Health Sciences Research Ethics Board at Queen’s University according to the terms of the Declaration of Helsinki. Procedures followed were in accordance with institutional guidelines. Each participant provided signed informed consent after receiving complete verbal and written descriptions of the experimental protocol and potential risks. On their first visit, participants underwent standard anthropometric assessments. Age, height, weight, exercising arm forearm girth, and exercising arm forearm volume were measured. A 7-day physical activity recall adapted from Sarkin et al. (39) was completed.
Instrumentation
Forearm blood flow.
To obtain forearm blood flow (FBF), a combination of echo and Doppler ultrasound was used. A 4-MHz pulsed flat Doppler probe (model 500V 131 transcranial Doppler; Multigon Industries, Mt. Vernon, NY) was attached to the skin over the brachial artery proximal to the antecubital fossa of the exercising arm to measure brachial artery blood velocity after the optimal location for the ultrasound signal was determined. A linear echo ultrasound probe positioned over the brachial artery, ~5 cm proximal to the flat Doppler probe, operating at 13 MHz in two-dimensional mode (Vivid i GE Medical Systems, London, ON, Canada) was used to image the diameter of the brachial artery in the exercising arm. During exercise, personnel experienced in the measurement of brachial artery blood flow velocity and imaging during exercise continually ensured that probe orientation adjustments eliminated movement artifact effects on signal quality and allowed optimal Doppler and echo signals.
Forearm venous blood sampling.
A 20- or 22-gauge intravenous catheter was inserted retrograde to venous blood flow into the antecubital vein. Confirmation that the selected vein drained the active forearm muscle was obtained via echo ultrasound imaging before catheterization. This provided blood samples of venous effluent from the exercising muscle without contamination from inactive tissues. Samples of venous effluent (2-ml discard and 1-ml sample) were obtained at specified intervals during exercise. Saline flushes were periodically completed to prevent the catheter from clotting.
Central hemodynamic measures.
A three-lead electrocardiogram with electrodes attached to the skin in standard CM5 placement was used to measure heart rate. A pulse oximeter (Nellcor N-395; Covidien-Nellcor, Boulder, CO) was placed over the index finger of the nonexercising hand and was used to measure arterial oxygen saturation () during exercise. A finger photoplethysmograph (Finometer MIDI; Finapres Medical Systems) on the middle finger of the nonexercising hand was used to measure arterial blood pressure and provide estimates of stroke volume and therefore cardiac output via Modelflow (Finapres Medical Systems).
Experimental Design
This was a within-participant repeated-measure design in which all participants completed 3 days of data collection (Fig. 1). Characterization of individual participants’ exercise responses occurred over 2 days, while phenotype identification was completed on a separate day. All data collection sessions were separated by at least 24 h. Each participant completed data collection at the same time of day for all collection sessions; however, time of day varied between participants. All data collections were completed in the supine position in a temperature-controlled room (19–21°C). The contraction/relaxation timing (2 s/2 s) and force production associated with isometric handgrip exercise were guided by visual force output and metronome cues.
Fig. 1.

Experimental design. Characterization of participants—day 1: A: perfusion pressure manipulation used to compromise oxygen delivery. B: incremental exercise to exhaustion in the control perfusion pressure (CPP) position for identification of peak work rate and peak hemodynamic response and work rate resulting in 70% of peak FVCVirtual. Schematic representation of work rate and vasodilatory responses indicated by light gray and dashed lines. respectively. Characterization of participants—day 2: C: reduced perfusion pressure (RPP) position exercise at 98 N repeated 3 times for identification of hemodynamic response to fixed submaximal metabolic demand. Schematic representation of work rate and vasodilatory responses indicated by light gray dashed and dark dashed lines, respectively. D: peak vasodilatory capacity assessment completed at heart level. Phenotype identification—day 3: E: phenotype identification protocol. This was repeated 3 times, and at completion of the 3rd repeat further incremental step increases in work rate to exhaustion were completed. Schematic representation of vasodilatory responses indicated by dark dashed line (noncompensator phenotype) and light gray dashed line (compensator phenotype). FAPP, forearm arterial perfusion pressure; FVC, forearm vascular conductance; BSL, baseline; MVC, maximum voluntary contraction; CV, compensatory vasodilation; NCV, noncompensatory vasodilation.
Perfusion pressure manipulation—compromising oxygen delivery.
To compromise O2D, local forearm arterial perfusion pressure (FAPP) was manipulated as described previously (5, 43) (Fig. 1A). In brief, at rest on the participant’s first visit the right arm was positioned both above and below heart level such that a measured 30-mmHg difference between arm positions was established. Moving the forearm from the below-heart (control perfusion pressure position, CPP) to the above-heart (reduced perfusion pressure position, RPP) position during steady-state exercise accomplished an immediate 30.7 ± 0.9-mmHg reduction in FAPP, and as a consequence FBF was immediately compromised.
Exercise protocols.
quantification of normal hemodynamic response to forearm exercise.
Three experimental protocols were performed to quantify the normal hemodynamic response to forearm exercise and the vasodilatory capacity of each participant. First, an incremental exercise test to exhaustion with the arm in the CPP position, as briefly described above, was completed to identify 1) the work rate at which 70% of the participant’s peak exercising vasodilation occurred, 2) the slope of the FBF (representing O2D) vs. work rate response, and 3) the peak FBF and exercise vasodilation response (Fig. 1B). Second, rest-to-exercise transitions at the same absolute work rate (98-N contraction force) (Fig. 1C) were performed to identify the amplitude of an individual’s O2D response to the same submaximal metabolic demand. Third, an ischemic forearm exercise test (Fig. 1D) was performed to identify peak vasodilatory capacity.
quantification of compensatory response to perfusion pressure reduction during constant-work rate exercise.
Participants completed constant-work rate forearm exercise at an exercise work rate that evoked 70% of their peak virtual forearm vascular conductance (FVCVirtual) (Fig. 1E). Exercise began in the CPP arm position. After 13 min the arm was raised into RPP during a 2-s contraction to initiate the reduction in FAPP and exercise continued for 5 more minutes. This was followed by ~40 min of rest, and then the same sequence was repeated two more times. After the completion of the third repeat, participants continued exercising as contraction force was increased by 24.5 N every 3.5 min until exhaustion.
We scaled the exercise work rate relative to exercise vasodilatory capacity (70% FVCVirtual) to ensure that the available reserve for vasodilation when hypoperfusion was evoked was consistent across individuals. We feel that this approach was critical to avoid potential interindividual differences in vasodilatory reserve influencing compensatory vasodilation responses, which might occur if we selected a percentage of peak work rate or, even worse, percentage of maximal voluntary contraction, which has been shown to have no relationship with exercising muscle aerobic capacity in the forearm exercise model (29).
To be confident in our identification of vasodilator phenotypes, we repeated these exercise trials three times within an individual. By performing measures in triplicate, we were able to confirm response consistency of an individual and by averaging these trials obtain a more precise estimate of the individual’s response and thereby confidently classify an individual as a compensator or noncompensator vasodilator phenotype.
Data Acquisition
Normal hemodynamic response to forearm exercise.
Incremental exercise data were obtained during the last 40 s of each completed work rate as previously described (5). Rest-to-exercise transitions and ischemic exercise data were obtained on a beat-by-beat basis and time aligned according to exercise duty cycle.
Compensatory response to perfusion pressure reduction—phenotype identification.
All central hemodynamic and FBF responses were obtained on a beat-by-beat basis and averaged into 4-s duty cycle time bins within each trial. All three trials were averaged to yield one response. Venous effluents were obtained at rest, every 15 s during the onset of exercise in a given arm position, and at minutes 3, 4, and 5 within an arm position. All central hemodynamic and FBF responses were computed at the venous sampling intervals.
Data Analysis
Calculated cardiovascular variables.
FBF was calculated as mean blood velocity (cm/s)·60 s/min·π [brachial artery diameter (cm)/2]2. FVCVirtual, which represents the pressure/flow relationship in a vascular bed resulting from the interaction of vasodilation and mechanical forces of muscle contraction, was calculated as FBF/FAPP × 100 mmHg. FVCRelax quantifies the pressure/flow relationship during relaxation between contractions resulting solely from vasodilation and was calculated as FBFRelax/FAPP × 100 mmHg as described previously (43). 70% FVCVirtual was calculated as (Peak FVCVirtual – Resting FVCVirtual) × 0.7 + resting FVCVirtual (40). Arterial oxygen content () was calculated from (%·[Hb]·1.34) + 0.003·, where % is arterial hemoglobin saturation (fraction), [Hb] is hemoglobin concentration (g/ml) in the blood, 1.34 is the mean volume of O2 that can be bound to 1 g of normal Hb when fully saturated, 0.003 is the solubility of O2 in human plasma, and is the partial pressure of O2 in the arterial blood. was assumed to be 100 mmHg. The venous hemoglobin saturation (%) from the venous effluent allowed for the calculation of venous oxygen content (). Oxygen consumption (V̇o2) was calculated with the Fick equation as FBF × ( − ). O2D was calculated from FBF × .
Venous effluent—blood gases, electrolytes, and plasma nitrite concentration.
All venous effluents were analyzed with a blood gas analyzer (Stat Profile Prime Blood Gas Analyzer; Nova Biomedical, Mississauga, ON, Canada) for standard blood gases and electrolytes.
During phenotype identification, exercising venous effluent was sampled into 4.5-ml lithium-heparin Vacutainers at resting baseline and during steady exercise in both CPP and RPP positions. Samples were inverted 8–10 times and centrifuged within ~1 min at 1,050 g and 4°C for 10 min. Plasma was extracted, divided into aliquots, and immediately frozen at −80°C for subsequent analysis. All plasma nitrite analysis was completed in triplicate, and a mean was obtained. Potassium iodide in acetic acid was used for nitrite analysis given its specificity to convert nitrite, but not other nitrogen species (nitrate, S-nitrosothiols), into NO (30). After the reaction equilibration, headspace samples were obtained with an airtight syringe and injected into a NO analyzer (Sievers NOA280i; GE Analytical Instruments, Boulder, CO) for quantification of NO via chemiluminescence (7).
Post hoc identification of compensator vs. noncompensator vasodilator phenotype.
To identify a participant as having or not having compensatory vasodilation in response to a sudden reduction in FAPP, we compared the vasodilation during steady-state exercise in the CPP and RPP positions. For each participant, three trials were averaged to produce one consistent, characteristic, cardiovascular response. Steady-state vasodilations (FVCRelax) within each arm position were compared with the a priori hypothesis that vasodilation would be greater in RPP compared with CPP exercise. Participants were then grouped into either compensator or noncompensator vasodilator phenotype for subsequent analysis and interpretation.
Statistical Analysis
Normal hemodynamic response to forearm exercise.
Unpaired Student’s t-tests were used for comparison of compensatory vasodilation phenotypes (see Table 2, Fig. 3). Slope analysis and intercept analysis were completed between compensatory vasodilation phenotypes to determine whether there was a difference in the proportional increase or starting point for all variables during incremental exercise to exhaustion in CPP.
Table 2.
Age, activity levels, and anthropometric measures in compensatory vasodilation phenotypes
| Variable | Compensators (n = 13) | Noncompensators (n = 8) |
|---|---|---|
| Age, yr | 21.8 ± 2.2 | 21.2 ± 1.8 |
| Height, cm | 180.8 ± 7.0 | 182 ± 6.1 |
| Weight, kg | 77.9 ± 7.8 | 76 ± 4.2 |
| Forearm volume, ml | 1,085.5 ± 158.3 | 1,046.8 ± 119.2 |
| Forearm girth, cm | 27.6 ± 1.7 | 27.3 ± 1.2 |
| 7-Day PAR score, METs/wk | 260.3 ± 27.4 | 271.5 ± 22.7 |
Values are means ± SD. PAR, Physical Activity Recall; MET, metabolic equivalent. There were no statistically significant differences between groups (P > 0.05).
Fig. 3.
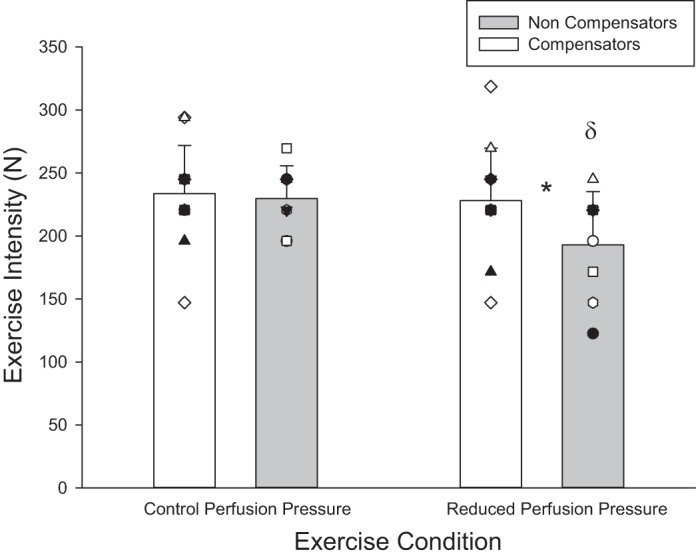
Peak exercise performance. Peak exercise performance in control perfusion pressure (CPP) and reduced perfusion pressure (RPP) conditions in compensatory vasodilation and noncompensatory vasodilation phenotypes. Individual responses are represented by symbols; mean responses are represented by bars. *Statistically significant difference between compensatory and noncompensatory vasodilation phenotypes within arm position (P < 0.05). δStatistically significant difference between arm positions within compensatory vasodilation phenotypes (P < 0.05).
Compensatory response to perfusion pressure reduction—phenotype identification.
A one-tailed paired Student’s t-test was completed for each participant using FVCRelax measures from the last 10 duty cycles in each arm position to determine the presence or absence of compensatory vasodilation. A paired Student’s t-test was completed for each participant using mean FBF measures from the last 10 duty cycles to determine the effect of reduced forearm perfusion pressure on muscle blood flow (Table 1).
Table 1.
Phenotype identification—vasodilatory and flow responses after perfusion pressure compromise and their resulting level of significance
| Subject | FVCRelax, ml·min−1·100 mmHg−1 | FVCRelax P Value | FBF, ml/min | FBF P Value |
|---|---|---|---|---|
| Noncompensatory vasodilator phenotype (n = 8) | ||||
| B | 448 vs. 461 | 0.41 | 232 vs. 173 | 1.11E-03 |
| E | 604 vs. 611 | 0.32 | 415 vs. 333 | 0.06 |
| H | 987 vs. 988 | 0.46 | 667 vs. 506 | 3.61E-03 |
| O | 662 vs. 677 | 0.32 | 369 vs. 376 | 0.31 |
| Q | 556 vs. 514 | 1.00 | 300 vs. 251 | 2.98E-04 |
| R | 785 vs. 787 | 0.30 | 425 vs. 347 | 3.52E-05 |
| U | 695 vs. 715 | 0.24 | 386 vs. 326 | 8.0E-03 |
| W | 567 vs. 584 | 0.13 | 412 vs. 361 | 7.92E-05 |
| Avg ± SD | 663 ± 165 vs. 667 ± 167 | 0.591 | 400 ± 126 vs. 334 ± 96* | 0.005 |
| Compensatory vasodilator phenotype (n = 13) | ||||
| C | 461 vs. 655 | 1.38E-06 | 292 vs. 334 | 5.52E-04 |
| D | 512 vs. 734 | 7.14E-09 | 289 vs. 377 | 7.92E-06 |
| G | 478 vs. 587 | 1.72E-04 | 329 vs. 355 | 0.05 |
| I | 453 vs. 574 | 4.29E-06 | 321 vs. 347 | 0.01 |
| J | 470 vs. 646 | 2.00E-07 | 307 vs. 297 | 0.20 |
| L | 687 vs. 873 | 4.44E-08 | 409 vs. 449 | 0.11 |
| M | 490 vs. 533 | 3.12E-04 | 378 vs. 326 | 2.18E-06 |
| N | 470 vs. 533 | 1.21E-04 | 265 vs. 277 | 0.03 |
| P | 468 vs. 610 | 3.73E-06 | 279 vs. 283 | 0.37 |
| S | 850 vs. 938 | 8.76E-05 | 468 vs. 428 | 0.15 |
| T | 494 vs. 559 | 1.23E-04 | 355 vs. 355 | 0.49 |
| X | 477 vs. 574 | 4.80E-10 | 360 vs. 362 | 1.09E-08 |
| Y | 313 vs. 381 | 4.12E-05 | 275 vs. 287 | 0.05 |
| Avg ± SD | 509 ± 128 vs. 632 ± 146* | 4.67E-05 | 332 ± 59 vs. 344 ± 53 | 0.276 |
Values presented for each participant are the means of the 3 trials.
Statistically significant difference between reduced perfusion pressure (RPP) and control perfusion pressure (CPP) steady-state exercise.
To compare the cardiovascular responses between compensatory vasodilation phenotypes from CPP steady state and RPP steady state, a mixed-model (compensatory vs. noncompensatory vasodilator) one-way repeated-measures (time of measure) ANOVA was used (see Table 3, Figs. 4, 5, and 6). An unpaired t-test was used to compare the mean differences from CPP to RPP steady-state exercise between compensatory vasodilation phenotypes (see Figs. 4, 5, and 6).
Table 3.
Absolute responses during phenotype identification at resting baseline, CPP SS, and RPP SS for compensatory and noncompensatory vasodilators
| Compensators (n = 13) |
Noncompensators (n = 8) |
|||||
|---|---|---|---|---|---|---|
| Variable | BSL | CPP SS | RPP SS | BSL | CPP SS | RPP SS |
| , ml O2/100 ml | 18.4 ± 0.7 | 18.9 ± 0.7* | 19.2 ± 0.8# | 18.5 ± 0.6 | 19.0 ± 0.7* | 19.4 ± 0.9 |
| , ml O2/100 ml | 13.6 ± 2.0 | 9.4 ± 1.3* | 8.9 ± 1.8 | 14.1 ± 1.8 | 10.1 ± 1.9* | 10.1 ± 2.1 |
| a-vO2, ml O2/100 ml | 4.8 ± 1.8 | 9.5 ± 1.2* | 10.1 ± 1.5 | 4.4 ± 1.7 | 8.9 ± 1.4* | 9.3 ± 1.4 |
| HR, beats/min | 58 ± 8 | 66 ± 9* | 69 ± 10# | 55 ± 7 | 66 ± 8* | 69 ± 10# |
| SV, ml/beat | 103 ± 16 | 102 ± 16 | 103 ± 14 | 105 ± 10 | 104 ± 14 | 103 ± 14 |
| CO, l/min | 6.0 ± 1.2 | 6.7 ± 1.5* | 7.1 ± 1.6# | 5.8 ± 0.9 | 6.8 ± 1.3* | 7.1 ± 1.6# |
| , nmol/l | 27 ± 14 | 29 ± 15 | 28 ± 12 | 25 ± 17 | 22 ± 15* | 20 ± 9 |
| K+, mmol/l | 3.6 ± 0.2 | 4.4 ± 0.2* | 4.3 ± 0.2 | 3.7 ± 0.3 | 4.4 ± 0.3* | 4.3 ± 0.1 |
| La−, mmol/l | 0.8 ± 0.3 | 1.7 ± 0.6* | 1.5 ± 0.5 | 0.8 ± 0.2 | 1.9 ± 0.8* | 2.3 ± 1.4 |
| , % | 72 ± 9 | 48 ± 8* | 45 ± 9 | 75 ± 9 | 53 ± 8* | 51 ± 9.0 |
Values are means ± SD. BSL, baseline; CPP SS, control perfusion pressure condition steady state; RPP SS, reduced perfusion pressure condition steady state; , arterial oxygen content; , venous oxygen content; a-vO2, arteriovenous oxygen content difference; HR, heart rate; SV, stroke volume; CO, cardiac output; , plasma [nitrite]; K+, plasma [potassium]; La−, plasma [lactate]; , venous hemoglobin saturation with oxygen. Significance set at P < 0.05.
Statistically significant change from previous point within a compensatory vasodilation phenotype (P < 0.05).
Statistically significant difference between CPP SS and RPP SS within a compensatory vasodilation phenotype (P < 0.05).
Fig. 4.

FBF and its determinants during phenotype identification protocol at key exercising time points. A: FBF. B: FVCVirtual. C: mean arterial blood pressure (MAP). Individual responses are represented by symbols; mean responses are represented by bars. *Statistically significant difference between compensatory and noncompensatory vasodilation phenotype (P < 0.05). #Statistically significant difference between reduced perfusion pressure (RPP) and control perfusion pressure (CPP) positions at steady state within a compensatory vasodilation phenotype (P < 0.05). DELTA, change from CPP to RPP.
Fig. 5.

FBFRelax and its determinants during phenotype identification protocol at key exercising time points. A: FBFRelax. B: FVCRelax. C: FAPP. Individual responses are represented by symbols; mean responses are represented by bars. *Statistically significant difference between compensatory and noncompensatory vasodilators (P < 0.05). #Statistically significant difference between reduced perfusion pressure (RPP) and control perfusion pressure (CPP) positions at steady state within a compensatory vasodilation phenotype (P < 0.05). DELTA, change from CPP to RPP.
Fig. 6.

V̇o2 and its determinants during phenotype identification protocol at key exercising time points. A: V̇o2. B: FBF. C: arteriovenous oxygen content difference (a-vO2). Individual responses are represented by symbols. Mean responses are represented by vertical bars. *Statistically significant difference between compensatory and noncompensatory vasodilators (P < 0.05). #Statistically significant difference between reduced perfusion pressure (RPP) and control perfusion pressure (CPP) positions at steady state within a compensatory vasodilation phenotype (P < 0.05). DELTA, change from CPP to RPP.
Repeatability of multiple exercise trials.
A mixed-model (compensatory vs. noncompensatory vasodilator) one-way repeated-measures (exercise trial) ANOVA was used to determine whether exercising work rate during phenotype identification and during fixed exercise at 98 N was different between compensatory vasodilation phenotypes. Each subject completed three trials of the phenotype identification protocol. Utilizing the mean of these three trials and the trial-to-trial coefficient of variation [CV; dividing the standard deviation of the 3 trials by the mean of the 3 trials and then multiplying by 100 (26)] of these trials for each participant, we ran a modified Monte Carlo simulation to determine the repeatability between the means of three trials within each participant, and thereby to identify the limits of differences between means that are likely due to chance.
For all analyses, the level of significance was set at P < 0.05. Only significant F-statistics within the ANOVA were further assessed with Tukey’s post hoc tests. All assumptions of the repeated-measures ANOVA were met. In instances when sphericity was violated, a Greenhouse-Geisser correction was applied when interpreting F-statistics. Statistics were calculated with a combination of SigmaPlot 12.0 (Systat Software), SPSS 20 (IBM Software), and GraphPad Prism 6 (GraphPad Software). All results are presented as means ± SD unless otherwise noted.
RESULTS
Phenotype Identification—Exercise Trials in Triplicate
For FVCRelax, which was used to identify compensatory vasodilation phenotypes, the Monte Carlo simulation for the CV of means obtained by averaging three trials was calculated for each individual. We found an overall CV of these means for FVCRelax of 2.8 ± 0.4% in CPP and 2.7 ± 0.2% in RPP. In Fig. 2, the average CV (2.75%) and 1.96 × 2.75% are indicated. The ±1.96 × CV would represent the limits within which differences between CPP and RPP that could be due to chance would fall 95% of the time. All noncompensators show differences in FVCRelax between CPP and RPP that do not exceed +1 CV. In contrast, all compensators show differences well in excess of +1.96 × CV, consistent with their respective classifications as noncompensators and compensators.
Fig. 2.
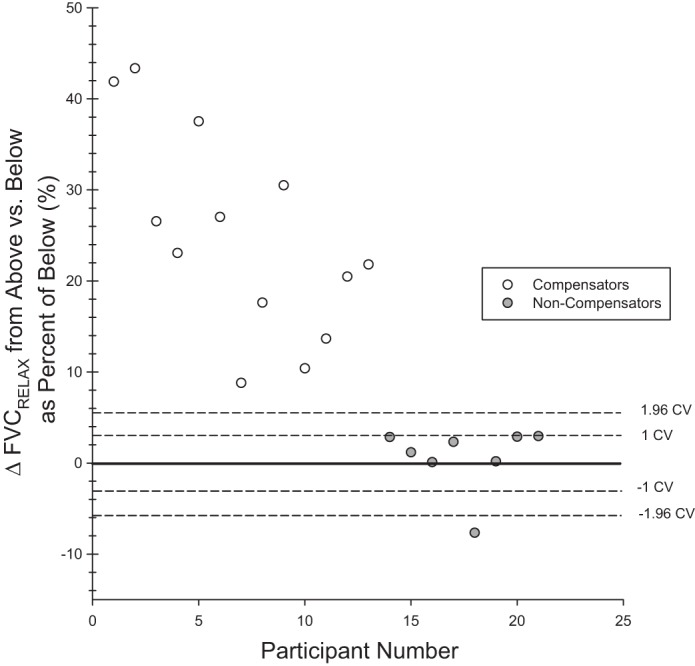
Phenotype identification. Dashed lines correspond to ±1 and 1.96 times the coefficient of variation (CV) of mean values obtained from averaging 3 trials (see results). Each data point represents the difference of RPP FVCRelax from CPP FVCRelax as a % for 1 participant. The participants for whom this difference is within the ±1.96 dashed lines therefore have a FVCRelax that is different in RPP compared with CPP by an amount that, 95 times out of 100, would be due to chance. In this regard, the noncompensators fall at or below the +1 CV, and the compensators are well above the +1.96 CV.
There was no difference in the average force production of the three submaximal-work rate exercise trials completed during phenotype identification between RPP and CPP (149 ± 23 vs. 150 ± 23 N), between the three exercise trials within RPP (148 ± 22 vs. 147 ± 25 vs. 150 ± 22 N) and CPP (151 ± 25 vs. 148 ± 23 vs. 151 ± 21 N), between the three exercise trials within RPP at 98 N (101 ± 20 vs. 101 ± 21 vs. 101 ± 20 N), or between compensatory vasodilation phenotypes during any submaximal trial repeat (all P > 0.05; data not shown).
Phenotype Identification Protocol—Perfusion Pressure Reduction During Constant-Work Rate Exercise
A sudden compromise in perfusion yielded two clear and disparate vasodilatory responses. Thirteen individuals responded with compensatory vasodilation, while eight individuals responded without any compensatory vasodilation (see Table 1 and Fig. 2 for individual response details). Participants were grouped accordingly for all subsequent analyses.
Characterization of Participants—Were Vasodilatory Response Phenotypes Similar?
There was no difference between the two compensatory vasodilation phenotypes for age, anthropometric data, and activity levels (Table 2).
With regard to normal exercise responses, progressive exercise to exhaustion in CPP yielded no differences between compensatory vasodilators vs. noncompensators in peak FBF (690 ± 188 vs. 614 ± 202 ml/min, P = 0.4), peak FVCVirtual (491 ± 156 vs. 464 ± 130 ml·min−1·100 mmHg−1, P = 0.7), and peak V̇o2 (62 ± 15 vs. 57 ± 15 ml O2/min, P = 0.4). Slope analysis revealed no difference in the magnitude of increase per unit increase in work rate for these variables (all P > 0.2; data not shown). Peak work rate was not different between compensatory and noncompensatory vasodilators (233 ± 38 vs. 230 ± 26 N, P = 0.8; Fig. 3, CPP condition), and neither was the work rate associated with 70% FVCVirtual (154 ± 23 vs. 168 ± 30 N; P = 0.3; data not shown).
In the constant-work rate test at 98-N contraction force, which was performed with the forearm in the RPP position, there was no difference in steady-state responses of compensatory vasodilators vs. noncompensators for FBF (196 ± 52 vs. 195 ± 60 ml/min; P = 1), FVCVirtual (256 ± 83 vs. 266 ± 86 ml·min−1·100 mmHg−1; P = 0.8), and V̇o2 (18 ± 9 vs. 21 ± 9 ml O2/min; P = 0.5) (data not shown).
Finally, there was no difference in peak vasodilatory capacity between compensatory vasodilators and noncompensators in the ischemic exercise protocol (951 ± 224 vs. 920 ± 364 ml·min−1·100 mmHg−1; P = 0.8); data not shown).
Perfusion Pressure Reduction During Constant-Work Rate Exercise—Hemodynamic and Exercise Performance Implications
In steady-state RPP vs. CPP, the noncompensator vasodilator phenotype experienced a compromise whereas the compensator vasodilator phenotype did not for FBF (−66.5 ± 47.1 vs. 11.4 ± 36 ml/min; P < 0.001) (Fig. 4) and FBFRelax (−119 ± 60.4 vs. −18.6 ± 60.4 ml/min; P = 0.002) (Fig. 5). The same was the case for V̇o2 (−5.0 ± 8.2 vs. 3.0 ± 5.5 ml O2/min; P = 0.02) (Fig. 6) and O2D (−11.7 ± 9.6 vs. 1.6 ± 7.0 ml O2/min; P = 0.001). Both phenotypes experienced a pressor response that was not different (9.7 ± 9.5 and 5.5 ± 5.5 mmHg) (P = 0.2). Peak exercise performance with the arm in RPP was reduced in the noncompensator vasodilator phenotype (−36 ± 29 N; P = 0.009), while it was maintained in the compensatory vasodilator phenotype (−6 ± 14 N; P = 0.2) (Fig. 3). There was no difference between vasodilation phenotypes in any central hemodynamic responses (all P > 0.05). Heart rate and cardiac output were increased in RPP steady state compared with CPP steady state in both vasodilation phenotypes (all P < 0.05) (Table 3).
Venous Effluent—Plasma K+, Nitrite, and Lactate Concentrations and Venous Saturation
At rest, CPP steady state and RPP steady state there were no differences in [K+], plasma [nitrite], or [lactate] (all P > 0.05; Table 3). Furthermore, the decrease in % from CPP steady state to within 15 s of repositioning the forearm to RPP was significant within both phenotypes (P < 0.01) and not different between compensators and noncompensators (−11 ± 9 vs. −9 ± 6%; P = 0.5).
DISCUSSION
With the onset of exercise, increased metabolic demand for oxygen requires coordinated adjustments in blood pressure regulation and skeletal muscle vasodilation to support muscle blood flow. Locally, feedback mechanisms in exercising muscle are thought to respond to the imbalance between O2D and demand and adjust vascular conductance and arterial blood pressure accordingly (42). This would predict that when a compromise to muscle blood flow is created during exercise, a vasodilatory and/or a pressor response would occur to restore O2D. However, we recently reported that while some individuals responded with compensatory vasodilation during an incremental forearm exercise test to exhaustion performed under reduced perfusion pressure conditions, compensation was completely absent in others (5). Importantly, the noncompensators suffered a greater compromise to their exercise performance. In the present study, we tested the hypotheses that both compensator and noncompensator phenotypes are evident when O2D is suddenly reduced during steady-state exercise and that noncompensators would suffer greater compromise to exercise performance. The primary findings of the study were as follows: 1) Perfusion pressure-induced compromises to exercising FBF resulted in compensatory vasodilation in certain individuals (n = 13) and complete absence thereof in other individuals (n = 8). 2) Presence or absence of compensatory vasodilation did not impact the occurrence, magnitude, or effectiveness of the compensatory pressor response that partially restored exercising FBF. 3) Individuals with compensatory vasodilation protected O2D and exercise performance when perfusion pressure was reduced, while noncompensators suffered compromises to both. 4) Compensators and noncompensators were indistinguishable in their adjustment of O2D to increases in metabolic demand during incremental increases in work rate, a transition from rest to fixed submaximal metabolic demand, and their maximal vasodilatory capacity.
As a whole, these findings are consistent with our hypothesis that compensator and noncompensator vasodilation phenotypes are evident when muscle blood flow is compromised during steady-state exercise and furthermore that the noncompensator suffers compromise to exercise performance while the compensator is able to defend exercise performance. These findings are significant for advancing our understanding of O2D:demand matching in exercising muscle for at least two reasons. First, they have established the importance of considering O2D:demand matching at the individual level even in young healthy individuals, as interindividual differences can exist that can contribute to exercise performance. Second, given that phenotypes were indistinguishable in their O2D response to increases in work rate (metabolic demand), within the context of required O2D:demand matching these results suggest that mechanisms obligatory for compensatory vasodilation when exercising muscle blood flow is compromised can independently differ between individuals from the mechanisms adjusting vasodilation in response to an increase in metabolic demand.
Identification of Compensatory Vasodilation Phenotypes
To identify vasodilator phenotypes we employed a novel experimental design and analysis approach. Our multiple-repeat experimental design minimized the contribution of natural fluctuations to our observed cardiovascular responses and allowed us to establish response consistency within an individual. By completing a modified Monte Carlo simulation, we were able to determine that, given our present degree of variability, mean responses from triplicates vary by only ~3%. Therefore we are confident in our identification of two distinct vasodilatory response phenotypes (12, 26). The RPP vs. CPP difference in FVCRelax for each individual identified in the noncompensator phenotype group fell within ±1 CV (with the exception of 1 participant who experienced an FVCRelax that was actually reduced), while participants comprising the compensator phenotype were well above 1.96 × CV.
The observation of perfusion compensation within individuals is in line with the current understanding of O2D:demand matching. In this scenario, healthy individuals will, in response to an O2D challenge, initiate feedback mechanisms that elicit compensatory vasodilation that serves to restore O2D:demand matching (22). However, in 38% of our subjects no such compensation was present. This proportion of noncompensators is in line with our previous study examining compensatory responses during an incremental exercise test to exhaustion (5). This noncompensator response is inconsistent with the current understanding of O2D:demand matching.
What is particularly striking about our findings is that the noncompensator phenotype O2D:demand matching response to an increase in metabolic demand was indistinguishable from the compensator phenotype, as vasodilatory, hyperemic, and pressor responses were not different between phenotypes. Furthermore, the magnitude of the response to a step increase in metabolic demand from rest in the RPP position was indistinguishable between response phenotypes. Thus if exercise was initiated under a reduced perfusion pressure condition, the noncompensator had no compromise to O2D:demand matching compared with the compensator. Finally, the noncompensator phenotype had the same vasodilatory capacity as evidenced by the same peak FVC in exercise and in response to ischemic exercise designed to evoke maximal vasodilation. So they were not limited by a reduced capacity for vasodilation. This study, coupled with our previous work (5), is the first to identify that some healthy young individuals present with a complete absence of compensatory vasodilation with a perfusion pressure challenge to O2D:demand matching in contracting forearm muscles. Yet they experience no compromise to vasodilation when it occurs in response to an increase in metabolic demand.
Potential Mechanisms Accounting for Vasodilatory Compensation vs. Noncompensation
A secondary aim of this study was to identify signaling components of vasodilatory mechanisms that might explain why an individual does vs. does not compensate. In this regard we were limited to sampling venous effluent draining the exercising muscle and therefore investigated three candidates: nitrite-derived NO, K+, and red blood cell (RBC) desaturation as a stimulus for ATP release.
NO plays a large role in compensatory vasodilation under systemic hypoxia (11) and active skeletal muscle hypoperfusion (9). As endothelial nitric oxide synthase production of NO is oxygen dependent, a reduction in oxygenation due to hypoperfusion would not be expected to trigger increased NO release from the endothelium. In contrast, deoxygenated Hb acts to convert nitrite to NO, and therefore greater deoxygenation acts as a stimulus for this mechanism (13). As such, we hypothesized that differences in nitrite bioavailability between compensators and noncompensators might account for their disparate compensatory vasodilation responses. However, we observed no differences in exercising forearm deep venous plasma nitrite levels between the two compensatory vasodilation phenotypes in response to the perfusion pressure challenge. These results do not support differences in nitrite-specific NO bioavailability as being responsible for perfusion pressure-induced compensatory vasodilation. However, such venous effluent data cannot conclusively rule out such a contribution, and thus further, more invasive investigation may be warranted. Furthermore, these data do not discount contributions of endothelium-derived sources of NO, which has been implicated in compensatory vasodilation (9, 11) and which therefore could be responsible for lack of compensatory dilation in that phenotype (i.e., compromised endothelial nitric oxide synthase production of NO with decreasing oxygenation).
Sudden reductions in flow stemming from a rapid perfusion pressure reduction would be expected to reduce the removal of K+ from the interstitial space. The resulting accumulation of K+ associated with muscle contraction could serve to stimulate inward-rectifying potassium channels () and elicit vasodilation. We therefore hypothesized that K+, a vasodilatory metabolite typically associated with rapid vasodilation (15), could also contribute to the compensatory response. We observed K+ concentrations during steady state in CPP and RPP that were not different. These results suggest that K+ is not involved in perfusion pressure-induced compensatory vasodilation, as steady-state concentrations in both CPP and RPP were not different between vasodilation phenotypes.
The RBC as oxygen sensor hypothesis has gained recognition in recent years as a potential mechanism for matching O2D to metabolic demand. As RBC Hb oxygen saturation decreases with increased contracting skeletal muscle oxygen demand relative to supply, conformational changes in Hb can result in the release of NO (19, 41), and ATP (20, 31, 32), evoking local vasodilation and thereby aiding in establishing adequate perfusion (21). Compelling support for this hypothesis was provided by the identification of RBCs as the origin of intravascular sources of ATP during exercise (31, 32). ATP appears to evoke vasodilation almost exclusively via , as blockade of these channels has recently been shown to abolish desaturation-related ATP-mediated vasodilation (14) while there appears to be only a modest role for NO (16).
We therefore hypothesized that greater reductions in % in the exercising forearm would contribute to compensatory vasodilation and facilitate O2D:demand matching. However, we observed no difference between compensatory and noncompensatory phenotypes in the further reduction in % immediately upon transition from CPP steady state to RPP (−11 ± 9 vs. −9 ± 6%). Given that plasma ATP and Hb desaturation are linearly related (21), this would have served as the relevant stimulus magnitude for increasing RBC NO and ATP release. Consequently, we would have expected to see similar vasodilation in both phenotypes. We speculate that the lack of compensatory vasodilation in the noncompensators might therefore indicate compromised RBC NO and/or ATP release in response to Hb desaturation. If this is the case, then the observation that noncompensators had the same O2D response to increased work rate as compensators suggests that redundant vasodilatory control may compensate under those conditions. In contrast, when O2D:demand matching is disrupted during steady-state exercise by sudden reduction in O2D, there is inadequate redundancy because compensatory dilation relies only on feedback mechanisms related to reduced oxygenation. Certainly, the finding in the noncompensator phenotype of intact O2D:demand matching when increased oxygen demand creates a mismatch but not when that mismatch is due to decreased O2D suggests that transduction of the mismatch into vasodilation depends on how the mismatch is created.
We should qualify the above discussion by acknowledging that there may be other deoxygenation- or hypoperfusion-specific mechanisms that could contribute to compensatory vasodilation such as adenosine (8). Unfortunately, as we were unable to measure related biomarkers, we cannot comment on their potential involvement in explaining the noncompensator phenotype.
Compensatory Vasodilation vs. Compensatory Pressor Response
The present experimental data set revealed distinctly clear compensatory vasodilation in certain individuals, while there was a complete absence in others. In response to exercise in CPP, both compensatory and noncompensatory vasodilation phenotypes had a cardiac output-mediated increase in pressure (12.2 ± 7.1 vs. 10.0 ± 4.5 mmHg; P = 0.4). After the transition to RPP, both phenotypes once again had a cardiac output-mediated pressor response (6.1 ± 5.8 vs. 10.4 ± 9.4 mmHg; P = 0.2), as cardiac output increased with exercise but total vascular conductance remained stable (data not reported). However, the magnitude of the pressor response was completely independent of compensatory vasodilation. Therefore, in our noncompensators the presence of a cardiac output-mediated pressor response partially restores perfusion; however, when evoked within the context of compensatory vasodilation we have complete restoration of perfusion.
Our previous work demonstrated no discernible compensatory pressor response within the noncompensatory phenotype, although it was clearly part of the inherent response to progressive exercise (5). Small-muscle mass models under mild-intensity exercise demonstrate no compensatory pressor response (10, 22). Animal models, on the contrary, have shown a compensatory flow restoring pressor response responsible for ~50% of the observed flow restoration in an effort to overcome terminal aortic cuff inflation during exercise (37). However, the magnitudes of the initial flow compromise in these studies were 45% (10) and graded reductions in content (therefore O2D) of 7% and 13% (22) during exercise at 5–10 kg in the forearm and 30 W in the leg, respectively. O’Leary et al. (37), who observed a pressor response in dogs, compromised flow by up to 40% during mild and moderate treadmill exercise. Our initial flow compromise was 33% during an intensity of 17 kg (equivalent to 70% of peak forearm vasodilation). There appears to be an interaction between the magnitude of flow compromise and exercise intensity in determining the presence of a pressor response. The contribution of a pressor response within the present model to the compensatory response could be attributed to the higher exercise intensity requiring less magnitude of compromise compared with previous small-muscle mass models (10, 22). Pressor activation in the present study could also stem from the longer duration of mismatch between delivery and demand and the accumulation of pressor-evoking signals increasing sympathetic activity in response to hypoperfusion (28).
Exercise Performance and Compensatory Vasodilation
During exercise in RPP, compensators maintained exercise performance while noncompensators suffered a reduction (−6 vs. −36 N, respectively). In understanding the implications of compensatory vasodilation, compensators restored perfusion, and therefore O2D, to their original CPP target perfusion after perfusion pressure manipulation while noncompensators did not. In the present model, work rate and therefore metabolic demand was consistent across perfusion manipulations. Therefore in noncompensators uncompensated reductions in perfusion would require greater relative [ADP] and [Pi] to maintain a given V̇o2 (3, 24). Throughout the duration of the 5 min of RPP exercise, increased glycolytic flux relative to oxidative phosphorylation could be contributing to energy production, and therefore could compromise intracellular homeostasis in comparison to compensators. After the completion of exercise, an accumulated oxygen deficit could be increasing the rate of fatigue progression during subsequent progressive increases in work rate (25). Consistent with the role of oxygen in muscle fatigue, exercise performance was negatively affected in noncompensators who suffered from perfusion reductions (23).
Experimental Considerations
In the present study, our phenotype identification protocol was completed at the same relative intensity in relation to vasodilatory reserve for each participant and completed in triplicate. 1) In scaling the exercise intensity to vasodilatory reserve, we ensured that disparate responses would not be due to differences in the availability of vasodilation as a compensatory mechanism. In the end, there was not a statistically significant difference between phenotypes of the exercise intensity associated with 70% FVCVirtual. 2) In completing triplicate assessments we were able to minimize the contribution of natural fluctuations to an observed response and gain confidence in our classification of phenotypes. Indeed, the Monte Carlo simulation identified a CV between means derived from averaging three trials of only ~3%. This means that when we take three trials for a subject and obtain their mean, this mean will typically vary from a subsequent three-trial mean by ~3%. Figure 2 illustrates that differences in vasodilation magnitude of RPP relative to CPP steady state for noncompensators were all below +1 standard deviation of the CV of no vasodilation. In contrast, compensators were all well above +1.96 × CV. Therefore, if we were to complete the study again, we are confident that the present identification of compensatory vasodilation phenotypes would hold true given the present level of variability.
We report that within the noncompensator phenotype there is no compensatory vasodilation when FBF is reduced after forearm repositioning in the RPP position, whereas compensators demonstrate a vasodilatory response. However, both FBF and FVC are the same between phenotypes in the RPP steady state. Therefore, it might be argued that vasodilation in RPP in the noncompensators is not compromised. Rather, perfusion and vasodilation in CPP steady state appear to be in excess (see Figs. 4 and 5). A number of observations argue strongly against this and in favor of the interpretation that there is indeed a relative hypoperfusion in the noncompensators in the RPP position.
First, we had also characterized the FBF response to a fixed work rate and to progressive increases in work rate under a constant-forearm perfusion pressure condition. There were no differences between phenotypes in their FBF increase per unit work rate. In other words, when metabolic demand was increased, noncompensators were indistinguishable from compensators in their O2D:demand matching.
Second, it is important to recognize that the FVC is the vascular response to increased oxygen demand, which adjusts FBF (O2D) to match demand. The degree to which FVC increases is therefore not the regulated outcome, and the magnitude of FVC can be expected to vary between individuals or groups to achieve appropriate O2D:demand matching at a given exercise intensity in a given exercise condition. Once that has been established, any reduction in FBF represents relative hypoperfusion and would require compensatory responses to restore the original O2D:demand matching established when perfusion was adjusting to meet an increased metabolic demand. In this context it is also important to note that the apparent, but not statistically significant, difference in FBF and FVC in the CPP steady state between phenotypes (see Figs. 4 and 5) is driven by one subject.
Third, we know that the lack of compensatory vasodilation in the noncompensators meant that the same FVC in RPP steady state between groups did not mean that the adequacy of vasodilation was the same. This is because the noncompensators’ hypoperfusion relative to CPP steady state compromised their exercise performance.
In trying to assess the mechanism responsible for disparate levels of compensatory vasodilation, we were limited to venous effluents from the exercising muscle. In placement of our venous catheter we ensured that the catheter was threaded into a vein draining the active muscle so as to limit contamination from other tissue. Venous effluents are not an exact representation of the intravascular environment surrounding the active skeletal muscle. In cases where we were unable to detect a statistical difference between venous effluent constituents between phenotypes, it could be that our venous effluents are not sensitive to interstitial changes. Additionally, within our laboratory we are unable to obtain arterial samples. Therefore we are unable to quantify changes in vasoactive molecules from the arterial to the venous circulation. However, given the proportion of total blood volume perfusing the active forearm (~7%) and the magnitude of change of these molecules in venous effluent, potential changes in arterial vasoactive molecule concentration would be undetectable and therefore would not alter interpretation.
Differing durations of exercise in CPP and RPP were completed to allow for the preparation of venous samples for plasma [nitrite]. The selected duration of CPP exercise was the shortest time period needed for successful venous sample preparation, centrifugation, dividing into aliquots, and storage. Pilot work demonstrated that exercise at this intensity for this duration does not produce further elevations in the hemodynamic responses once steady state has been established in the first few minutes of exercise. As comparisons between arm positions were completed at the same time interval within an arm position, the differing lengths of exercise protocols are not a concern when interpreting our observations.
Conclusions
A sudden perfusion pressure compromise to exercising muscle perfusion elicited clear dichotomous vasodilatory responses. Certain individuals responded with compensatory vasodilation, while in others this compensation was completely absent. This noncompensation compromised exercise performance, confirming that it has a relevant functional impact. This has important implications for understanding inherent contributors to interindividual differences in exercise tolerance. Interestingly, despite a performance compromise in noncompensators compared with compensators, they did not exhibit a greater compensatory pressor response. Furthermore, the finding that the noncompensator phenotype demonstrates preserved O2D:demand matching ability in response to increased metabolic demand but not when O2D is suddenly compromised during exercise suggests the possibility of differences in vasodilatory mechanisms responsible for these different O2D:demand matching challenges. The mechanistic basis of noncompensation remains to be determined.
GRANTS
This project was supported by Natural Sciences and Engineering Research Council (NSERC) of Canada Discovery Grant 250367-11 and Research Tools and Instruments Grant EQPEQ0407690-11 as well as infrastructure grants from the Canadian Foundation for Innovation and the Ontario Innovation Trust to M. E. Tschakovsky. R. F. Bentley was supported by an NSERC Postgraduate Scholarship.
DISCLOSURES
No conflicts of interest, financial or otherwise, are declared by the authors.
AUTHOR CONTRIBUTIONS
R.F.B. and M.E.T. conceived and designed research; R.F.B., J.J.W., P.J.D., A.V., S.J.K., and A.M.F. performed experiments; R.F.B. analyzed data; R.F.B. and M.E.T. interpreted results of experiments; R.F.B. prepared figures; R.F.B. drafted manuscript; R.F.B., J.J.W., P.J.D., A.V., S.J.K., A.M.F., and M.E.T. edited and revised manuscript; R.F.B., J.J.W., P.J.D., A.V., S.J.K., A.M.F., and M.E.T. approved final version of manuscript.
REFERENCES
- 1.Andersen P, Saltin B. Maximal perfusion of skeletal muscle in man. J Physiol 366: 233–249, 1985. doi: 10.1113/jphysiol.1985.sp015794. [DOI] [PMC free article] [PubMed] [Google Scholar]
- 2.Armstrong ML, Dua AK, Murrant CL. Potassium initiates vasodilatation induced by a single skeletal muscle contraction in hamster cremaster muscle. J Physiol 581: 841–852, 2007. doi: 10.1113/jphysiol.2007.130013. [DOI] [PMC free article] [PubMed] [Google Scholar]
- 3.Arthur PG, Hogan MC, Bebout DE, Wagner PD, Hochachka PW. Modeling the effects of hypoxia on ATP turnover in exercising muscle. J Appl Physiol (1985) 73: 737–742, 1992. [DOI] [PubMed] [Google Scholar]
- 4.Behnke BJ, McDonough P, Padilla DJ, Musch TI, Poole DC. Oxygen exchange profile in rat muscles of contrasting fibre types. J Physiol 549: 597–605, 2003. doi: 10.1113/jphysiol.2002.035915. [DOI] [PMC free article] [PubMed] [Google Scholar]
- 5.Bentley RF, Kellawan JM, Moynes JS, Poitras VJ, Walsh JJ, Tschakovsky ME. Individual susceptibility to hypoperfusion and reductions in exercise performance when perfusion pressure is reduced: evidence for vasodilator phenotypes. J Appl Physiol (1985) 117: 392–405, 2014. doi: 10.1152/japplphysiol.01155.2013. [DOI] [PMC free article] [PubMed] [Google Scholar]
- 6.Blomstrand E, Rådegran G, Saltin B. Maximum rate of oxygen uptake by human skeletal muscle in relation to maximal activities of enzymes in the Krebs cycle. J Physiol 501: 455–460, 1997. doi: 10.1111/j.1469-7793.1997.455bn.x. [DOI] [PMC free article] [PubMed] [Google Scholar]
- 7.Brien JF, McLaughlin BE, Nakatsu K, Marks GS. Chemiluminescence headspace-gas analysis for determination of nitric oxide formation in biological systems. Methods Enzymol 268: 83–92, 1996. doi: 10.1016/S0076-6879(96)68011-2. [DOI] [PubMed] [Google Scholar]
- 8.Casey DP, Joyner MJ. Contribution of adenosine to compensatory dilation in hypoperfused contracting human muscles is independent of nitric oxide. J Appl Physiol (1985) 110: 1181–1189, 2011. doi: 10.1152/japplphysiol.00836.2010. [DOI] [PMC free article] [PubMed] [Google Scholar]
- 9.Casey DP, Joyner MJ. NOS inhibition blunts and delays the compensatory dilation in hypoperfused contracting human muscles. J Appl Physiol (1985) 107: 1685–1692, 2009. doi: 10.1152/japplphysiol.00680.2009. [DOI] [PMC free article] [PubMed] [Google Scholar]
- 10.Casey DP, Joyner MJ. Skeletal muscle blood flow responses to hypoperfusion at rest and during rhythmic exercise in humans. J Appl Physiol (1985) 107: 429–437, 2009. doi: 10.1152/japplphysiol.00331.2009. [DOI] [PMC free article] [PubMed] [Google Scholar]
- 11.Casey DP, Madery BD, Curry TB, Eisenach JH, Wilkins BW, Joyner MJ. Nitric oxide contributes to the augmented vasodilatation during hypoxic exercise. J Physiol 588: 373–385, 2010. doi: 10.1113/jphysiol.2009.180489. [DOI] [PMC free article] [PubMed] [Google Scholar]
- 12.Cicchetti DV, Sparrow SA. Developing criteria for establishing interrater reliability of specific items: applications to assessment of adaptive behavior. Am J Ment Defic 86: 127–137, 1981. [PubMed] [Google Scholar]
- 13.Cosby K, Partovi KS, Crawford JH, Patel RP, Reiter CD, Martyr S, Yang BK, Waclawiw MA, Zalos G, Xu X, Huang KT, Shields H, Kim-Shapiro DB, Schechter AN, Cannon RO III, Gladwin MT. Nitrite reduction to nitric oxide by deoxyhemoglobin vasodilates the human circulation. Nat Med 9: 1498–1505, 2003. doi: 10.1038/nm954. [DOI] [PubMed] [Google Scholar]
- 14.Crecelius AR, Kirby BS, Luckasen GJ, Larson DG, Dinenno FA. ATP-mediated vasodilatation occurs via activation of inwardly rectifying potassium channels in humans. J Physiol 590: 5349–5359, 2012. doi: 10.1113/jphysiol.2012.234245. [DOI] [PMC free article] [PubMed] [Google Scholar]
- 15.Crecelius AR, Kirby BS, Luckasen GJ, Larson DG, Dinenno FA. Mechanisms of rapid vasodilation after a brief contraction in human skeletal muscle. Am J Physiol Heart Circ Physiol 305: H29–H40, 2013. doi: 10.1152/ajpheart.00298.2013. [DOI] [PMC free article] [PubMed] [Google Scholar]
- 16.Crecelius AR, Kirby BS, Richards JC, Garcia LJ, Voyles WF, Larson DG, Luckasen GJ, Dinenno FA. Mechanisms of ATP-mediated vasodilation in humans: modest role for nitric oxide and vasodilating prostaglandins. Am J Physiol Heart Circ Physiol 301: H1302–H1310, 2011. doi: 10.1152/ajpheart.00469.2011. [DOI] [PMC free article] [PubMed] [Google Scholar]
- 17.Crecelius AR, Kirby BS, Voyles WF, Dinenno FA. Augmented skeletal muscle hyperaemia during hypoxic exercise in humans is blunted by combined inhibition of nitric oxide and vasodilating prostaglandins. J Physiol 589: 3671–3683, 2011. doi: 10.1113/jphysiol.2011.209486. [DOI] [PMC free article] [PubMed] [Google Scholar]
- 18.Edwards G, Dora KA, Gardener MJ, Garland CJ, Weston AH. K+ is an endothelium-derived hyperpolarizing factor in rat arteries. Nature 396: 269–272, 1998. doi: 10.1038/24388. [DOI] [PubMed] [Google Scholar]
- 19.Ellsworth ML. The red blood cell as an oxygen sensor: what is the evidence? Acta Physiol Scand 168: 551–559, 2000. doi: 10.1046/j.1365-201x.2000.00708.x. [DOI] [PubMed] [Google Scholar]
- 20.Ellsworth ML, Ellis CG, Goldman D, Stephenson AH, Dietrich HH, Sprague RS. Erythrocytes: oxygen sensors and modulators of vascular tone. Physiology (Bethesda) 24: 107–116, 2009. doi: 10.1152/physiol.00038.2008. [DOI] [PMC free article] [PubMed] [Google Scholar]
- 21.González-Alonso J, Olsen DB, Saltin B. Erythrocyte and the regulation of human skeletal muscle blood flow and oxygen delivery: role of circulating ATP. Circ Res 91: 1046–1055, 2002. doi: 10.1161/01.RES.0000044939.73286.E2. [DOI] [PubMed] [Google Scholar]
- 22.Gonzalez-Alonso J, Richardson RS, Saltin B. Exercising skeletal muscle blood flow in humans responds to reduction in arterial oxyhaemoglobin, but not to altered free oxygen. J Physiol 530: 331–341, 2001. doi: 10.1111/j.1469-7793.2001.0331l.x. [DOI] [PMC free article] [PubMed] [Google Scholar]
- 23.Hepple RT. The role of O2 supply in muscle fatigue. Can J Appl Physiol 27: 56–69, 2002. doi: 10.1139/h02-004. [DOI] [PubMed] [Google Scholar]
- 24.Hogan MC, Arthur PG, Bebout DE, Hochachka PW, Wagner PD. Role of O2 in regulating tissue respiration in dog muscle working in situ. J Appl Physiol (1985) 73: 728–736, 1992. [DOI] [PubMed] [Google Scholar]
- 25.Hogan MC, Richardson RS, Haseler LJ. Human muscle performance and PCr hydrolysis with varied inspired oxygen fractions: a 31P-MRS study. J Appl Physiol (1985) 86: 1367–1373, 1999. [DOI] [PubMed] [Google Scholar]
- 26.Hopkins WG. Measures of reliability in sports medicine and science. Sports Med 30: 1–15, 2000. doi: 10.2165/00007256-200030010-00001. [DOI] [PubMed] [Google Scholar]
- 27.Hughson RL, Shoemaker JK, Tschakovsky ME, Kowalchuk JM. Dependence of muscle V̇o2 on blood flow dynamics at onset of forearm exercise. J Appl Physiol (1985) 81: 1619–1626, 1996. [DOI] [PubMed] [Google Scholar]
- 28.Ichinose M, Delliaux S, Watanabe K, Fujii N, Nishiyasu T. Evaluation of muscle metaboreflex function through graded reduction in forearm blood flow during rhythmic handgrip exercise in humans. Am J Physiol Heart Circ Physiol 301: H609–H616, 2011. doi: 10.1152/ajpheart.00076.2011. [DOI] [PubMed] [Google Scholar]
- 29.Kellawan JM, Bentley RF, Bravo MF, Moynes JS, Tschakovsky ME. Does oxygen delivery explain interindividual variation in forearm critical impulse? Physiol Rep 2: e12203, 2014. doi: 10.14814/phy2.12203. [DOI] [PMC free article] [PubMed] [Google Scholar]
- 30.Kenjale AA, Ham KL, Stabler T, Robbins JL, Johnson JL, Vanbruggen M, Privette G, Yim E, Kraus WE, Allen JD. Dietary nitrate supplementation enhances exercise performance in peripheral arterial disease. J Appl Physiol (1985) 110: 1582–1591, 2011. doi: 10.1152/japplphysiol.00071.2011. [DOI] [PMC free article] [PubMed] [Google Scholar]
- 31.Kirby BS, Crecelius AR, Richards JC, Dinenno FA. Sources of intravascular ATP during exercise in humans: critical role for skeletal muscle perfusion. Exp Physiol 98: 988–998, 2013. doi: 10.1113/expphysiol.2012.071555. [DOI] [PMC free article] [PubMed] [Google Scholar]
- 32.Kirby BS, Crecelius AR, Voyles WF, Dinenno FA. Impaired skeletal muscle blood flow control with advancing age in humans: attenuated ATP release and local vasodilation during erythrocyte deoxygenation. Circ Res 111: 220–230, 2012. doi: 10.1161/CIRCRESAHA.112.269571. [DOI] [PMC free article] [PubMed] [Google Scholar]
- 33.MacDonald MJ, Shoemaker JK, Tschakovsky ME, Hughson RL. Alveolar oxygen uptake and femoral artery blood flow dynamics in upright and supine leg exercise in humans. J Appl Physiol (1985) 85: 1622–1628, 1998. [DOI] [PubMed] [Google Scholar]
- 34.McDonough P, Behnke BJ, Padilla DJ, Musch TI, Poole DC. Control of microvascular oxygen pressures in rat muscles comprised of different fibre types. J Physiol 563: 903–913, 2005. doi: 10.1113/jphysiol.2004.079533. [DOI] [PMC free article] [PubMed] [Google Scholar]
- 35.Milkau M, Köhler R, de Wit C. Crucial importance of the endothelial K+ channel SK3 and connexin40 in arteriolar dilations during skeletal muscle contraction. FASEB J 24: 3572–3579, 2010. doi: 10.1096/fj.10-158956. [DOI] [PubMed] [Google Scholar]
- 36.Mortensen SP, Damsgaard R, Dawson EA, Secher NH, González-Alonso J. Restrictions in systemic and locomotor skeletal muscle perfusion, oxygen supply and VO2 during high-intensity whole-body exercise in humans. J Physiol 586: 2621–2635, 2008. doi: 10.1113/jphysiol.2007.149401. [DOI] [PMC free article] [PubMed] [Google Scholar]
- 37.O’Leary DS, Sheriff DD. Is the muscle metaboreflex important in control of blood flow to ischemic active skeletal muscle in dogs? Am J Physiol Heart Circ Physiol 268: H980–H986, 1995. [DOI] [PubMed] [Google Scholar]
- 38.Richardson RS, Poole DC, Knight DR, Kurdak SS, Hogan MC, Grassi B, Johnson EC, Kendrick KF, Erickson BK, Wagner PD. High muscle blood flow in man: is maximal O2 extraction compromised? J Appl Physiol (1985) 75: 1911–1916, 1993. [DOI] [PubMed] [Google Scholar]
- 39.Sarkin J, Campbell J, Gross L, Roby J, Bazzo S, Sallis J, Calfas K. Project GRAD Seven-Day Physical Activity Recall Interviewer’s Manual. Med Sci Sports Exerc 29: S91–S102, 1997. [Google Scholar]
- 40.Saunders NR, Pyke KE, Tschakovsky ME. Dynamic response characteristics of local muscle blood flow regulatory mechanisms in human forearm exercise. J Appl Physiol (1985) 98: 1286–1296, 2005. doi: 10.1152/japplphysiol.01118.2004. [DOI] [PubMed] [Google Scholar]
- 41.Singel DJ, Stamler JS. Chemical physiology of blood flow regulation by red blood cells: the role of nitric oxide and S-nitrosohemoglobin. Annu Rev Physiol 67: 99–145, 2005. doi: 10.1146/annurev.physiol.67.060603.090918. [DOI] [PubMed] [Google Scholar]
- 42.Tschakovsky ME, Pyke KE. Cardiovascular responses to exercise and limitations to human performance. In: Physiological Bases of Human Performance During Work and Exercise, edited by Taylor N, Groeller H. New York: Churchill Livingstone, 2008. [Google Scholar]
- 43.Walker KL, Saunders NR, Jensen D, Kuk JL, Wong SL, Pyke KE, Dwyer EM, Tschakovsky ME. Do vasoregulatory mechanisms in exercising human muscle compensate for changes in arterial perfusion pressure? Am J Physiol Heart Circ Physiol 293: H2928–H2936, 2007. doi: 10.1152/ajpheart.00576.2007. [DOI] [PubMed] [Google Scholar]