Abstract

Two-dimensional hybrid organic–inorganic lead halides perovskite-type compounds have attracted immense scientific interest due to their remarkable optoelectronic properties and tailorable crystal structures. In this work, we present a new layered hybrid lead halide, namely [CH(NH2)2][C(NH2)3]PbI4, wherein puckered lead-iodide layers are separated by two small and stable organic cations: formamidinium, CH(NH2)2+, and guanidinium, C(NH2)3+. This perovskite is thermally stable up to 255 °C, exhibits room-temperature photoluminescence in the red region with a quantum yield of 3.5%, and is photoconductive. This study highlights a vast structural diversity that exists in the compositional space typically used in perovskite photovoltaics.
Layered (two-dimensional, 2D) lead halide perovskites (LHPs) are unique, structurally soft and quantum-well-like systems, exhibiting enormous structural diversity1 as well as high potential for applications in light emitting diodes,2 photodetectors3 or solar cells.4 Most of 2D LHPs can be imagined as structural derivatives from the ideal cubic perovskite lattice of an APbX3 composition [A, monovalent cation, primarily Cs+, methylammonium (MA) or formamidinium (FA); X, halogen anion] with three-dimensional (3D) interconnection of corner-shared PbX6-octahedra and with A-cations filling the large voids in-between these octahedra. Slicing of this lattice along (100), (110), (111) crystallographic planes (Figure 1) with the elimination of the octahedra lying in the slicing plane (gray-shaded octahedra in Figure 1) leads to common 2D-compounds with single-octahedra or thicker slabs. To induce the formation of 2D LHPs, A-site cations, which are typically used in 3D LHPs (Cs+, MA, FA), must be fully or partially replaced with bulkier cations. (100)-layered 2D perovskites are most common and adopt K2NiF4 or RbAlF4 crystal structure. As to (110)-2D LHPs (Ca2Nb2O7 related phases), some known examples of A-cations include N-(3-aminopropyl)imidazolium [in (C6H13N3)PbBr4],5N1-methylethane-1,2-diammonium [N-MEDA, in (N-MEDA)PbBr4],2a as well as guanidinium [C(NH2)3+, G, in G2PbI4].6 An example of (111)-layered 2D LHP is the one comprising 3-(aminomethyl)pyridinium [(H23-AMP)2+], such as in (H23-AMP)2PbBr6 with K2PtCl6 type structure.7 (100)-2D LHPs are most commonly built with primary mono and diammonium cations.1g The heavier the halide ion and the thicker the slab the smaller is the optical bandgap energy (Eg). As an example, in iodides, Eg varies from 2.57 eV in (CH3(CH2)3NH3)2PbI48 to 1.83 eV in (CH3(CH2)3NH3)2(CH3NH3)4Pb5I16.9
Figure 1.

Derivation of 2D LHPs from the parental cubic perovskite lattice of 3D LHPs by cutting the latter along typical crystallographic planes: (100), (110), and (111).
Large Stokes shifts and broadband emission were recently reported for some (100) and (110) 2D-perovskites,1b,2a,2c,10 and were attributed to emission either from self-trapped excitons (STEx) or from charge carriers trapped on defects.11
Small and highly symmetric guanidinium cation forms a corrugated G2PbI4 structure with layers parallel to the (110) plane, and Eg of 2.40 eV.6b Smaller FA forms instead a 3D LHP, FAPbI3 (α-phase, cubic symmetry),12 with the smallest bandgap energy among all known LHPs, exhibiting PL maximum at 1.48 eV (to 840 nm in the near-infrared). α-FAPbI3 is thermodynamically stable only above 185 °C,13 whereas at room temperature (RT), α-FAPbI3 undergoes a phase-transition into a wide-bandgap, nonluminescent 1D-polymorph (δ-FAPbI3).12,13 The ionic radii of FA and G cations are 253 and 278 pm, respectively.14 The tolerance factor, a geometric parameter (α), introduced by V. M. Goldschmidt, describes a relation between the ionic radii (ri) of A, B, X ions and a probability of a 3D perovskite lattice formation: α = (rA + rX)/√2(rB + rX).14 Thus, when α = 0.9–1.0, formation of a cubic perovskite structure is favored and deviations from these values lead to distorted perovskites or nonperovskite, lower-dimensionality structures. While for FAPbI3 α = 0.987, for GPbI3 it increases to 1.039, causing crystallization in a 2D G2PbI4. Both FA and G ions are excellent donors of hydrogen bonds with the lead-halide framework. It is thus of high interest to explore the possibility of concomitant incorporation of FA and G for the formation of previously unknown compounds. These compounds might exhibit reduced volume of the interlayer region as compared to G-only or larger-cation compounds. Such compactness and resulting reduction of Eg had been shown in previous studies on Cs+/G and on MA/G systems.15 G and similar ions are increasingly used as additives to MA/FA/Cs-based APbX3 compounds in perovskite photovoltaics.16 Hence, the search for structural motifs within this compositional space is highly relevant for understanding perovskite optoelectronic devices.
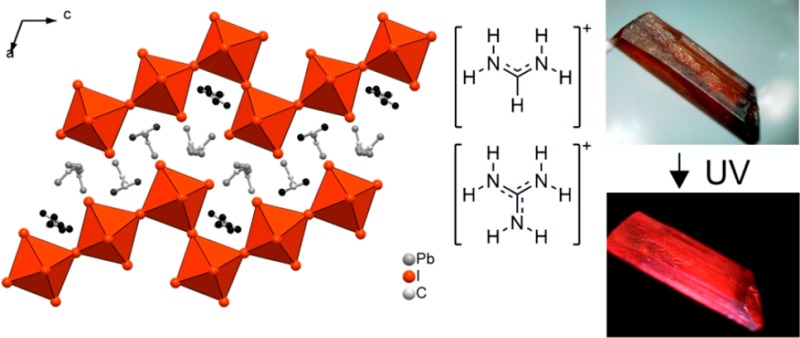
In this work, a new 2D perovskite with a crystal structure composed of corrugated inorganic layers, [CH(NH2)2][C(NH2)3]PbI4 (Figure 2a–c) further denoted also as FAGPbI4, was identified in the FA-G-PbI2 system. Such layered network can be visualized as stair-like slabs of corner-sharing Pb–I octahedra (Figure 2). It shows broadband emission in the red region at RT (Figure 2d) that originates from both free and self-trapped excitons.
Figure 2.
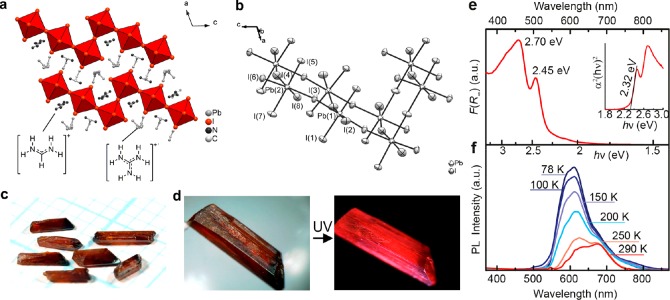
(a) Crystal structure of FAGPbI4. (b) Octahedral coordination of lead ions. (c) A photograph of typical crystals (elipsoids shown at 50% probability). (d) Photographs of a FAGPbI4 crystal taken under day light and under UV illumination in dark. (e) Kubelka–Munk function F(R∞) = (1 – R∞)2/2R∞ (R∞, diffusive reflectance) and (f) temperature-dependent PL spectra measurements performed on powdered crystals.
FAGPbI4 was crystallized from hydroiodic acid as 0.5–3 mm long needles (Figure 2c, see Supporting Information, SI, for further details). Briefly, FA acetate (4 mmol), G2CO3 (4 mmol) and lead acetate trihydrate (4 mmol) were dissolved in 18 mL of aqueous HI (57% by mass) upon moderate heating (∼50 °C). After cooling to RT, the solution was left undisturbed for 1–2 days to allow crystallization of FAGPbI4. Crystals were isolated by vacuum filtration and purified by washing with diethyl ether and toluene. The purity of FAGPbI4 was confirmed by powder X-ray diffraction (pXRD) and the thermal stability was studied with thermogravimetric analysis and differential scanning calorimetry (Figure S1). FAGPbI4 crystallizes in a monoclinic crystal system (space group C2/m, Table S1). The crystal structure is composed of corrugated Pb–I layers and G and FA cations situated in the interlayer space (Figure 2a,b). Interestingly, in comparison with a related compound G2PbI4 (included in Figure 3), composed of zigzag Pb–I layers,2c FAGPbI4 shows stair-like corrugation of inorganic layers. Concomitant use of FA and G ions in a lead iodide system results in a different crystal structure as compared to MA-G-PbI2 and Cs-G-PbI2 systems, where Ruddlesden–Popper-like phases form (Figure S2).15 The crystal structure of FAGPbI4 had been deposited as a CIF file into the CCDC database with the number 1814744.
Figure 3.
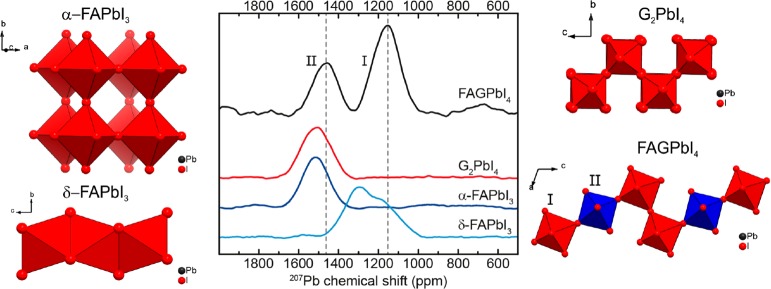
207Pb ssNMR spectra of FAGPbI4, G2PbI4, α-FAPbI3 and δ-FAPbI3. All spectra were acquired under 20 kHz magic-angle spinning, except for α-FAPbI3, which was recorded in static mode.
In general, the bandgap energy is determined by such factors as the dimensionality, connectivity of the structure and distortions of the coordination polyhedra (lengths of the Pb–X bonds and Pb–X–Pb angles), as well the atomic number of the halide.17 In FAGPbI4, Pb–I distances lie in the range of 3.080(1)–3.361(1) Å and are comparable to those in G2PbI4 [d(Pb–I) = 3.070(14)–3.362(14) Å].6a I–Pb–I bond angles in FAGPbI4 deviate from 90° and are in the range of 86.36(3)–95.66(2)°; Pb–I–Pb angles range from 161.98° to 180°. In comparison, Pb–I–Pb angles in G2PbI4 are in the range of 156.9–177.5°. The complete set of bond distances and bond angles can be found in Tables S2–S4. The optical absorption spectrum of powdered FAGPbI4 is represented here by the Kubelka–Munk function F(R∞) = α/S = (1 – R∞)2/2R∞, where α is an absorption coefficient, S is a scattering coefficient and R∞ is a reflectance of an infinitely thick layer. The absorption transitions appear at 506 and 459 nm (Figure 2e, S3), with only a weak absorbance below 620 nm. The compound exhibits red PL under UV excitation at RT (Figure 2d), which is a spectrally broad convolution of several bands (Figure 2f). At RT, the PL quantum yield (PLQY) reaches 3.5%, when excited in the wavelength range of 550–600 nm and drops to about 1% for the excitation at wavelengths shorter than 500 nm (Figure S4).
Solid-state nuclear magnetic resonance spectroscopy (ssNMR, in standard magic-angle spinning version) had been used to characterize FAGPbI4 and to delineate whether the PL originates from amorphous/nanocrystalline contaminants, not detectable by pXRD. The high purity of FAGPbI4 was confirmed by comparing its 207Pb ssNMR spectrum with the spectra of plausible contaminants: G2PbI4, α-FAPbI3 and δ-FAPbI3 (see NMR and XRD data in Figures 3 and S5–S7). FAGPbI4 exhibits two peaks, at 1160 and 1465 ppm (referenced to PbMe4), with a full width at half-maximum (fwhm) of 22.4 and 20.2 kHz, respectively, which are typical values for inorganic lead(II)-iodide compounds18 and LHPs.19 The ratio of the peak areas of 2:1 corresponds to the staggered crystal structure. 207Pb ssNMR spectra of G2PbI4 and α-FAPbI3 exhibit single peaks at 1515 ppm. The narrower signal of α-FAPbI3 (fwhm = 22.2 kHz), as compared to G2PbI4 (fwhm = 24.5 kHz), can be attributed to the higher symmetry and rigidity of the former structure. In contrast, δ-FAPbI3 shows a complex spectrum with spinning side bands. The isotropic chemical shift was determined by varying the MAS spinning frequency and, after deconvolution, was found to be −1175 ppm with a fwhm of 21.8 kHz (Figure S8). This spectrum indicates a larger asymmetry of the Pb environment in δ-FAPbI3. None of the other plausible impurities such as precursors (e.g., lead acetate) or side products (PbI2, PbCO3, PbO or Pb(OH)I, etc.) could be detected by sampling a broader range of chemical shifts (Figures S9).
Understanding of the broadband emission from layered LHPs is nontrivial due to effects of the increased structural dynamics in their soft lattices. Temperature-dependent PL measurements were taken to further investigate the complexity of the PL from FAGPbI4 (Figure 2f). With cooling, higher-energy emission shifts to shorter wavelength, up to around 600 nm at 78 K and notably grows in intensity, as one would expect from the excitonic emission.
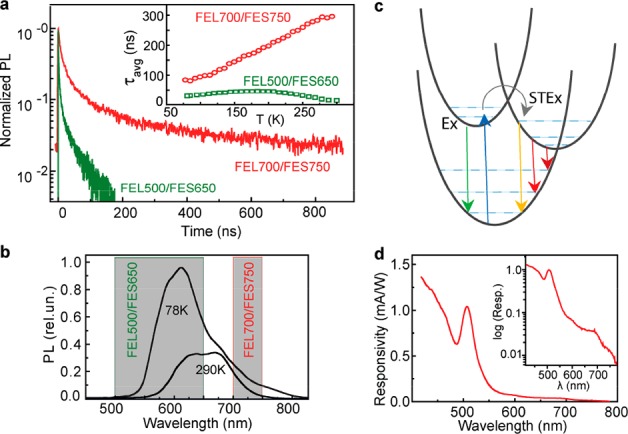
The longer-wavelength side of the PL envelope is much less altered by the temperature. Time-resolved measurements also point to distinctly different nature of lower and higher energy emission bands (Figure 4). Two spectral regions were probed; these were defined through the use of short- and long-pass optical filters, as indicated by shaded areas. Typically, structurally rigid 2D LHP structures exhibit narrow-band PL with short lifetimes for excitonic transitions, from a few to tens of ns, whereas more complex structures with STEx are characterized by broader emission with one-to-2 orders of magnitude longer lifetimes.2c,20 Minor changes in average lifetime for 500–650 nm spectral region as a function of the excitation intensity was observed, as opposed to the region of 700–750 nm, characterized by much stronger power dependence (Figure S10). At 700–750 nm, the PL lifetime decreases with the increase of excitation power. While still speculative, the PL band at ca. 645 nm can be attributed to (near) band-edge excitons, whereas lower-energy emission (at around 685 nm) might be STEx-related. However, for the lower-energy emission band, we cannot exclude that the emission can also be related to defects or color centers.21 All decay traces are multiexponential and are compared by their average lifetimes (τavg, extracted from biexponential fits). The lower-energy PL is characterized by long τavg on the order of hundreds of ns, which increases with increasing the temperature. Considering that the PL QYs are on the order of a few %, it is impossible to unambiguously assign these lifetimes to exclusively radiative processes. Additional measurements, such as spectral dependences of PL excitation and PLQYs, excitation power dependent time-resolved PL (TRPL), and TRPL with micrometer spatial resolution (see Figures S3, S4, S10, S11), do not allow for a more accurate assignment of the complex and overlapping emission bands in such 2D LHPs.
Figure 4.

(a) RT time-resolved PL traces recorded in two spectral ranges (indicated in panel b) : 500–650 nm (green) and 700–750 nm (red). Inset: temperature-dependence of the average PL lifetime. (c) Configuration coordinate diagram for free excitons and STEx. (d) Photoconductivity spectrum from a single FAGPbI4 crystal.
The extended 2D electronic structure of FAGPbI4 allows for the observation of photoconductivity (Figure 4d). The dark specific resistivity values were ca. 1 × 10¹⁰ Ω·cm, indicating rather low intrinsic carrier concentration and/or mobility. The photoconductivity spectrum of a single FAGPbI4 crystal peaks at 510 nm, coinciding with the absorption peak in the Kubelka–Munk function. The tail of the weak photoconductivity extends to 700 nm, thus covering the range in which PL bands are observed. Again, as in the case of PL, it remains impossible to disentangle two possible origins of this photoconductivity: from trap states or from STEx. Furthermore, we note that the fine spectral details of the PL vary also with the synthesis method (see methods 1 and 2, and Figure S12 in SI for more details).
In conclusion, a new layered compound, FAGPbI4, is thermally stable until 255 °C, exhibits PL at RT and pronounced photoconductivity. This study highlights a plethora of structures, other than traditional ABX3 LHPs, that can form in the compositional space comprising Cs+, FA, MA, G as A-site cations or interlayer cations.
Acknowledgments
This work was financially supported by the European Union through the FP7 (ERC Starting Grant NANOSOLID, GA No. 306733) and through the Horizon-2020 (Marie-Skłodowska Curie ITN network PHONSI, H2020-MSCA-ITN-642656).
Supporting Information Available
The Supporting Information is available free of charge on the ACS Publications website at DOI: 10.1021/jacs.8b00194.
The authors declare no competing financial interest.
Supplementary Material
References
- a Mitzi D. B.; Chondroudis K.; Kagan C. R. IBM J. Res. Dev. 2001, 45, 29–45. 10.1147/rd.451.0029. [DOI] [Google Scholar]; b Dohner E. R.; Jaffe A.; Bradshaw L. R.; Karunadasa H. I. J. Am. Chem. Soc. 2014, 136, 13154–13157. 10.1021/ja507086b. [DOI] [PubMed] [Google Scholar]; c Stoumpos C. C.; Cao D. H.; Clark D. J.; Young J.; Rondinelli J. M.; Jang J. I.; Hupp J. T.; Kanatzidis M. G. Chem. Mater. 2016, 28, 2852–2867. 10.1021/acs.chemmater.6b00847. [DOI] [Google Scholar]; d Stoumpos C. C.; Soe C. M. M.; Tsai H.; Nie W.; Blancon J.-C.; Cao D. H.; Liu F.; Traoré B.; Katan C.; Even J.; Mohite A. D.; Kanatzidis M. G. Chem. 2017, 2, 427–440. 10.1016/j.chempr.2017.02.004. [DOI] [Google Scholar]; e Smith M. D.; Watson B. L.; Dauskardt R. H.; Karunadasa H. I. Chem. Mater. 2017, 29, 7083–7087. 10.1021/acs.chemmater.7b02594. [DOI] [Google Scholar]; f Smith M. D.; Jaffe A.; Dohner E. R.; Lindenberg A. M.; Karunadasa H. I. Chem. Sci. 2017, 8, 4497–4504. 10.1039/C7SC01590A. [DOI] [PMC free article] [PubMed] [Google Scholar]; g Saparov B.; Mitzi D. B. Chem. Rev. 2016, 116, 4558–4596. 10.1021/acs.chemrev.5b00715. [DOI] [PubMed] [Google Scholar]; h Mitzi D. B.Synthesis, structure, and properties of organic-inorganic perovskites and related materials; John Wiley & Sons, Inc., 1999. [Google Scholar]
- a Dohner E. R.; Hoke E. T.; Karunadasa H. I. J. Am. Chem. Soc. 2014, 136, 1718–1721. 10.1021/ja411045r. [DOI] [PubMed] [Google Scholar]; b Dohner E. R.; Jaffe A.; Bradshaw L. R.; Karunadasa H. I. J. Am. Chem. Soc. 2014, 136, 13154–13157. 10.1021/ja507086b. [DOI] [PubMed] [Google Scholar]; c Mao L.; Wu Y.; Stoumpos C. C.; Wasielewski M. R.; Kanatzidis M. G. J. Am. Chem. Soc. 2017, 139, 5210–5215. 10.1021/jacs.7b01312. [DOI] [PubMed] [Google Scholar]
- a Li L.; Sun Z.; Wang P.; Hu W.; Wang S.; Ji C.; Hong M.; Luo J. Angew. Chem. 2017, 129, 12318–12322. 10.1002/ange.201705836. [DOI] [PubMed] [Google Scholar]; b Tan Z.; Wu Y.; Hong H.; Yin J.; Zhang J.; Lin L.; Wang M.; Sun X.; Sun L.; Huang Y.; Liu K.; Liu Z.; Peng H. J. Am. Chem. Soc. 2016, 138, 16612–16615. 10.1021/jacs.6b11683. [DOI] [PubMed] [Google Scholar]
- a Tsai H.; Nie W.; Blancon J.-C.; Stoumpos C. C.; Asadpour R.; Harutyunyan B.; Neukirch A. J.; Verduzco R.; Crochet J. J.; Tretiak S.; Pedesseau L.; Even J.; Alam M. A.; Gupta G.; Lou J.; Ajayan P. M.; Bedzyk M. J.; Kanatzidis M. G.; Mohite A. D. Nature 2016, 536, 312–316. 10.1038/nature18306. [DOI] [PubMed] [Google Scholar]; b Smith I. C.; Hoke E. T.; Solis-Ibarra D.; McGehee M. D.; Karunadasa H. I. Angew. Chem., Int. Ed. 2014, 53, 11232–11235. 10.1002/anie.201406466. [DOI] [PubMed] [Google Scholar]
- Li Y. Y.; Lin C. K.; Zheng G. L.; Cheng Z. Y.; You H.; Wang W. D.; Lin J. Chem. Mater. 2006, 18, 3463–3469. 10.1021/cm060714u. [DOI] [Google Scholar]
- a Szafrański M.; Stahl K. Phys. Rev. B: Condens. Matter Mater. Phys. 2000, 62, 8787. 10.1103/PhysRevB.62.8787. [DOI] [Google Scholar]; b Hillebrecht H.; Daub M.; Haber C. Eur. J. Inorg. Chem. 2017, 2017, 1120–1126. 10.1002/ejic.201601499. [DOI] [Google Scholar]
- Li Y.; Zheng G.; Lin C.; Lin J. Solid State Sci. 2007, 9, 855–861. 10.1016/j.solidstatesciences.2007.06.011. [DOI] [Google Scholar]
- Ishihara T. J. Lumin. 1994, 60, 269–274. 10.1016/0022-2313(94)90145-7. [DOI] [Google Scholar]
- Stoumpos C. C.; Malliakas C. D.; Kanatzidis M. G. Inorg. Chem. 2013, 52, 9019–9038. 10.1021/ic401215x. [DOI] [PubMed] [Google Scholar]
- Yangui A.; Garrot D.; Lauret J. S.; Lusson A.; Bouchez G.; Deleporte E.; Pillet S.; Bendeif E. E.; Castro M.; Triki S.; Abid Y.; Boukheddaden K. J. Phys. Chem. C 2015, 119, 23638–23647. 10.1021/acs.jpcc.5b06211. [DOI] [Google Scholar]
- Hu T.; Smith M. D.; Dohner E. R.; Sher M.-J.; Wu X.; Trinh M. T.; Fisher A.; Corbett J.; Zhu X. Y.; Karunadasa H. I.; Lindenberg A. M. J. Phys. Chem. Lett. 2016, 7, 2258–2263. 10.1021/acs.jpclett.6b00793. [DOI] [PubMed] [Google Scholar]
- Weller M. T.; Weber O. J.; Frost J. M.; Walsh A. J. Phys. Chem. Lett. 2015, 6, 3209–3212. 10.1021/acs.jpclett.5b01432. [DOI] [Google Scholar]
- Han Q.; Bae S.-H.; Sun P.; Hsieh Y.-T.; Yang Y.; Rim Y. S.; Zhao H.; Chen Q.; Shi W.; Li G.; Yang Y. Adv. Mater. 2016, 28, 2253–2258. 10.1002/adma.201505002. [DOI] [PubMed] [Google Scholar]
- Kieslich G.; Sun S.; Cheetham A. K. Chem. Sci. 2014, 5, 4712–4715. 10.1039/C4SC02211D. [DOI] [Google Scholar]
- a Nazarenko O.; Kotyrba M. R.; Wörle M.; Cuervo-Reyes E.; Yakunin S.; Kovalenko M. V. Inorg. Chem. 2017, 56, 11552–11564. 10.1021/acs.inorgchem.7b01204. [DOI] [PubMed] [Google Scholar]; b Soe C. M. M.; Stoumpos C. C.; Kepenekian M.; Traoré B.; Tsai H.; Nie W.; Wang B.; Katan C.; Seshadri R.; Mohite A. D.; Even J.; Marks T. J.; Kanatzidis M. G. J. Am. Chem. Soc. 2017, 139, 16297–16309. 10.1021/jacs.7b09096. [DOI] [PubMed] [Google Scholar]
- a Jodlowski A. D.; Roldán-Carmona C.; Grancini G.; Salado M.; Ralaiarisoa M.; Ahmad S.; Koch N.; Camacho L.; de Miguel G.; Nazeeruddin M. K. Nat. Energy 2017, 2, 972–979. 10.1038/s41560-017-0054-3. [DOI] [Google Scholar]; b Correa-Baena J.-P.; Saliba M.; Buonassisi T.; Grätzel M.; Abate A.; Tress W.; Hagfeldt A. Science 2017, 358, 739–744. 10.1126/science.aam6323. [DOI] [PubMed] [Google Scholar]
- a Stoumpos C. C.; Kanatzidis M. G. Acc. Chem. Res. 2015, 48, 2791–2802. 10.1021/acs.accounts.5b00229. [DOI] [PubMed] [Google Scholar]; b Lemmerer A.; Billing D. G. Dalton Trans. 2012, 41, 1146–1157. 10.1039/C0DT01805H. [DOI] [PubMed] [Google Scholar]
- a Kye Y.-S.; Connolly S.; Herreros B.; Harbison G. S. Main Group Met. Chem. 1999, 22, 373–383. 10.1515/MGMC.1999.22.6.373. [DOI] [Google Scholar]; b Dybowski C.; Smith M. L.; Hepp M. A.; Gaffney E. J.; Neue G.; Perry D. L. Appl. Spectrosc. 1998, 52, 426–429. 10.1366/0003702981943626. [DOI] [Google Scholar]; c Taylor R.; Beckmann P. A.; Bai S.; Dybowski C. J. Phys. Chem. C 2014, 118, 9143–9153. 10.1021/jp5023423. [DOI] [Google Scholar]
- a Rosales B. A.; Men L.; Cady S. D.; Hanrahan M. P.; Rossini A. J.; Vela J. Chem. Mater. 2016, 28, 6848–6859. 10.1021/acs.chemmater.6b01874. [DOI] [Google Scholar]; b Roiland C.; Trippé-Allard G.; Jemli K.; Alonso B.; Ameline J.-C.; Gautier R.; Bataille T.; Le Polles L.; Deleporte E.; Even J.; et al. Phys. Chem. Chem. Phys. 2016, 18, 27133–27142. 10.1039/C6CP02947G. [DOI] [PubMed] [Google Scholar]
- a Kitazawa N.; Aono M.; Watanabe Y. Thin Solid Films 2010, 518, 3199–3203. 10.1016/j.tsf.2009.09.014. [DOI] [Google Scholar]; b Kitazawa N.; Aono M.; Watanabe Y. J. Phys. Chem. Solids 2011, 72, 1467–1471. 10.1016/j.jpcs.2011.08.029. [DOI] [Google Scholar]
- Booker E. P.; Thomas T. H.; Quarti C.; Stanton M. R.; Dashwood C. D.; Gillett A. J.; Richter J. M.; Pearson A. J.; Davis N. J. L. K.; Sirringhaus H.; Price M. B.; Greenham N. C.; Beljonne D.; Dutton S. E.; Deschler F. J. Am. Chem. Soc. 2017, 139, 18632–18639. 10.1021/jacs.7b10223. [DOI] [PubMed] [Google Scholar]
Associated Data
This section collects any data citations, data availability statements, or supplementary materials included in this article.


