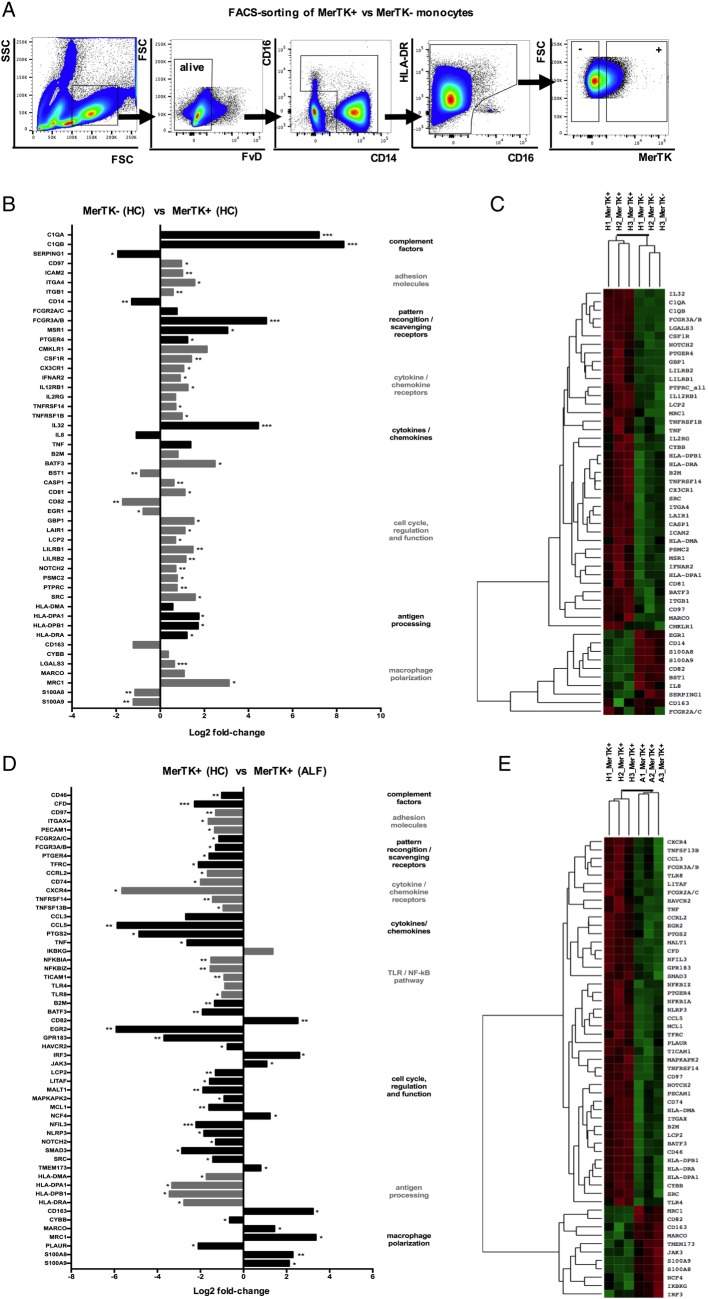
Figure 2.
Gene expression pattern of Mer tyrosine kinase (MerTK)+ monocytes in heatlhy controls (HC) and acute liver failure (ALF). (A) Human MerTK+ and MerTK− monocytes were FACS-sorted in HC and patients with ALF (n=3 each), with a gating strategy displayed by representative flow cytometry plots. (B–E) Highly pure isolates of MerTK± subsets were subjected to quantitative microarray gene expression analysis (nCounter GX Human Immunology V2 kit, profiling 594 immunology-related human genes; NanoString Technologies, Seattle, Washington, USA). Data show the log2 fold-change of expression and agglomerative cluster (heatmap, z-score; green=min and red=max magnitude of expression) of 50 chosen differentially expressed genes, comparing MerTK+ versus MerTK− monocytes in HC (B and C), and MerTK+ monocytes in ALF versus MerTK+ monocytes in HC (D and E). *p<0.05, **p<0.01, ***p<0.001. SSC, side scatter; FSC, forward scatter.

