

Abstract
Objectives
This study aims to assess the validity and reproducibility of computer-assisted joint space area measurement in knee roentgenograms of patients with knee osteoarthritis and compare it with a qualitative method in knee roentgenograms and quantitative and semi-quantitative methods in magnetic resonance imaging.
Patients and methods
The study included 40 knees of 40 patients diagnosed as osteoarthritis (14 males, 26 females; mean age 57.4±5.9 years; range 47 to 67 years). Only the patients who wrote consents for publication of their radiologic data, and with knee roentgenograms and magnetic resonance images of the same knees were selected. Computer-assisted measurements were applied to joint spaces by two blinded physicians, for two times with an interval of one week. Data were evaluated for intraobserver and interobserver consistency. Also, data were compared with qualitative (Kellgren-Lawrence classification), quantitative (joint space width, cartilage thickness, meniscal thickness in magnetic resonance images) and semi-quantitative methods (whole-organ magnetic resonance imaging score).
Results
Intraobserver consistency was evaluated for each physician, which revealed no differences. Interobserver consistency was evaluated by comparing the measurements of two blinded physicians and no differences were found (p>0.05). There was no significant correlation between the grade of Kellgren-Lawrence classification and other variables; such as grade of meniscus, meniscal thickness, cartilage thickness and computer- assisted joint space area measurements (p>0.05). While there was a positive correlation between computer-assisted joint space area measurement and other quantitative measurements, there was a negative correlation between computer-assisted joint space area measurement and whole-organ magnetic resonance imaging scores.
Conclusion
When compared with qualitative, quantitative, and semi-quantitative methods, computer-assisted joint space area measurement seems to be a useful, reproducible, and cost-effective quantitative method for evaluating knee osteoarthritis.
Keywords: Knee, magnetic resonance imaging, osteoarthritis, roentgenogram
Introduction
Osteoarthritis (OA) is a progressive disease with an incidence increasing steadily with age while structural changes include articular cartilage damage, osteophyte formation, and subchondral bone changes.(1) There are some classification methods for knee OA, which are qualitative like Kellgren-Lawrence (KL,2) semi-quantitative like whole-organ magnetic resonance imaging score (WORMS,3) and quantitative like joint space width (JSW), cartilage thickness, and meniscal thickness in magnetic resonance imaging (MRI).(4-9) Cartilage thickness, meniscal thickness, and synovial fluid are the basic determinants of the joint space in knee roentgenograms.
Although we can evaluate joint space by roentgenograms, we can evaluate the thickness of the cartilage, meniscus and other tissue components conclusively by MRI. MRI provides quantitative measurement (thickness of the cartilage, meniscus, JSW, etc.) and allows some semi-quantitative measurements, such as WORMS; however, it takes a long time (approximately 40 minutes including the set-up of patient, without the examination of radiologist) with high costs (approximately eight-fold of roentgenogram). There are also qualitative methods for evaluating the joint by roentgenograms, such as KL classification. These are useful and cost-effective methods for diagnosis; however, they are not sensitive enough for the changes in short periods and not quantitative or reproducible enough for measuring the joint space. Because of the necessity of an easier, reproducible, objective, and cost-effective quantitative measurement method for joint space, knee roentgenograms should be investigated further.
In this study, we aimed to assess the validity and reproducibility of computer-assisted joint space area measurement (CAJSAM) in knee roentgenograms of patients with knee OA and compare it with a qualitative method in knee roentgenograms and quantitative and semi- quantitative methods in MRI.
Patients and Methods
Subject number was calculated to be 32 to achieve an 80% power of study. A total of 53 patients (20 males, 33 females; mean age 58.2±5.7; range 47 to 69 years) with roentgenograms and MRIs of the same knees were detected from the files of Giresun Physical Medicine and Rehabilitation State Hospital between January 2014 and July 2014. Because of the exclusions due to the lack of written consents, 40 knees of 40 patients diagnosed as osteoarthritis (14 males, 26 females; mean age 57.4±5.9 years; range 47 to 67 years) were included. The study protocol was approved by the Giresun Physical Medicine and Rehabilitation State Hospital Ethics Committee. A written informed consent was obtained from each patient. The study was conducted in accordance with the principles of the Declaration of Helsinki.
For standardization of roentgenograms in our radiology unit, roentgenograms are obtained in standing position; while the knee is extended vertical, with the patella touching the plate. Distances between X-ray tube, plate, and knee are also kept constant.
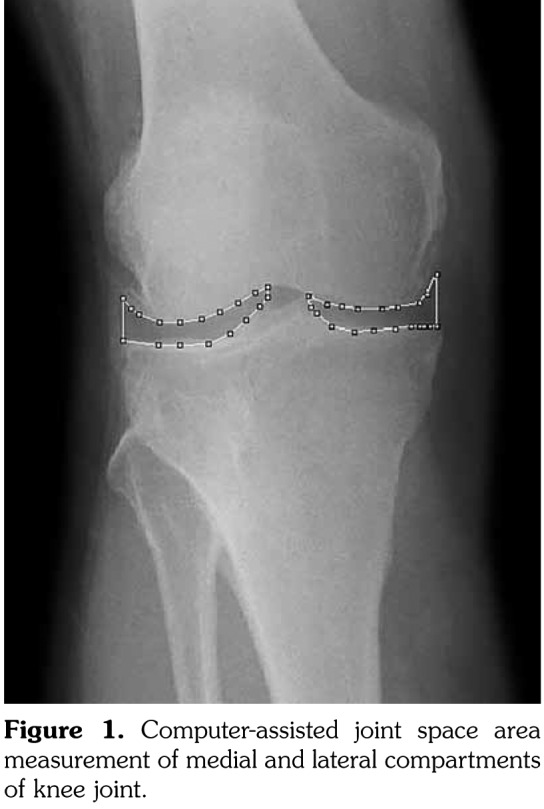
Computer-assisted measurements (by the software of Wayne Rasband National Institutes of Health, USA; http://rsb.info.nih.gov/ij/) were applied to roentgenograms for measuring the medial and lateral joint space areas (JSA) of the knee, by two blinded physicians, for two times with an interval of one week (Figure 1). Data were evaluated for intraobserver and interobserver consistencies. By calculating the average of the four measurements (first and second measurements of both physicians, for each compartments), means of CAJSAMs were obtained for medial and lateral compartments of knee joint. All variables were compared with KL classification in roentgenograms, JSW, cartilage thickness, meniscal thickness, and WORMS in MRI.
The CAJSAM was applied to medial and lateral compartments of knee joints separately. JSA of medial and lateral compartments were measured among the border of femoral condyles, tibial plateaus and line from medial and lateral tibial eminences to femoral groove (Figure 1).
A qualitative method, KL classification, was performed with the same knee roentgenograms as stated below:(2)
Grade 0: normal; grade 1: equivocal osteophyte, normal joint space; grade 2: distinct osteophyte, uncertain narrowing of joint space; grade 3: moderate osteophyte, moderate narrowing of joint space, minimal sclerosis; grade 4: large osteophyte, severe narrowing of joint space, distinct subchondral sclerosis of the bone and cysts.
Quantitative methods included measurement of JSW (narrowest width between femoral condyle and tibial plateau in millimeters), cartilage thickness (greatest width in millimeters), and meniscal thickness (greatest width in millimeters). The semi-quantitative method, WORMS, was investigated by an experienced radiologist with MRI (1.5 Tesla, axial T1-weighted, coronal T1-weighted, sagittal T1-weighted, sagittal T2-weighted, taking approximately 40 minutes including the set-up of the patient and 15 minutes for measuring each knee).
For evaluating WORMS, images are scored for 14 independent articular features as stated below:(3)
Cartilage signal and morphology (0-6 points), subarticular bone marrow abnormality (0-3 points), cysts (0-3 points) and bone attrition (0-3 points), marginal osteophytes (0-7 points), medial and lateral meniscal destruction (0-6 points), anterior and posterior cruciate ligament (0-1 point), medial and lateral collateral ligament integrity (0-1 point), synovitis (0-3 points), loose bodies (0-3 points), and periarticular cysts/bursae (0-3 points). These 14 features are evaluated in 15 different regions divided by anatomical landmarks. Patella is divided into medial and lateral regions, femur and tibia are divided into medial and lateral regions. Also, portion under the tibial eminences are considered as another region. Femoral and tibial surfaces are divided into anterior, central and posterior regions for each medial and lateral region. For each articular compartments; patellofemoral joint (PFJ), medial femorotibial joint and lateral femorotibial joint scores were calculated (maximum attainable scores are 88, 110 and 110, respectively). Also, a total score for whole knee joint was calculated (maximum attainable score is 332).
Grade of the meniscopathy is scored as stated below:(3)
0=intact; 1=minor radial tear or parrot beak tear; 2=non-displaced tear or prior surgical repair; 3=displaced tear or partial resection; 4=complete maceration/destruction or complete resection.
By an experienced radiologist, all calculation period was approximately 15 minutes for each knee.
Statistical analysis
Data analysis was performed with IBM SPSS version 21.0 (IBM Corp., Armonk, IL, USA) software package. While Wilcoxon signed test was used for dependent variables not providing assumption of normality, paired t-test was used for dependent variables providing assumption of normality. Pearson correlation test was used for continuous variables and Spearman’s correlation test was used for categorical variables.
Figure 1. Computer-assisted joint space area measurement of medial and lateral compartments of knee joint.
Results
Body mass index of individuals was 24.5±3.1 kg/m(2). According to KL classification, 47.5% of the individuals were grade 2, 40% were grade 3, and 12.5% were grade 4.
According to grade of the meniscopathy, medial meniscus anterior horn was grade 1 in only 5% of the individuals, and the others were grade 0. Medial meniscus body was grade 1 in 15% of the individuals, grade 2 in 2.5% of the individuals and grade 0 in others. Medial meniscus posterior horn was grade 1 in 27.5% of the individuals, grade 2 in 7.5% of the individuals and others were grade 0. Lateral meniscus anterior horn and lateral meniscus body were grade 1 in only 12.5% of the individuals and others were grade 0. Lateral meniscus posterior horn was grade 1 in 5% of the individuals, grade 2 in 5% of the individuals and others were grade 0.
When we compared the results of KL classification with other variables, we found no correlation between the KL classification and grades of meniscopathy, meniscal thicknesses, cartilage thicknesses, JSWs, and means of medial and lateral JSAs (all p>0.05).
Means and standard deviations of the continuous variables are shown in Table 1.
Table 1. Means and standard deviations of variables.
| Variables | Mean±SD |
| Mean of the first and second CAJSAM of both physicians for lateral joint space area (mm2) | 299.8±50.7 |
| Mean of the first and second CAJSAM of both physicians for medial joint space area (mm2) | 223.0±50.0 |
| Medial femorotibial joint score of WORMS | 16.6±5.6 |
| Lateral femorotibial joint score of WORMS | 10.3±4.8 |
| Patellofemoral joint score of WORMS | 13.1±5.1 |
| Total score of WORMS | 39.4±14.6 |
| Medial joint space width (mm) | 5.0±1.2 |
| Lateral joint space width (mm) | 5.9±1.4 |
| Femoral medial cartilage thickness (mm) | 2.2±0.4 |
| Tibial medial cartilage thickness (mm) | 2.1±0.4 |
| Femoral lateral cartilage thickness (mm) | 2.2±0.4 |
| Tibial lateral cartilage thickness (mm) | 2.1±0.4 |
| Medial meniscus thickness (mm) | 5.7±1.0 |
| Lateral meniscus thickness (mm) | 5.9±0.9 |
| SD: Standard deviation; CAJSAM: Computer-assisted joint space area measurement; WORMS: Whole-organ magnetic resonance imaging score. | |
Intraobserver consistency was evaluated by the comparison of the two CAJSAMs with an interval of one week by the same physician, which revealed no difference (p>0.05, %95 confidence interval, Table 2). Interobserver consistency was evaluated by the comparison of the CAJSAMs performed by two blinded physicians, which revealed no difference. CAJSAM was consistent according to both intra/interobserver consistency (p>0.05, Table 2).
Table 2. Intraobserver and interobserver comparison of computer-assisted joint space area measurements with 95% confidence interval.
| Physician* | Physician** | Interobserver | |
| Mean±SD | Mean±SD | p | |
| CAJSAM of lateral compartment | |||
| First measurement (mm2) | 298.9±51.4 | 300.4±50.6 | 0,072 |
| Second measurement (mm2) | 299.4±50.6 | 300.3±50.7 | 0,124 |
| Intraobserver p values | 0,505 | 0,843 | |
| CAJSAM of medial compartment | |||
| First measurement (mm2) | 222.7±50.3 | 224.0±50.0 | 0,090 |
| Second measurement (mm2) | 222.3±49.9 | 223.1±49.9 | 0,179 |
| Intraobserver p values | 0,270 | 0,317 | |
| *First researcher; **Second researcher; SD: Standard deviation; CAJSAM: Computer-assisted joint space area measurement; Significance level: p<0.05. | |||
As shown in Table 3, there were positive correlations between age and medial femoral cartilage thickness, PFJ and medial femoral cartilage thickness (r=0.322/p=0.043, r=0.360/ p=0.023 and r=-0.345/p=0.029, respectively). There was a negative correlation between age and medial and lateral femoral cartilage thickness (p<0.05). There was no difference between body mass index and other variables (p>0.05).
Table 3. Correlation of continuous variables with p values below.
| Age | MMT | LMT | MFTJ | LFTJ | PFJ | TOT | MJSW | LJSW | MFCT | MTCT | LFCT | LTCT | MJSA | LJSA | |
| MMT | 0,29 | 1 | |||||||||||||
| 0,07 | |||||||||||||||
| LMT | -0,23 | 0.910** | 1 | ||||||||||||
| 0,153 | 0 | ||||||||||||||
| MFTJ | 0.322* 0.043 | -0.334* | -0.382* | 1 | |||||||||||
| 0,035 | 0,015 | ||||||||||||||
| LFTJ | 0.273 0.089 | -0.416* | -0.468** | 0.909** | 1 | ||||||||||
| 0,008 | 0,002 | 0 | |||||||||||||
| PFJ | 0.360* | -0,208 | -0,253 | 0.942** | 0.908** | 1 | |||||||||
| 0,023 | 0,198 | 0,115 | 0 | 0 | |||||||||||
| TOT | 0,328 | -0.314* | -0.355* | 0.961** | 0.964** | 0.964** | 1 | ||||||||
| 0,039 | 0,048 | 0,025 | 0 | 0 | 0 | ||||||||||
| MJSW | -0,277 | 0.728** | 0.679** | -0,023 | -0,075 | 0,093 | -0.004 0.981 | 1 | |||||||
| 0,084 | 0 | 0 | 0,888 | 0,646 | 0,567 | ||||||||||
| LJSW | -0,204 | 0.450** | 0.377* | 0,244 | 0,195 | 0,238 | 0.225 0.162 | 0.660** | 1 | ||||||
| 0,206 | 0,004 | 0,016 | 0,129 | 0,229 | 0,14 | 0 | |||||||||
| MFCT | -0.345* 0.029 | 0.756** | 0.679** | -0,098 | -0,168 | -0,023 | -0.094 0.565 | 0.892** | 0.614** | 1 | |||||
| 0 | 0 | 0,548 | 0,299 | 0,887 | 0 | 0 | |||||||||
| MTCT | -0,179 | 0.728** | 0.654** | -0,143 | -0,264 | -0,117 | -0.179 0.270 | 0.790** | 0.563** | 0.912** | 1 | ||||
| 0,269 | 0 | 0 | 0,38 | 0,099 | 0,472 | 0 | 0 | 0 | |||||||
| LFCT | -0,345 | 0.756** | 0.679** | -0,098 | -0,168 | -0,023 | -0.094 0.565 | 0.892** | 0.614** | 1.000** | 0.912** | 1 | |||
| 0,029 | 0 | 0 | 0,548 | 0,299 | 0,887 | 0 | 0 | 0 | 0 | ||||||
| LTCT | -0,179 | 0.728** | 0.654** | -0,143 | -0,264 | -0,117 | -0.179 0.270 | 0.790** | 0.563** | 0.912** | 1.000** | 0.912** | 1 | ||
| 0,269 | 0 | 0 | 0,38 | 0,099 | 0,472 | 0 | 0 | 0 | 0 | 0 | |||||
| MJSA | -0,276 | 0.825** | 0.781** | -0,193 | -0,262 | -0,066 | -0.188 0.246 | 0.915** | 0.520** | 0.900** | 0.814** | 0.900** | 0.814** | 1 | |
| 0,084 | 0 | 0 | 0,233 | 0,102 | 0,687 | 0 | 0,001 | 0 | 0 | 0 | 0 | ||||
| LJSA | -0,178 | 0.457** | 0.371* | 0,259 | 0,22 | 0,281 | 0.249 0.121 | 0.694** | 0.964** | 0.662** | 0.595** | 0.662** | 0.595** | 0.556** | 1 |
| 0,273 | 0,003 | 0,018 | 0,107 | 0,173 | 0,078 | 0 | 0 | 0 | 0 | 0 | 0 | 0 | |||
| BMI | 0,156 | -0,194 | -0,118 | 0,22 | 0,179 | 0,023 | 0.457 0.662 | -0,238 | -0,299 | -0,077 | -0,117 | -0,179 | -0,345 | -0,168 | -0,269 |
| 0,086 | 0,233 | 0,472 | 0,273 | 0,565 | 0,79 | 0,14 | 0,168 | 0,38 | 0,472 | 0,27 | 0,548 | 0,299 | 0,158 | ||
| * Significance level: P<0.05, ** Significance level: P<0.01. MMT: Medial meniscus thickness; LMT: Lateral meniscus thickness; MFTJ: Medial femorotibial joint score; LFTJ: Lateral femorotibial joint score; PFJ: Patellofemoral joint score; TOT: Total knee score; MJSW: Medial joint space width; LJSW: Lateral joint space width; MFCT: Medial femoral cartilage thickness; MTCT: Medial tibial cartilage thickness; LFCT: Lateral femoral cartilage thickness; LTCT: Lateral tibial cartilage thickness; MJSA: Mean of the medial computer-assisted joint space area measurements; LJSA: Mean of the lateral computer-assisted joint space area measurements; BMI: Body mass index. | |||||||||||||||
While we found negative correlations between meniscal thicknesses and subgroups of WORMS, except PFJ, there were positive correlations among meniscal thicknesses, JSWs, cartilage thicknesses and means of the medial and lateral JSAs. Significant correlations were found between CAJSAM results and quantitative/semi-quantitative staging methods’ results (Table 3). We found a positive correlation between the means of medial and lateral JSAs as well (p<0.01).
Discussion
Computer-assisted joint space area measurement is a quantitative method correlated with JSW, cartilage thickness, meniscal thickness and WORMS. In this study, no difference was found between the measurements of two physicians or between the two measurements made by the same physician (Table 2). According to the results of our study, CAJSAM has intraobserver and interobserver consistency and seems to be a reproducible method. Similar to our results, a study evaluating the hip joints with computer reported a high intraobserver reproducibility of JSW measurement.(10) Distinctly, we evaluated the JSW by measuring the JSA and investigated the interobserver consistency too.
Although the KL classification is a qualitative method depending on the JSW, we detected no correlation between grade and JSW, cartilage thickness, meniscal thickness or means of JSAs. This result can be due to other parameters added to JSW, which are osteophyte formation, subchondral sclerosis and cysts. Also, subjective premises in the KL classification, such as ‘‘equivocal, uncertain, moderate or severe’’ can lead to an inconsistency between measurements. Combination of the structural aspects is a drawback and also, it is generally accepted that it takes at least a year before a change of one grade becomes evident.(11,12)
Joint space narrowing (JSN) in roentgenograms is generally attributed to decreasing thickness of the articular cartilage in knee OA. Meniscal subluxation and degeneration also contribute to the prediction of JSN. Therefore, it could be hypothesized that meniscal tears are contributing to JSN in severe knee OA.(13) In a study, higher grade of JSN was found correlated with higher frequency of meniscal tears, but surprisingly, it was not found correlated with higher frequency of articular cartilage erosion.(14) In our study, we did not detect any correlation between grade of meniscopathy and KL classification. Also, there was no correlation between KL classification and meniscal thickness, cartilage thickness, JSW and JSAs. This may be due to subjectiveness of KL classification.
As we expected, femoral cartilage thickness decreased significantly with increasing age. All scores of WORMS increase by the increasing destruction in the joint. For that reason, in our study, positive correlations was seen between age and all scores of WORMS, because destruction of joint increases by age. As well as the correlation we found among the subgroups of WORMS, significant correlation between each medial and lateral JSAs may show that destruction of a compartment may lead to progression in other compartments too. Significant and negative correlations between subgroups of WORMS (except PFJ) and meniscal thickness may confirm the quantitative side of WORMS. A significant correlation is not expected between PFJ and meniscal thickness.
Recently, quantitative measurements of JSN have been described to be more sensitive to change than the semi-quantitative ratings.(15) Thus, in our study, all the quantitative measurements were significantly correlated with the means of JSAs. This result confirms that CAJSAM is a quantitative method, which may be used instead of the other expensive and laborious methods. In a study conducted with patients suffering from rheumatoid arthritis, CAJSAM was evaluated and found reliable for the assessment of disease-related JSN, with excellent sensitivity and specificity.(16)
Roentgenogram is still the gold standard for evaluating the structural changes, since it is non- invasive, cost-effective, practical and generally accessible in OA.(17,18) Also, in recent years, digital image analysis has gained popularity for increasing efficiency and reliability of measurements.(19-21) Some methods for imaging the joint have been suggested (with MRI or ultrasound), but it is generally accepted that measurement of JSW by roentgenograms is currently the best available method for examining the progression of cartilage destruction. Measurement of JSW is recommended by both The United States Food and Drug Administration and The European Agency for the Evaluation of Medicinal Products, Human Medicines Committee, as the primary end-point in clinical trials.(22,23) JSW can be measured as the narrowest distance between bones (minimum JSW), as the mean width, or as JSA, using an eyepiece or image analysis systems.(12,24)
Although MRI is a promising technique, it is still too laborious and expensive to perform in routine clinical practice or epidemiologic studies.(25-27) Available quantitative methods are taking more time with high costs, but CAJSAM takes not more than two minutes and costs not more than a roentgenogram.
Semi-automated softwares have been developed to improve the accuracy of JSW measurement over manual methods.(14) A semi-automated software, Knee Images Digital Analysis, has shown similar results to software which we have used.(28) Also, a fully automatic software has been developed for computer-aided diagnosis of knee OA, compared with conventional grading systems and semi- automatic measurements, and found reliable and reproducible.(29)
Major parameters measured in these methods are JSA and minimum JSW at medial and lateral sides, osteophyte area, and tibiofemoral angle on plain anteroposterior radiographs. In our study, we did not measure the tibiofemoral angle and osteophyte area separately and did not consider area aligned to the tibial eminences. Contrary to WORMS, we did not include the tibial eminences to measurement because, to our knowledge, it is still unclear whether the tibial eminences contribute to development of OA and whether the changes in tibial eminence are OA specific. Contrary to other semi-automated and fully automated methods, we measured the osteophyte area together with the JSA. By this way, we aimed to make the measurement easier with a unique area and evaluate the contribution of meniscal thickness to JSA measurement. Meniscal thickness and meniscal subluxation contribute the JSN.(17) Also, lack of association between osteophyte formation and JSN was stated before.(29)
We applied the measurements in standing, extended knee roentgenograms. Until late 1960s, non-weight-bearing, anteroposterior, lateral and axial roentgenograms were standard. However, by the study of Ahlback in 1968, weight-bearing anteroposterior and lateral projections became common in practice.(30) There are several reports in the literature, which have suggested the use of weight-bearing, flexed knee roentgenograms instead of extended knee.(31-33) However, a study reported that variations in knee positioning significantly influence the quantitative measurement of radiographic characteristics of OA.(34) A study conducted with normal knees, reported a difference of up to 2 mm between the flexed and extended knees and explained it with the changing contact area between femur and tibia.(35) Therefore, standardization of the radiographic procedure is of great importance. So, we chose the standing and extended roentgenograms to provide a definite standardization.
Our study has some limitations. Although the number of individuals in our study provides the 80% power of the study, sample size should have been larger. Moreover, this method is primarily for evaluating the radiologic progression, thus it should also have been evaluated for the correlation with symptom severity. Instead of developing a new software, we tried to establish a new measuring method with an already present software, which has been in use for a long time, especially for measuring lordosis of spine.(36) Semiautomated methods need a short training for using the software and need attention for manual marking of the edges of the area, which will be measured. Although the software we used has an option of calibrating the measurement by the calibration ruler of the digital image, standardization of the technique is important, especially for comparing the images from different radiology units and different digital roentgenogram devices.
In conclusion, CAJSAM seems to be a practical, useful and cost-effective quantitative method for evaluating the knee OA. It is correlated with quantitative and semi-quantitative methods in MRI. CAJSAM should be studied for evaluating the progression of knee OA during follow- up. Also, standardization of the protocols and prospective blinded studies are required to clarify further questions regarding this measurement method.
Footnotes
Conflict of Interest: The authors declared no conflicts of interest with respect to the authorship and/or publication of this article.
Financial Disclosure: The authors received no financial support for the research and/or authorship of this article.
References
- 1.Peat G, Thomas E, Duncan R, Wood L, Hay E, Croft P. Clinical classification criteria for knee osteoarthritis: performance in the general population and primary care. Ann Rheum Dis. 2006;65:1363–1367. doi: 10.1136/ard.2006.051482. [DOI] [PMC free article] [PubMed] [Google Scholar]
- 2.Kellgren JH, Lawrence JS. Radiological assessment of osteo-arthrosis. Ann Rheum Dis. 1957;16:494–502. doi: 10.1136/ard.16.4.494. [DOI] [PMC free article] [PubMed] [Google Scholar]
- 3.Peterfy CG, Guermazi A, Zaim S, Tirman PF, Miaux Y, White D, et al. Whole-Organ Magnetic Resonance Imaging Score (WORMS) of the knee in osteoarthritis. Osteoarthritis Cartilage. 2004;12:177–190. doi: 10.1016/j.joca.2003.11.003. [DOI] [PubMed] [Google Scholar]
- 4.Peterfy CG, van Dijke CF, Janzen DL, Glüer CC, Namba R, Majumdar S, et al. Quantification of articular cartilage in the knee with pulsed saturation transfer subtraction and fat-suppressed MR imaging: optimization and validation. Radiology. 1994;192:485–491. doi: 10.1148/radiology.192.2.8029420. [DOI] [PubMed] [Google Scholar]
- 5.Pilch L, Stewart C, Gordon D, Inman R, Parsons K, Pataki I, et al. Assessment of cartilage volume in the femorotibial joint with magnetic resonance imaging and 3D computer reconstruction. J Rheumatol. 1994;21:2307–2321. [PubMed] [Google Scholar]
- 6.Eckstein F, Sitteck H, Gavazzenia A, Milz S, Putz R, Reiser M. Assessment of articular cartilage volume and thickness with magnetic resonance imaging (MRI) Trans Orthop Res Soc. 1995;20:194–194. [Google Scholar]
- 7.Eckstein F, Winzheimer M, Hohe J, Englmeier KH, Reiser M. Interindividual variability and correlation among morphological parameters of knee joint cartilage plates: analysis with three-dimensional MR imaging. Osteoarthritis Cartilage. 2001;9:101–111. doi: 10.1053/joca.2000.0365. [DOI] [PubMed] [Google Scholar]
- 8.Cicuttini F, Forbes A, Asbeutah A, Morris K, Stuckey S. Comparison and reproducibility of fast and conventional spoiled gradient-echo magnetic resonance sequences in the determination of knee cartilage volume. J Orthop Res. 2000;18:580–584. doi: 10.1002/jor.1100180410. [DOI] [PubMed] [Google Scholar]
- 9.Glaser C, Faber S, Eckstein F, Fischer H, Springer V, Heudorfer L, et al. Optimization and validation of a rapid high-resolution T1-w 3D FLASH water excitation MRI sequence for the quantitative assessment of articular cartilage volume and thickness. Magn Reson Imaging. 2001;19:177–185. doi: 10.1016/s0730-725x(01)00292-2. [DOI] [PubMed] [Google Scholar]
- 10.Nishii T, Shiomi T, Sakai T, Takao M, Yoshikawa H, Sugano N. Computational measurement of joint space width and structural parameters in normal hips. Arch Orthop Trauma Surg. 2012;132:591–598. doi: 10.1007/s00402-012-1463-1. [DOI] [PubMed] [Google Scholar]
- 11.Boegård TL, Rudling O, Petersson IF, Jonsson K. Joint space width of the tibiofemoral and of the patellofemoral joint in chronic knee pain with or without radiographic osteoarthritis: a 2-year follow- up. Osteoarthritis Cartilage. 2003;11:370–376. doi: 10.1016/s1063-4584(03)00030-x. [DOI] [PubMed] [Google Scholar]
- 12.Vignon E, Conrozier T, Hellio Le Graverand MP. Advances in radiographic imaging of progression of hip and knee osteoarthritis. J Rheumatol. 2005;32:1143–1145. [PubMed] [Google Scholar]
- 13.Hunter DJ, Zhang YQ, Tu X, Lavalley M, Niu JB, Amin S, et al. Change in joint space width: hyaline articular cartilage loss or alteration in meniscus? Arthritis Rheum. 2006;54:2488–2495. doi: 10.1002/art.22016. [DOI] [PubMed] [Google Scholar]
- 14.Chan WP, Huang GS, Hsu SM, Chang YC, Ho WP. Radiographic joint space narrowing in osteoarthritis of the knee: relationship to meniscal tears and duration of pain. Skeletal Radiol. 2008;37:917–922. doi: 10.1007/s00256-008-0530-8. [DOI] [PMC free article] [PubMed] [Google Scholar]
- 15.Mazzuca SA, Brandt KD, Katz BP, Lane KA, Buckwalter KA. Comparison of quantitative and semiquantitative indicators of joint space narrowing in subjects with knee osteoarthritis. Ann Rheum Dis. 2006;65:64–68. doi: 10.1136/ard.2005.037069. [DOI] [PMC free article] [PubMed] [Google Scholar]
- 16.Pfeil A, Renz DM, Hansch A, Kainberger F, Lehmann G, Malich A, et al. The usefulness of computer-aided joint space analysis in the assessment of rheumatoid arthritis. Joint Bone Spine. 2013;80:380–385. doi: 10.1016/j.jbspin.2012.10.022. [DOI] [PubMed] [Google Scholar]
- 17.Buckland-Wright JC. Quantitative radiography of osteoarthritis. Ann Rheum Dis. 1994;53:268–275. doi: 10.1136/ard.53.4.268. [DOI] [PMC free article] [PubMed] [Google Scholar]
- 18.Nevitt MC. Definition of hip osteoarthritis for epidemiological studies. Ann Rheum Dis. 1996;55:652–655. doi: 10.1136/ard.55.9.652. [DOI] [PMC free article] [PubMed] [Google Scholar]
- 19.Buckland-Wright JC, Macfarlane DG, Williams SA, Ward RJ. Accuracy and precision of joint space width measurements in standard and macroradiographs of osteoarthritic knees. Ann Rheum Dis. 1995;54:872–880. doi: 10.1136/ard.54.11.872. [DOI] [PMC free article] [PubMed] [Google Scholar]
- 20.Schmidt JE, Amrami KK, Manduca A, Kaufman KR. Semi-automated digital image analysis of joint space width in knee radiographs. Skeletal Radiol. 2005;34:639–643. doi: 10.1007/s00256-005-0908-9. [DOI] [PubMed] [Google Scholar]
- 21.Hellio Le Graverand MP, Mazzuca S, Duryea J, Brett A. Radiographic grading and measurement of joint space width in osteoarthritis. Rheum Dis Clin North Am. 2009;35:485–502. doi: 10.1016/j.rdc.2009.08.005. [DOI] [PubMed] [Google Scholar]
- 22.FDA/CDER resource page. Food and Drug Administration Website. Guidance for industry: clinical development programs for drugs, devices, and biological products intended for the treatment of osteoarthritis. Available from: http://www.fda.gov/ cder/guidance/2199dft.htm. [Access: August 01, 2014] [Google Scholar]
- 23.The European Agency for the Evaluation of Medicinal Products Human Medicines Committee for proprietary medicinal products (CTMP) points to consider on the clinical investigation of medicinal products used in the treatment of osteoarthritis. Available from: http:// www.ema.europa.eu/docs/en_GB/document_library/ Scientific_guideline/2009/09/WC500003440.pdf [Access: August 01, 2014] [Google Scholar]
- 24.Dacre JE, Huskisson EC. The automatic assessment of knee radiographs in osteoarthritis using digital image analysis. Br J Rheumatol. 1989;28:506–510. doi: 10.1093/rheumatology/28.6.506. [DOI] [PubMed] [Google Scholar]
- 25.Abadie E, Ethgen D, Avouac B, Bouvenot G, Branco J, Bruyere O, et al. Recommendations for the use of new methods to assess the efficacy of disease- modifying drugs in the treatment of osteoarthritis. Osteoarthritis Cartilage. 2004;12:263–268. doi: 10.1016/j.joca.2004.01.006. [DOI] [PubMed] [Google Scholar]
- 26.Burstein D, Gray ML. Is MRI fulfilling its promise for molecular imaging of cartilage in arthritis? Osteoarthritis Cartilage 2006;14:1087-90. Burstein D, Gray ML. Is MRI fulfilling its promise for molecular imaging of cartilage in arthritis? Osteoarthritis Cartilage 2006;14:1087-90. doi: 10.1016/j.joca.2006.07.001. [DOI] [PubMed] [Google Scholar]
- 27.Eckstein F, Burstein D, Link TM. Quantitative MRI of cartilage and bone: degenerative changes in osteoarthritis. NMR Biomed. 2006;19:822–854. doi: 10.1002/nbm.1063. [DOI] [PubMed] [Google Scholar]
- 28.Marijnissen AC, Vincken KL, Vos PA, Saris DB, Viergever MA, Bijlsma JW, et al. Knee Images Digital Analysis (KIDA): a novel method to quantify individual radiographic features of knee osteoarthritis in detail. Osteoarthritis Cartilage. 2008;16:234–243. doi: 10.1016/j.joca.2007.06.009. [DOI] [PubMed] [Google Scholar]
- 29.Oka H, Muraki S, Akune T, Mabuchi A, Suzuki T, Yoshida H, et al. Fully automatic quantification of knee osteoarthritis severity on plain radiographs. Osteoarthritis Cartilage. 2008;16:1300–1306. doi: 10.1016/j.joca.2008.03.011. [DOI] [PubMed] [Google Scholar]
- 30.Ahlbäck S. Osteoarthrosis of the knee. A radiographic investigation. . Acta Radiol Diagn (Stockh) 1968;277:7–72. [PubMed] [Google Scholar]
- 31.Davies AP, Calder DA, Marshall T, Glasgow MM. Plain radiography in the degenerate knee. A case for change. J Bone Joint Surg Br. 1999;81:632–635. doi: 10.1302/0301-620x.81b4.9667. [DOI] [PubMed] [Google Scholar]
- 32.Dervin GF, Feibel RJ, Rody K, Grabowski J. 3-Foot standing AP versus 45 degrees PA radiograph for osteoarthritis of the knee. Clin J Sport Med. 2001;11:10–16. doi: 10.1097/00042752-200101000-00003. [DOI] [PubMed] [Google Scholar]
- 33.Piperno M, Hellio Le Graverand MP, Conrozier T, Bochu M, Mathieu P, Vignon E. Quantitative evaluation of joint space width in femorotibial osteoarthritis: comparison of three radiographic views. Osteoarthritis Cartilage. 1998;6:252–259. doi: 10.1053/joca.1998.0118. [DOI] [PubMed] [Google Scholar]
- 34.Kinds MB, Vincken KL, Hoppinga TN, Bleys RL, Viergever MA, Marijnissen AC, et al. Influence of variation in semiflexed knee positioning during image acquisition on separate quantitative radiographic parameters of osteoarthritis, measured by Knee Images Digital Analysis. Osteoarthritis Cartilage. 2012;20:997–1003. doi: 10.1016/j.joca.2012.04.016. [DOI] [PubMed] [Google Scholar]
- 35.Deep K, Norris M, Smart C, Senior C. Radiographic measurement of joint space height in non-osteoarthritic tibiofemoral joints. A comparison of weight-bearing extension and 30 degrees flexion views. J Bone Joint Surg Br. 2003;85:980–982. doi: 10.1302/0301-620x.85b7.13930. [DOI] [PubMed] [Google Scholar]
- 36.Kuru O, Sahin B, Kaplan S. Alternative approach to evaluating lumbar lordosis on direct roentgenograms: projection area per length squared. Anat Sci Int. 2008;83:83–88. doi: 10.1111/j.1447-073X.2007.00210.x. [DOI] [PubMed] [Google Scholar]