Abstract
In the layered cuprate perovskites, the occurrence of high-temperature superconductivity seems deeply related to the unusual nature of the hole excitations. The limiting case of a very small number of holes diffusing in the antiferromagnetic (AF) background may provide important insights into this problem. We have investigated the transport properties in a series of crystals of YBa2Cu3Oy, and found that the temperature dependencies of the Hall coefficient RH and thermopower S change abruptly as soon as the AF phase boundary is crossed. In the AF state at low temperatures T, both RH and S are unexpectedly suppressed to nearly zero over a broad interval of T. We argue that this suppression arises from near-exact symmetry in the particle-hole currents. From the trends in RH and S, we infer that the symmetry is increasingly robust as the hole density x becomes very small (x ≃ 0.01). We discuss implications for electronic properties both within the AF state and outside.
In the layered cuprate perovskites, high-temperature superconductivity appears when a moderate density of holes are introduced into the CuO2 planes by chemical doping. The parent (undoped) compound is a Mott insulator with a spin-½ moment residing on each Cu ion in the plane. Below the Néel temperature, long-range, three-dimensional (3D) antiferromagnetism is stable. The introduction of holes destroys the static 3D antiferromagnetic (AF) order, and superconductivity appears when the relative hole population x exceeds ≈0.05 per Cu ion. In the quest to understand cuprate superconductivity, it has long been recognized that determining the nature of the itinerant hole moving in a sea of disordered spin-½ moments with short-range AF order is an essential step. Because semiclassical approximations are not reliable for this spin-½ system, the problem has remained intractable despite a decade of theoretical effort (1–6). In the dilute limit (x < 0.05), the hole has been variously described as a “holon” moving in a resonating valence bond liquid (1), or an excitation dressed with a spiral spin-current backflow (2), or as a charge trailing a phase string (4).
In this limit, the signals from the itinerant carriers become increasingly difficult to resolve from background signals, especially in experiments that “see” all of the valence electrons in the sample. Transport experiments, which probe directly the itinerant holes without background problems, would appear to have a valuable role to play. To date, however, the available transport data in the very underdoped limit come almost entirely from the single-layer cuprate La2-xSrxCuO4 (LSCO). The resistivity and Hall results in LSCO do not appear to be qualitatively different from those in the moderately underdoped regime (0.05 < x < 0.13; refs. 7 and 8). However, because doping by Sr substitution creates strong disorder, there is good reason to suspect that results in LSCO reflect the properties of the disorder-dominated CuO2 plane.
Doping-induced disorder is much less of a factor in the bilayer cuprate YBa2Cu3Oy (YBCO) because chemical doping proceeds by varying the oxygen content in the chains. In the phase diagram of YBCO, the Néel state with 3D long-range antiferromagnetism exists in a broad range of oxygen concentration 6.0 < y < 6.40 (9–11). Above 6.40, long-range static AF order is suppressed by the motion of holes [however, intriguing evidence for a slowly fluctuating commensurate AF magnetization has been reported (12) in a crystal with y = 6.50]. Despite the large range accessible by oxygen doping, the AF state is little explored by transport experiments. Recently, “d-wave” anisotropy in the in-plane magnetoresistance has been observed (at y = 6.30) and interpreted in terms of stripes (13). By and large, however, transport results in this regime are very sparse. Previously, the systematic variation of RH and ρ in YBCO was reported by Ito et al. (14) for crystals with y > 6.40.
In extending Hall and thermopower measurements deep into the AF regime in YBCO, we have found that the Hall coefficient and thermopower profiles change remarkably as soon as we cross the phase boundary at y = 6.40. Within the AF state, we find that the electronic state is characterized by a very robust type of particle-hole symmetry that causes both the Hall coefficient RH and in-plane thermopower S to decrease strongly to zero below TN. In conventional metals and semimetals, cancellation of the Hall and thermopower signals occurs only at one or two accidental temperatures. Our results on RH and S imply a self-adjusting mechanism that maintains this cancellation over the whole low-temperature region of the AF phase. The existence of particle-hole symmetry places strong constraints on models for the electronic state in the AF regime.
Experimental Results
YBCO crystals were grown with near-optimal oxygen content in a Ba2CuOx flux by using yttria-stabilized zirconia (YSZ) crucibles. To tune the oxygen content to a particular value y, we first attached three pairs of electrical contacts on each crystal, using EPO-TEK H20E silver epoxy, and then sealed the crystals in a quartz tube with crushed polycrystalline YBCO previously prepared with the desired y. The crystals (of thicknesses 10–30 μm) were initially annealed at 550°C for a week, and then slowly cooled (at 30°C/h) to 150°C, and held there for 3 weeks to optimize chain ordering (11, 15). The final cooling to 25°C takes ≈12 h (we did not de-twin any of the crystals). [The low-T annealing at 150°C seems crucial to our observations. A common practice in the past is to work with crystals that have been quenched directly from ≈520°C to room temperature (quenching has the merit of providing a sharp resistive transition in crystals with y < 6.50). In the range 6.30 < y < 6.40, however, the quenched disorder produces a Tc that is strongly suppressed, often to below 4 K, and a nonmetallic ρ profile. Subsequent “shelf” annealing at room temperature produces an upward creep of Tc as equilibrium is slowly restored (for y = 6.41, for instance, Tc creeps from 13 to 27 K over a 6-day period; ref. 15). It appears that quenching leads to a large degree of in-plane disorder, which causes localization and strong Tc suppression. However, the disorder can be removed by low-T annealing. The upward creep in Tc is not observed in our annealed crystals.]
A recent detailed calibration (Y.W., T. Kakeshita, S. Uchida, and N.P.O., unpublished data) finds that the in-plane hole density x in YBCO varies linearly with y in the underdoped regime as
 |
1 |
In the range 6.23 < y < 6.63, we measured in the same crystal the three in-plane quantities, resistivity ρ, Hall coefficient RH, and thermopower S (samples 1–6). S and ρ, but not RH, were measured in samples with larger y (samples 7–9). RH was typically measured with an AC current by slowly sweeping the applied field H from −8 T to +8 T and back with T fixed (for all samples here, RH is H-independent). Above 250 K, the swept-field Hall data were supplemented by high-density data obtained by a generalized van der Pauw method (fixing H at 14 T and alternating the current and Hall voltage contacts; where they overlap, the two data sets agree within our uncertainty). S was measured with a thermal gradient of 0.5 K/mm. We corrected for the small contribution from the Au leads.
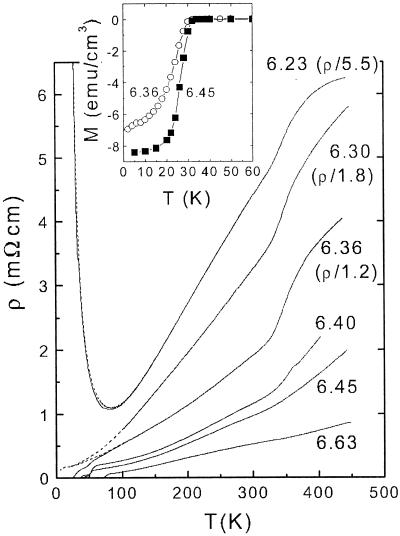
Fig. 1 displays the in-plane resistivity for several of the crystals measured. In sample 1, which has the smallest y (6.23), ρ increases in a nearly activated way as T decreases below 70 K, implying strong localization of the carriers. At high temperature (above 320 K), ρ saturates at 38 mΩ⋅cm (corresponding to a mobility μ ≈ 2 cm2/V⋅s). Between these two limits, ρ varies almost linearly with T. All three features qualitatively resemble those observed in very underdoped LSCO (x = 0.04; ref. 7; the magnitudes are also comparable if we scale by the hole density given by Eq. 1). Samples 2 and 3 also show the T-linear variation, but strong localization is not observed at low T (see below).
Figure 1.
The in-plane resisitivity ρ of YBCO crystals measured in samples 1 (y = 6.23), 2 (6.30), 3 (6.36), 4 (6.40), 5 (6.45), and 6 (6.63) (the data in samples 1–3 are reduced by the factors shown). Broken lines for samples 1–3 represent ρ in a 14-T field H ∥ ĉ (in sample 1, the broken line nearly coincides with the zero-H data). The inset shows the magnetization curves taken with H = 10 Oe in samples 3 and 5.
Interestingly, as we cross the AF phase boundary, the T-linear dependence abruptly changes to the familiar “S-shaped” profile that characterizes ρ in the doping range 6.40 < y < 6.70. In this range, our ρ are in quantitative agreement with the data of Ito et al. (14).
In the narrow range 6.30 < y < 6.40 just inside the AF regime, Tc (determined by flux expulsion) is highly sensitive to y. As shown in the Inset of Fig. 1, Tc in sample 3 (y = 6.36) equals 30 K, compared with 27 K measured by Veal et al. (15) in a crystal with y = 6.38, after long-time relaxation. However, a lower Tc (12 K) has been observed by Bonn et al. in a high-purity, de-twinned crystal (y = 6.35). Moreover, in samples 2 and 3, ρ and S show evidence for paraconducting fluctuations starting at 70 K. Because of this variability, we will not base any of our conclusions on the behavior of ρ in samples 2 and 3 in zero H below 70 K. [We note, however, that in a 14-Tesla field H ∥ ĉ, ρ in samples 2 and 3 saturates to a nearly T-independent value as bulk superconductivity is suppressed (broken lines in Fig. 1). We do not observe the upturn in ρ associated with localization, in sharp contrast with sample 1. In sample 1, ρ measured in a 14-T field ∥ ĉ (broken line) very nearly coincides with the zero-H data. Provided that the 14-Tesla field is high enough to yield the “normal-state” ρ profile in samples 2 (x ≃ 0.04) and 3 (x ≃ 0.064), their metallic behavior implies that the critical value xc for localization in YBCO is much smaller than in LSCO (xc ≃ 0.14). This conclusion is preliminary until we repeat the ρ measurements at much higher fields.]
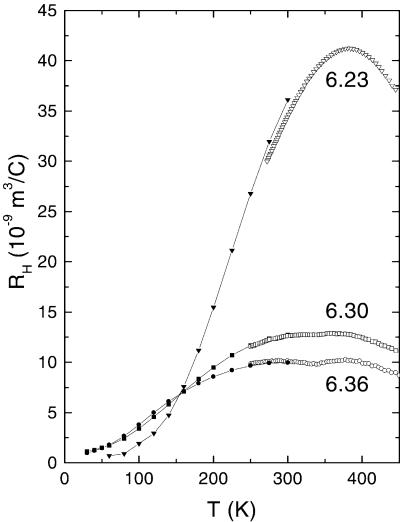
We describe next the (weak-field) Hall coefficient RH in these samples. Fig. 2 displays the T dependence of RH in samples 1–3 (with y = 6.23, 6.30, and 6.36, respectively), which lie within the AF region of the phase diagram. Because of the very low carrier densities in these samples, the high-temperature values of RH are dramatically enhanced (10–20 times larger than in optimally doped YBCO). At a temperature close to the Néel temperature TN ≈ 410 K, RH attains a peak value of 42 × 10−9 m2/C, corresponding to a Hall density nH of 1.50 × 1020 cm−3. Below TN, RH decreases steeply, saturating below 70 K to a very small positive value nearly ≈50 times weaker than the peak value. The Hall profiles in samples 2 and 3 also show similar decreases below TN. However, the peak RH values are smaller (consistent with a higher hole concentration) and the low-T values are not as strongly suppressed.
Figure 2.
The in-plane Hall coefficient RH of YBCO crystals measured in samples 1–3 with y = 6.23, 6.30, and 6.36, respectively. In sample 1, RH attains a broad maximum near the Néel temperature TN and decreases by ≈50 below 70 K. Samples 2 and 3 have a similar behavior except that the low T values are not as strongly suppressed. A slight minimum (“notch”) occurs near TN in 2 and 3, but not in 1. In each curve, the high-density data above 250 K were taken by using a technique of alternating the current and voltage contacts with H fixed at 14 T. Data with wider spacing were taken by slowly scanning the field between −8 and +8 T and back at fixed T.
These profiles differ strikingly from the standard RH profile observed in underdoped cuprates at moderately high doping. In crystals with y ≃ 6.60, RH increases nominally as 1/T as the temperature decreases, and attains a maximum at a temperature Tmax,H ≈ 110–120 K (this may be the most familiar profile of RH in underdoped cuprates).
The evolution of the Hall profiles in samples 1–3 to the pattern seen at higher doping is shown in Fig. 2 for samples 4–6 with y = 6.40, 6.50, and 6.60, respectively.
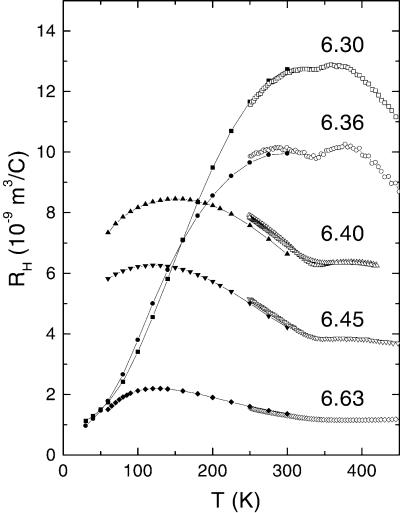
In examining the Hall curves in Fig. 3, we find that they separate naturally into two classes of behavior. Inside the AF phase (samples 2 and 3, which are reproduced here), RH reaches a maximum at Tmax,H close to TN, and then decreases below. The region over which RH is suppressed extends up to 300 K. Samples outside the AF phase (4–7), however, follow a common pattern that is distinct from that in the AF phase. Above the “notch” temperature Ts ≈ 350 K (where a slight minimum may be observed), RH is nearly T-independent. (We will discuss the notch elsewhere.) Below Ts, RH increases to a broad peak at Tmax,H that is much lower than in the AF phase.
Figure 3.
The in-plane Hall coefficient RH of YBCO in samples 2–6 with y = 6.30, 6.36, 6.40, 6.45, and 6.63, respectively. The profiles of RH in samples 2 and 3 are qualitatively different from those in samples 4–6. In samples 2 and 3, RH peaks near TN and decreases monotonically as in Fig. 2. However, in samples 4–6 (TN ≈ 0), the peak temperature in RH is systematically lower as y increases beyond 6.40. All samples display a “notch” near 350 K where ρ displays a slope change.
From Figs. 2 and 3, we infer the following trend. Deep in the AF state, strong suppression of RH is apparent over a wide range of T (samples 1–3). However, when the AF boundary is crossed (y = 6.40), this region of suppressed RH and S fills in abruptly. Concurrently, the peak temperatures in RH abruptly falls from 350 K to 150 K in sample 4, and to 120 K in sample 6 (y = 6.63).
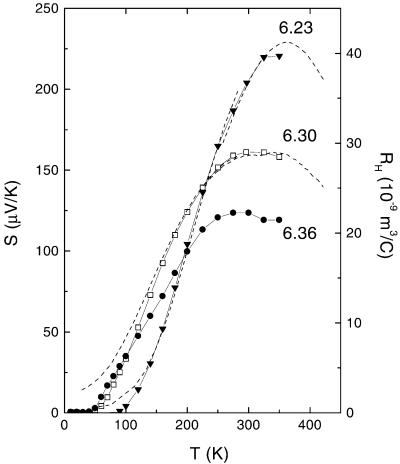
Remarkably, the pattern of behavior in RH is matched by the behavior of the in-plane thermopower S. Fig. 4 displays S measured in samples 1–3. As in RH, the thermopower attains a broad peak near TN and then decreases monotonically below TN. The suppression of S below TN extends over a broad range of T in these samples. A striking feature of S in these samples is that it has virtually the same T dependence as RH. To facilitate comparison, the curves of RH in samples 1 and 2 are replotted as broken lines in Fig. 4 and scaled to match the corresponding curves for S. The comparisons show that both the Hall effect and thermopower are suppressed in nearly the same way over a wide range of T inside the AF phase.
Figure 4.
The in-plane thermopower S in samples 1–3 of YBCO (data points). In samples 1 and 2, S decreases monotonically nearly to zero as T decreases below TN with nearly the same T dependence as RH. The broken lines represent RH in samples 1 and 2 (values of RH are on the right scale). In sample 2 (y = 6.30), RH is shown multiplied by 2.25.
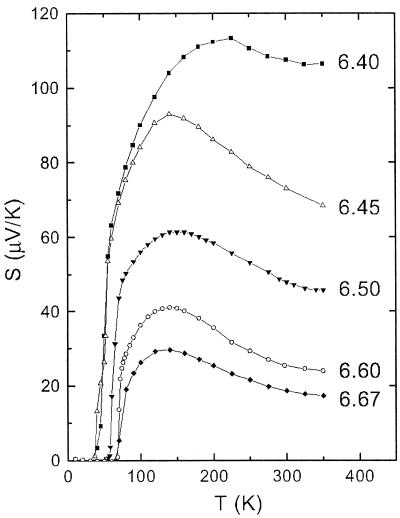
We display the thermopower at higher doping in Fig. 5. The gradual evolution of the profile of S vs. T in the AF phase to the more familiar profile at moderate doping also agrees with the corresponding changes in RH. For y < 6.40 the peak in S is close to TN, whereas for y > 6.40 it decreases systematically, eventually reaching 120 K at y = 6.67.
Figure 5.
The in-plane thermopower S in samples 4–8 of YBCO (with y = 6.40, 6.45, 6.50, 6.60, and 6.67), which lie outside the AF region. In each sample, S attains a peak at a temperature close to the peak temperature of RH.
The simultaneous suppression of the Hall and thermopower signals is anomalous. We review below the general conditions under which cancellation of these signals is observed in conventional metals and semiconductors.
Discussion
In the simplest case of a single-band isotropic Fermi Surface (FS) with carrier density n, the weak-field RH is expected to increase as 1/n, and S ≈ 1/ɛF as n decreases (ɛF is the Fermi energy).
For our experiment, the important aspect of RH and S is their sensitivity to the sign of the carriers. When both electrons and holes are present (mixed conduction), the observed Hall and thermopower signals are the algebraic sums of contributions from the two carrier types.
In terms of σ (conductivity) and σH (Hall conductivity), RH equals σH/σ2 H. As σH measures the transverse current produced by the Lorentz force in an applied H, it is sensitive to the sign of the carrier charge. For mixed conduction, σH is the sum
 |
2 |
where the electron and hole Hall conductivities
(σ and σ
and σ , respectively) are of
opposite signs. In a two-dimensional (2D) metal with
arbitrary FS shape and lifetime anisotropy,
σH scales as 〈ℓ2〉
(where ℓ is the mean-free-path and 〈⋅ ⋅ ⋅〉 denotes
averaging over the FS; ref.
16).‡ Exact
cancellation between the two terms, if any, occurs at discrete
accidental temperatures where their 〈ℓ2〉
happen to be equal. Away from these accidental values of T,
the scale of RH is of the order
1/ne with n set by the dominant FS pocket.
Whereas the sign of σH depends on the FS curvature of the dominant pocket, the thermopower probes particle-hole asymmetry in a rather different sense. In a thermopower measurement, the current generated by an applied temperature gradient −∇T is cancelled by an opposite current produced by an electric field E (produced by charge accumulation at the ends of the sample). We have
 |
3 |
where α is the Peltier conductivity and σ the electrical conductivity. In conventional metals with a single FS, the thermopower S = −E/∇T| = α/σ is given by
 |
4 |
where the “conductivity function” 𝒢(ɛ) = e2D(ɛ)〈vxℓx〉 is essentially the integrand of D(ɛ) weighted by the product vxℓx. Hence, S may vanish if 𝒢 displays exact particle-hole symmetry about μ. (If we have separate particle and hole FS pockets, S may also vanish by accidental cancellation as discussed for σH.)
Unlike the case for σH, full cancellation leading to a zero S is rarely observed, especially in the low-density limit. When S is observed to cross zero, as at low T in noble metals (e.g., Au), the cause is an extraneous effect (phonon drag) rather than a matching of the derivatives of 𝒢(ɛ). The present results are all of the more unusual because RH and S share nearly the same T dependence over such a broad range of T. Some of the issues are aired by analyzing the following situations.
It is fair to ask whether, in the most underdoped samples, the holes undergo charge segregation and are confined to macroscopic high-conductivity regions that are connected along the sample length. We argue that the local nature of current cancellation (Eq. 3) in a thermopower measurement rules out this scenario. The high-conductivity channel may be modeled as a self-avoiding chain of N segments (of conductivities αM and σM) described by dj ≡ djêj. Applying Eq. 3 to each segment, we have
 |
5 |
As the sum of Ej ⋅ dj over j is the observed Seebeck voltage, Eq. 5 implies that the observed thermopower takes on the value of the high-conductivity material—i.e., the conducting channel largely determines the Seebeck voltage. We believe that the sharp differences between the profiles of S in samples 1 and 5, say, precludes this scenario.
A related issue is whether localization plays a role in the suppression of RH. In conventional systems, the onset of Anderson localization either leaves RH unchanged through the metal-insulator transition (Si:P and In2O3) or to an increase in RH (Si:B and Ge:Sb; references to the Hall results and in Anderson localization can be found in ref. 17)—i.e., the opposite of what is needed to account for the present data. In underdoped LSCO (where the onset of strong localization is most heavily studied), localization also leads to an increasing RH at low T (18, 19). We are not aware of a material in which an increase in ρ (driven by localization) is accompanied by a plummeting RH. Quite apart from these general remarks on the behavior of RH in the presence of localization, we note that the regime of localization in YBCO is quite restricted. In sample 1 it onsets at 70 K, whereas RH and S start declining at 300 K (Fig. 2), so these can hardly be related phenomena. Similarly, in samples 2 and 3, the behavior of ρ in an intense field (Fig. 1) sets a conservative upper bound of ≈20 K for the onset of localization, whereas RH and S start falling at 300 K. We conclude that the suppression of RH is unrelated to localization.
Finally, we note that a quasi-one-dimensional (1D) electronic state in itself does not ensure a zero RH (see also ref. 20). Quasi-1D conductors whose Hall effect have been measured typically display a finite and strongly T dependent RH (21) because a very small but measurable hopping amplitude transverse to the chains is sufficient to produce a finite Hall resistivity (the low carrier densities in these systems also strongly amplify RH).
Particle-Hole Symmetry
With the above remarks, let us discuss RH and S in samples 1–3 (Figs. 2 and 4). The overall scale of RH in Figs. 2 and 3 (as indicated by its peak value) increases rapidly as y decreases to 6.20. Interestingly, we find that the Hall density nH = (eRH)−1 evaluated at the peak is in very good agreement with the calibration Eq. 1. Hence, RH starts falling from a value fixed by the hole density near TN, and then decreases virtually to zero. The decrease is matched by that in S. In this state, particle-hole symmetry of a rather unusual type appears, and becomes increasingly robust with decreasing T.
As discussed above, we believe that the decrease in both quantities arises from cancellation between particle and hole-like currents. To achieve the cancellation in RH, both the carrier densities and the average mean-free-paths must be closely matched in the two pockets over an extended range of T. Moreover, to maintain the same cancellation in S, the derivatives of 𝒢(ɛ) in the two pockets must be equal in magnitude. Hence, the observed behaviors of RH and S place very stringent conditions on the electronic state. There appears to be a self-adjusting mechanism that automatically maintains the symmetry of the particle and hole currents over a broad range of T below TN.
In the striped phase that appears in Nd-doped LSCO below the
LTT-LTO (low-temperature tetragonal to orthorhombic) transition at
Td ≈ 74 K (22, 23),
RH (as well as
σH) are observed to decrease toward zero nearly
linearly with T below Td
(24). S also decreases below
Td, but at a faster rate. Whereas the
earlier discussion of a vanishing RH
was in terms of quasi-1D behavior, a recent analysis proposes
particle-hole symmetry as the cause (20). At the hole concentration
x =  in Nd-doped LSCO, the conducting chains
are ¼-filled, so that the charge carriers have exact
particle-hole symmetry (equivalent to a ½-filled 1D band for
spinless fermions). This readily accounts for the rapid suppression of
S as well. There is possibly a close relationship between
the LTT phase in Nd-doped LSCO and the particle-hole symmetric state in
YBCO. However, we note that there is a wide disparity in the hole
densities. In sample 1, the estimated x ≃ 0.01 is an
order of magnitude smaller than that in the Nd-LSCO material. To
account for the vanishing of both RH
and S, it seems that the ¼-filled chain scenario
must extend to this low concentration in YBCO. At such low doping
levels, however, the chains have to be ≈50 lattice spacings apart.
This would appear to be a serious problem unless it can be shown that
such widely separated ¼-filled chains are energetically
favorable.
A competing model in the AF regime is the nodal excitation at the nodes of the pseudogap state (25). Where in k-space do the doped holes end up in the limit x → 0? In the insulating oxychloride cuprate Ca2CuO2Cl2 angle-resolved photoemission spectroscopy (ARPES) experiments (26) reveal that the occupied states (in the lower Hubbard band) nearest in energy to the chemical potential are located at the points (±π/2, ±π/2). This finding implies that doped holes should initially occupy the nodes of the pseudogap. Recently, Takagi and Shen (H. Takagi and Z. X. Shen, personal communication) succeeded in growing crystals of Ca2−xNaxCuO2Cl2 with Na content x = 0.10. ARPES experiments confirm that the holes indeed occupy short FS “arcs” around these nodes (H. Takagi and Z. X. Shen, personal communication). Future ARPES experiments on crystals with smaller x should determine whether the arcs decrease to point-like nodes. If, in the limit x → 0, the chemical potential is pinned at the cusp of the Dirac cone in the “clean” cuprates, we expect the nodal excitations at the bottom of the cone to dominate the transport properties. The symmetry of the density of states about the chemical potential then implies a zero S, which may account for our thermopower results. It remains to be seen whether the Hall currents cancel in this limit as well.
Implications Outside AF Regime
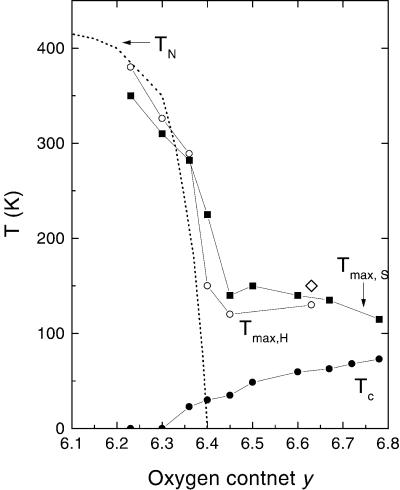
Although we have mainly discussed the matched variation of S and RH within the AF region (samples 1–3), we find that the two quantities also share common features at higher doping. At doping levels 6.40 < y < 6.70, the peak temperatures Tmax,H and Tmax,S continue to track each other, as is the case inside the AF region (Fig. 6). Within the AF regime (y < 6.40), the peak temperatures closely follow the TN line (10). As we increment y from 6.36 to 6.40, both peak temperatures fall steeply together with TN. Above 6.40, TN is nominally zero, but Tmax,H and Tmax,S remain at fairly elevated temperatures (150–110 K). As the plots show, the change at 6.40 is quite abrupt. Interestingly, the maximum (at 150 K) in the 63Cu nuclear relaxation rate (T1T)−1 for y = 6.60 also falls on this line (ref. 27; this is often identified as the pseudogap temperature T* in YBCO).
Figure 6.
Dependence on y of the peak temperatures of RH (Tmax, H, open circles) and S (Tmax, S, solid squares) in YBCO. The y dependence of the Néel temperature TN is the broken line (10). For y < 6.40 the peak temperatures in RH and S follow closely to TN. At higher doping, however, the peak temperatures stay significantly higher than Tc (solid circles). The open diamond is the peak temperature of (T1T)−1 (27).
Although the strong resemblance between the profiles of RH and S found within the AF regime is less evident outside, the profiles remain surprisingly similar in the vicinity of the peak temperatures over a large doping regime (6.40 < y < 6.70). Because this correlated behavior can hardly be accidental, it raises the following question. What is the origin of the peak in S and RH (and their pronounced decrease below Tmax,H and Tmax,S) of the underdoped phase of YBCO that has long been observed? By comparing the behavior with that in the AF regime, we are intrigued by the possibility that the cuprate plane is restoring the particle-hole symmetric state at these high doping levels even though static long-ranged antiferromagnetism is now absent. The “flow” toward a state with particle-hole symmetry seems to be operative even at relatively high doping (6.50 < y < 6.70), but its effects on transport only become apparent below 150 K. At these doping levels, strong AF correlation may survive as a very slowly fluctuating order that gradually condenses with decreasing T [as observed in a recent neutron scattering experiment (12) in a crystal with y = 6.50]. This spin ordering does not strongly effect transport properties until T falls below the line at 120–150 K. Below this line, however, we recover the particle-hole symmetric state in which both S and RH approach zero. This new view, that the peaks in RH and S in the underdoped regime reflect the increased dominance of the particle-hole symmetric state, invites a careful reassessment of previous conclusions regarding the peaks (see refs. 28 and 29 for detailed discussions of S vs. doping in polycrystalline YBCO).
Acknowledgments
We have benefited from the critical comments and helpful suggestions of B. Keimer, S. Kivelson, R.B. Laughlin, V. Muthukumar, Z. X. Shen, H. Takagi, J. Tranquada, and S. Uchida. We acknowledge support from the U.S. National Science Foundation (MRSEC Grant NSF-DMR 98-09483), and a grant from the New Energy and Industrial Technology Development Organization, Japan (NEDO).
Abbreviations
- FS
Fermi Surface
- YBCO
YBa2Cu3Oy
- LSCO
La2-xSrxCuO4
- AF
antiferromagnetic
Footnotes
This paper was submitted directly (Track II) to the PNAS office.
In 2D, for arbitrary FS anisotropy, the
weak-field σH is given by σH =
(2e2/h)(B⋅ /φ0),
where φ0 = h/e is the
normal flux quantum and
  ≡
½ ∮ dℓ⃗k ×
ℓ⃗k is the directed area swept out by
the mean-free-path ℓ⃗k as the state
k is taken around the FS.
References
- 1.Anderson PW. Science. 1987;235:1196–1198. doi: 10.1126/science.235.4793.1196. [DOI] [PubMed] [Google Scholar]
- 2.Shraiman B I, Siggia E D. Phys Rev Lett. 1989;62:1564–1567. doi: 10.1103/PhysRevLett.62.1564. [DOI] [PubMed] [Google Scholar]
- 3.Wen X G, Lee P A. Phys Rev Lett. 1996;76:503–506. doi: 10.1103/PhysRevLett.76.503. [DOI] [PubMed] [Google Scholar]
- 4.Weng Z Y, Sheng D N, Ting C S. Phys Rev B Condens Matter. 1999;59:8943–8955. [Google Scholar]
- 5.Senthil T, Fisher M P A. Phys Rev B Condens Matter. 2000;62:7850–7881. [Google Scholar]
- 6.Chakravarty S, Laughlin R B, Morr D K, Nayak C. Phys Rev B Condens Matter. 2001;63:094503. [Google Scholar]
- 7.Takagi H, Batlogg B, Kao H L, Kwo J, Cava R J, Krajewski J J, Peck W F., Jr Phys Rev Lett. 1992;69:2975–2978. doi: 10.1103/PhysRevLett.69.2975. [DOI] [PubMed] [Google Scholar]
- 8.Hwang H Y, Batlogg B, Takagi H, Kao H L, Kwo J, Cava R J, Krajewski J J, Peck W F., Jr Phys Rev Lett. 1994;72:2636–2639. doi: 10.1103/PhysRevLett.72.2636. [DOI] [PubMed] [Google Scholar]
- 9.Tranquada J M, Cox D E, Kunnmann W, Moudden H, Shirane G, Suenaga M, Zolliker P, Vaknin D, Sinha S K, Alvarez M S, et al. Phys Rev Lett. 1988;60:156–159. doi: 10.1103/PhysRevLett.60.156. [DOI] [PubMed] [Google Scholar]
- 10.Rossat-Mignod J, Regnault L P, Vettier C, Burlet P, Henry J Y, Lapertot G. Physica B (Amsterdam) 1991;169:58–65. [Google Scholar]
- 11.Andersen N H, Von Zimmermann M, Frello T, Kall M, Monster D, Lindgard P A, Madson J, Niemoller T, Poulsen H F, Schmidt O, et al. Physica C (Amsterdam) 1999;318:259–269. [Google Scholar]
- 12.Sidis Y, Ulrich C, Bourges P, Bernhard C, Niedermayer C, Regnault L P, Andersen N H, Keimer B. Phys Rev Lett. 2001;86:4100–4103. doi: 10.1103/PhysRevLett.86.4100. [DOI] [PubMed] [Google Scholar]
- 13.Ando Y, Lavrov A N, Segawa K. Phys Rev Lett. 1999;83:2813–2816. [Google Scholar]
- 14.Ito T, Takenaka K, Uchida S. Phys Rev Lett. 1993;70:3995–3998. doi: 10.1103/PhysRevLett.70.3995. [DOI] [PubMed] [Google Scholar]
- 15.Veal B W, You H, Paulikas A P, Shi H, Fang Y, Downey J W. Phys Rev B. 1990;42:4770–4773. doi: 10.1103/physrevb.42.4770. [DOI] [PubMed] [Google Scholar]
- 16.Ong N P. Phys Rev B. 1991;43:193–201. doi: 10.1103/physrevb.43.193. [DOI] [PubMed] [Google Scholar]
- 17.Dai P, Zhang Y, Sarachik M P. Phys Rev Lett. 1993;70:1968–1971. doi: 10.1103/PhysRevLett.70.1968. [DOI] [PubMed] [Google Scholar]
- 18.Xu Z A, Ong N P, Kakeshita T, Eisaki H, Uchida S. Physica C (Amsterdam) 2000;341:1711–1714. [Google Scholar]
- 19.Ando Y, Lavrov A N, Komiya S, Segawa K, Sun X F. Phys Rev Lett. 2001;87:017001. doi: 10.1103/PhysRevLett.87.017001. [DOI] [PubMed] [Google Scholar]
- 20.Emery V, Fradkin E, Kivelson S A, Lubensky T C. Phys Rev Lett. 2000;85:2160–2163. doi: 10.1103/PhysRevLett.85.2160. [DOI] [PubMed] [Google Scholar]
- 21.Ong N P, Tessema G X, Verma G, Eckert J C, Savage J, Khanna S K. Mol Cryst Liq Cryst. 1982;81:759–765. [Google Scholar]
- 22.Tranquada J M, Sternlieb B J, Axe J D, Nakamura Y, Uchida S. Nature (London) 1995;375:561–563. [Google Scholar]
- 23.Emery V J, Kivelson S A, Tranquada J M. Proc Natl Acad Sci USA. 1999;96:8814–8817. doi: 10.1073/pnas.96.16.8814. [DOI] [PMC free article] [PubMed] [Google Scholar]
- 24.Noda T, Eisaki H, Uchida S. Science. 1999;286:265–268. doi: 10.1126/science.286.5438.265. [DOI] [PubMed] [Google Scholar]
- 25.Timusk T, Statt B. Rep Prog Phys. 1999;62:61–122. [Google Scholar]
- 26.Ronning F, Kim C, Feng D L, Marshall D S, Loeser A G, Miller L L, Eckstein J N, Bozovic I, Shen Z-X. Science. 1998;282:2067–2072. doi: 10.1126/science.282.5396.2067. [DOI] [PubMed] [Google Scholar]
- 27.Takigawa M, Reyes A P, Hammel P C, Thompson J D, Heffner R H, Fisk Z, Ott K C. Phys Rev B Condens Matter. 1991;43:247–257. doi: 10.1103/physrevb.43.247. [DOI] [PubMed] [Google Scholar]
- 28.Cooper J R, Loram J W. J Phys I. 1996;6:2237–2263. [Google Scholar]
- 29.Tallon J L, Loram J W. Physica C (Amsterdam) 2001;349:53–68. [Google Scholar]


