Abstract
Purpose
Uveitis is associated with accumulation of exudate in the vitreous, which reduces fundus visibility. The condition is assessed in patients by subjectively matching fundus photographs to a six-level (NIH) or nine-level (Miami) haze scale. This study aimed to develop an objective method of assessing vitreous haze.
Methods
An image-processing algorithm was designed that quantifies vitreous haze via high-pass filtering, entropy analysis, and power spectrum integration. The algorithm was refined using nine published photographs that represent incremental levels of fundus blur and applied without further refinement to 120 random fundus photographs from a uveitis image library. Computed scores were compared against the grades of two trained readers of vitreous haze and against acutance, a generic measure of image clarity, using Cohen's κ and Gwet's AC statistics.
Results
Exact agreement between algorithm scores and reader grades was substantial for both NIH and Miami scales (κ = 0.61 and 0.67, AC = 0.82 and 0.92). Within-one (κ = 0.78 and 0.82) and within-two (κ = 0.80 and 0.84) levels of agreement were almost perfect. The correspondence was comparable to that between readers. Whereas, exact (κ = 0.45 and 0.44, AC = 0.73 and 0.75), within-one (κ = 0.69 and 0.68), and within-two (κ = 0.73 and 0.72) levels of agreement for the two scales were moderate to substantial for acutance calculations.
Conclusions
The computer algorithm produces a quantitative measure of vitreous haze that correlates strongly with the perception of expert graders.
Translational Relevance
The work offers a rapid, unbiased, standardized means of assessing vitreous haze for clinical and telemedical monitoring of uveitis patients.
Keywords: uveitis, vitreous haze, inflammation, image processing, automated grading
Introduction
Uveitis is an inflammatory condition that can affect different anatomical locations of the eye. Infection, trauma, systemic diseases, autoimmune disorders, and others can cause intermediate, posterior, or panuveitis with characteristic accumulation of inflammatory cells and proteins in the vitreous gel.1 Those accumulations deteriorate the vitreous clarity to various degrees as a function of the disease process.2 On clinical examination, the vitreous appears hazy, which leads to decreased visibility of the vascular markings of the retina and the optic nerve. The haze can quickly increase when the inflammation is not controlled and decrease or completely resolve with treatment of uveitis.3 It is accepted as a surrogate marker for the disease activity and has been validated as a primary outcome measure for pharmacologic clinical trials in uveitis.2–5 Therefore, accurate grading of the vitreous haze has significant importance.
Multiple attempts to characterize the levels of vitreous haze have been historically published as clinical scales with variable steps of stratification. First, in 1959, Kimura and associates6 reported a five-level descriptive scale based on the clarity of fundus details such as the optic nerve head, blood vessels, and nerve fiber layer. Later, in 1985, Nussenblatt and associates7 from the NIH (National Institutes of Health) described a photographic scale for clinical grading that identified six levels of vitreous haze. The NIH scale is widely employed and currently accepted for use in clinical trials by the FDA (US Food and Drug Administration). It is an ordinal scale, meaning that successive levels do not represent numerically equal steps in haziness. In 2010, Davis and associates8 therefore introduced a standardized nine-level photographic grading scale that has quantitative significance. The scale, referred to as the Miami scale, was created using calibrated Bangerter filters to blur fundus photographs obtained from a normal subject by linearly graded amounts. The gradations were chosen to correlate with the logarithm of Snellen visual acuity measurements. Interobserver agreement was better than that of the NIH scale in a reading center environment and equally good in a clinical setting, considering that the Miami scale has finer steps.9–11 Since the Miami scale increases the number of levels and equalizes their amounts of blur, it can offer better discrimination of inflammatory status and greater subject inclusion in clinical studies. Many patients do not qualify for clinical studies because they have a low level of haze that the NIH scale cannot resolve.11
Despite significant improvement in digital imaging and refinement of clinical scales, the grading of vitreous haze remains subjective. It is currently assessed with ophthalmoscopy by uveitis specialists in a clinic or from digital fundus photographs by independent trained graders in a reading center. Capitalizing on the newer generation of computer processors, software enhancements in image-processing algorithms, and improvements in the grading scale, we sought to design and validate an image-processing algorithm that can provide automated objective quantification of vitreous haze from digital fundus photographs.
Methods
Study Design and Datasets
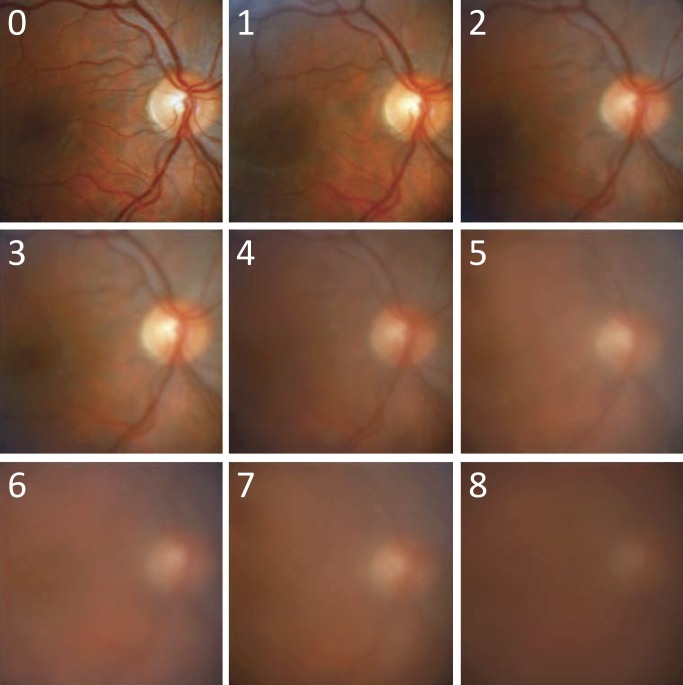
This was an experimental case study to assess a clinical research methodology, which is a computer algorithm for automated grading of vitreous haze. The algorithm was developed and tested at the University of South Florida (USF) Eye Institute in adherence to the tenets of the Declaration of Helsinki. The nine digital color fundus photographs that comprise the Miami scale of vitreous haze were used as a reference for algorithm development8 because of better image quality as compared to the film-based NIH scale. The photographs were stored as noncompressed TIF (tagged image format) files and cropped to an area of 512 × 512 pixels centered on the macula. The image cropping was necessary to remove the black featureless mask that surrounded the fundus in raw photographs. Figure 1 illustrates the reference dataset, which depicts a representative fundus with incremental levels of optical blur. The reference images were labeled according to the clinical grade of vitreous haze that they represent. A test dataset of 120 digital color fundus photographs was used for algorithm validation. The photographs were randomly selected from a clinical trial library of uveitis patient images that have varying degrees of vitreous haze and minimal or absent corneal and lens opacities. Each photograph was stored as an uncompressed TIF file and cropped to a 512 × 512-pixel image centered on the macula.
Figure 1.
Reference set of fundus images used for algorithm development. The images are cropped versions of the original photographs published in the Davis study.8 They are numbered from 0 to 8, corresponding to grades of increasing vitreous haze in that study.
The test dataset of fundus photographs was graded for vitreous haze using the Miami and NIH scales by two trained readers (G1: LM, G2: LC) with 4 years of grading experience in the NIH-funded Uveitis Reading Center of the USF Eye Institute. Details of the grading procedure have been published.9 In short, test images were individually displayed on a calibrated computer monitor in a quiet, dark room in two batches so as to minimize reader fatigue. Readers matched the perceived blurriness of the fundus to one of nine reference images of the Miami scale or one of six reference images of the NIH scale. The reference images were sequentially displayed on the computer monitor next to the test image. Readers were masked from each other's grading, any previous grading, and any patient information regarding the test images. The results were recorded as grades 0 to 8 on the Miami scale and as grades 0, +0.5, +1, +2, +3, and +4 on the NIH scale.
Vitreous Haze–Grading Algorithm
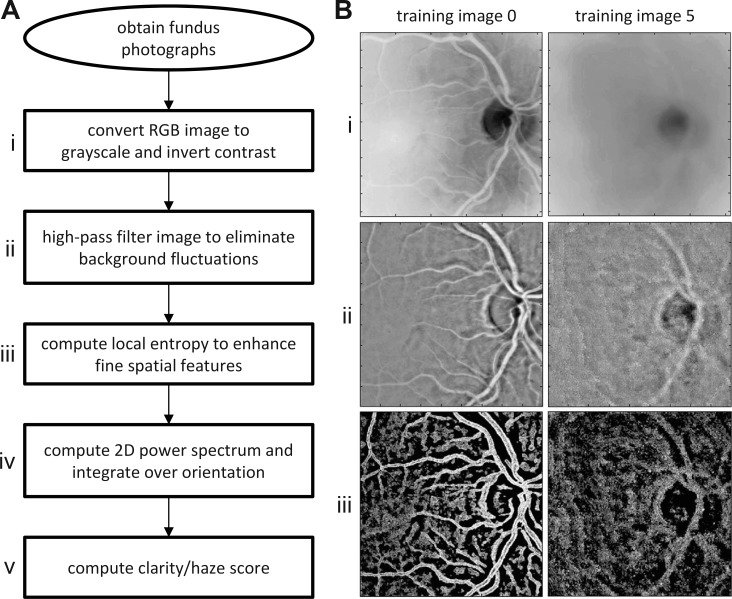
The haziness of fundus images was quantified by applying a series of image-processing techniques coded in a computer program (MATLAB; MathWorks, Natick, MA). The techniques include standard high-pass filtering, local entropy analysis, and power spectrum integration.12 Figure 2 outlines the vitreous haze–grading algorithm and illustrates the output at several steps of analysis for reference images of high (level 0) and low (level 5) clarity. The first step of the algorithm is to convert the color image to grayscale and invert contrast so that dark blood vessels map to numerically large pixel values and thus appear white (step i). Next, the inverted image is processed with a high-pass spatial filter that subtracts from sequential pixels a weighted average of pixel values with a large (32 × 32) surrounding region:
 |
where  is the inverted contrast of pixel
  . The high-pass filter removes diffuse variations in image contrast so that fine features such as the retinal microvasculature appear on a more spatially uniform background (step ii). Next, the local entropy is calculated from the probability distribution of pixel values within a small (3 × 3) window centered on sequential pixels of the filtered image:
 |
where  is the probability distribution of
  with border pixels padded by symmetrical values. The local entropy analysis has the effect of enhancing fine features that are most affected by haze (step iii). Next, the two-dimensional power spectrum of the entropy image is computed by Fourier analysis (step iv):
 |
where x and y are spatial frequencies in the i and j directions, respectively. Finally, a number that we call the “clarity score” is calculated by averaging the power spectrum over 360° of orientation in 10° steps and then summing the result over a fixed band of spatial frequencies (step v):
 |
where  is the power spectral density along orientation θ and KL and KU are the lower and upper limits of the integration band. The band limits were empirically determined to maximize sensitivity to variations in image clarity (see Fig. 5 in Results). The clarity score is inversely related to image blurriness, so it is converted to a “haze score” to facilitate comparisons with reader grades of vitreous haze:
 |
where MH is a constant that maps scores into the numerical range of the Miami scale.
Figure 2.
Automated method of grading vitreous haze. (A) Sequence of image-processing steps (i–v) performed by the algorithm to compute a haze score from a fundus photograph. (B) Results of image processing after steps i–iii of the algorithm for images 0 and 5 of the reference set in Figure 1.
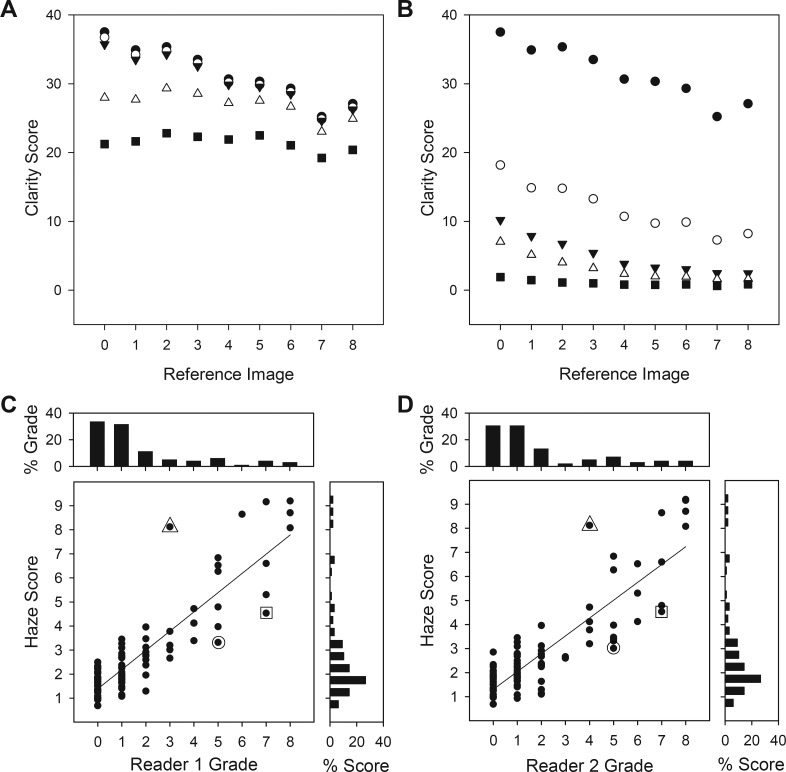
Figure 5.
Performance of vitreous haze–grading algorithm. (A) Optimization of the upper limit of the spectral integration band of the algorithm. Clarity scores are plotted for high-frequency cutoffs of 10 (⋄), 25 (♦), 50 (□), 100 (▴), 150 (▵), and 250 (•) cycles/image. (B) Optimization of the lower limit of the spectral integration band of the algorithm. Clarity scores are plotted for low-frequency cutoffs of 1 (•), 5 (○), 10 (▾), 20 (▵), 50 (▴), 100 (⋄), and 150 (□) cycles/image. (C, D) Comparison of haze scores computed by the algorithm for the 120 patient images with the grades of two expert readers of vitreous haze. Histograms above and aside the graph plot the distribution of grades that the readers and the algorithm, respectively, assigned to the set of images. Symbols indicate outliers (greater than two levels of disagreement).
Acutance Grading of Vitreous Haze
The performance of the haze-grading algorithm was evaluated against a standard photographic measure of image sharpness known as acutance.12 The acutance calculation followed that used previously to quantify the clarity of optic nerve fiber striations in fundus photographs.13 In short, acutance describes the gradient of pixel values within a region of interest (ROI) of an image. It was specified by computing the squared difference between a given pixel and its eight neighbors and averaging over all pixels within the ROI:
 |
where N is the total number of pixels in the ROI. This means acutance is zero for a spatially uniform ROI and a large positive number for a ROI having many edges. Since acutance is a metric of image clarity like the clarity score, it was similarly converted to what we call the “acutance score” in order to compare with reader grades of vitreous haze:
 |
where MA is a constant that maps scores into the numerical range of the Miami scale.
Statistical Analysis
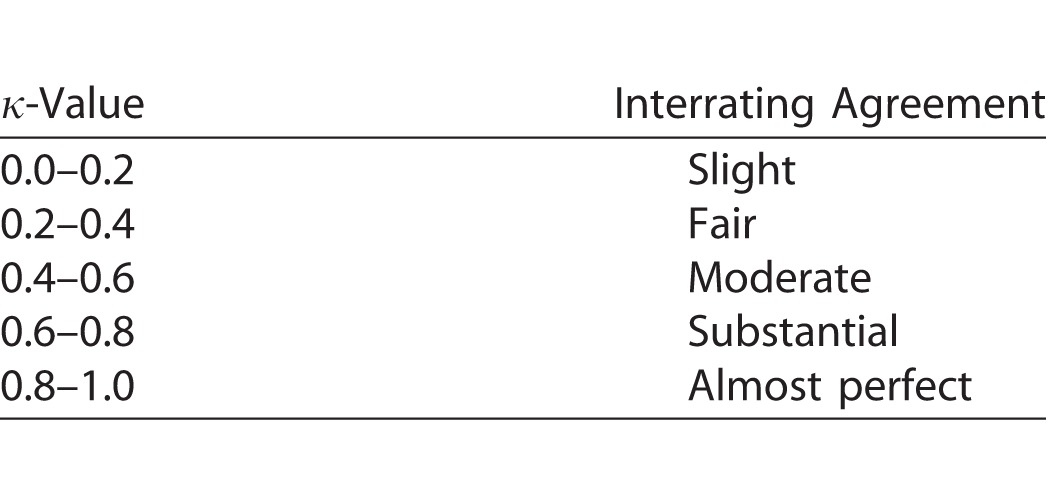
The clinical grading scales use integer numbers, whereas the two image-processing algorithms generate real numbers. To evaluate algorithm performance, haze and acutance scores were therefore rounded to the nearest integer. A score of 1 equated to reader grade 0 on the Miami scale, score 2 to reader grade 1, and so forth. The NIH scale is qualitative and nonlinear, so a score of 1 was assigned to reader grade 0, score 2 to grade +0.5, score 3 to grade +1, score 4 to grade +2, scores 5 and 6 to grade +3, and score 7 or more to grade +4. The agreement between readers and between readers and algorithms was then assessed in MATLAB for the two grading scales using Cohen's κ statistic with linear weighting. A κ-value of 0 to 0.2 indicates slight, 0.2 to 0.4 fair, 0.4 to 0.6 moderate, 0.6 to 0.8 substantial, and 0.8 to 1.0 almost perfect agreement (Table).14 κ-Values were calculated for exact, within-one, and within-two levels of agreement, as described for clinical grading.11 It is important to note that the Table is an interpretation guideline and that κ-values may underestimate the level of agreement when the grade distribution is nonuniform.15 To address chance association due to skewed data, Gwet's AC statistic was also calculated.16 It similarly ranges from 0 to 1.
Table.
Landis and Koch14 Guidelines for κ-Value Interpretation
Results
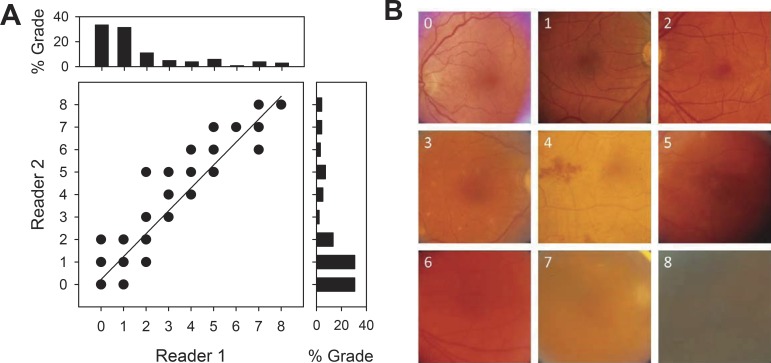
Figure 3A illustrates the correspondence of vitreous haze grades between two expert readers using the Miami scale for the test set of 120 fundus images acquired from uveitis patients. Reader grades show almost perfect agreement (exact: κ = 0.81; within-one: κ = 0.98; within-two: κ = 1.00), as might be expected for a reading center. It may be seen that their grade distributions are skewed toward lower values since most patients do not present severe cases. Exact agreement is even higher (AC = 0.96) when skewness is taken into account. Reader agreement was substantial to almost perfect using the NIH scale (exact: κ = 0.71, AC = 0.86; within-one: κ = 0.79; within-two: κ = 0.82). Figure 3B shows representative test images that both readers matched to each reference image of the Miami scale (Fig. 1). It should be noted that the fundus images differ not only in clarity but also in coloration, vascular distribution, and other nondescript features. The breadth of variation makes accurate and reliable discrimination of subtle differences in image clarity difficult for the untrained visual system. Considerable time, experience, and attention are thus needed to perform the haze-grading task with the high level of agreement demonstrated by the expert readers.
Figure 3.
Performance of expert graders. (A) Comparison of grades of vitreous haze by two trained readers for 120 fundus images taken of random patients with varying levels of vitreous haze. Histograms above and aside the graph plot the distribution of grades that reader 1 and 2, respectively, assigned to the set of images. (B) Representative patient images that matched grades 0 to 8 according to both readers.
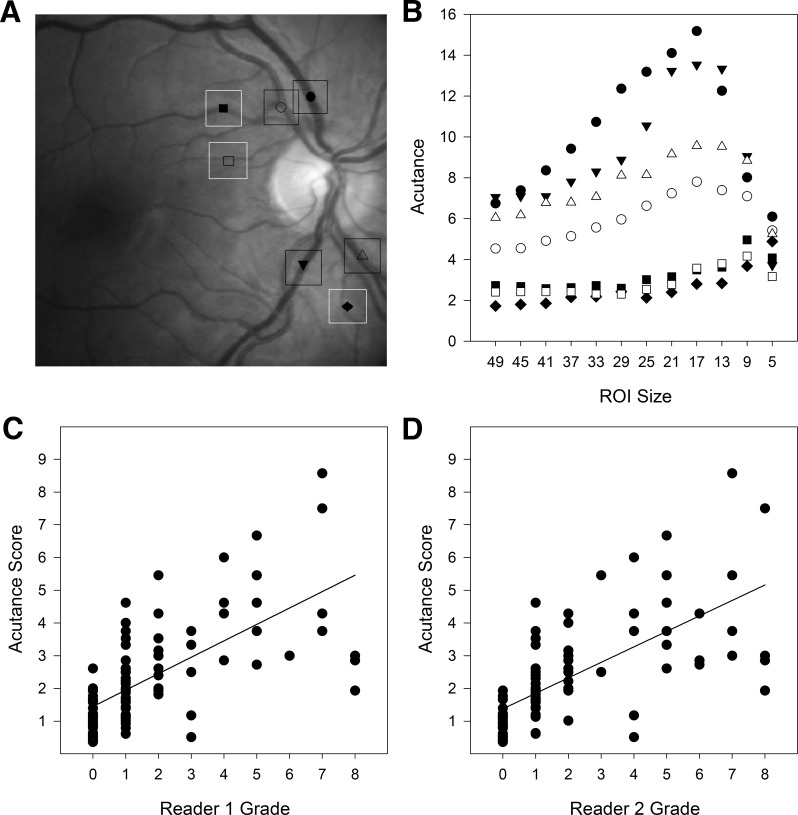
One method of automating the grading process could be to compute acutance, which measures the sharpness of edges within a ROI in the image. The acutance value will depend on the ROI size used for computation, so a range of sizes were explored to determine which gives the best performance. Figure 4A shows representative ROI locations used for the analysis. The seven locations were selected to include blood vessels of different thickness since fine features of high contrast have greatest impact on acutance measures. Figure 4B plots the dependence of acutance values on ROI size for the selected ROI locations. Acutance was minimal for very large and small ROIs and maximal for ROIs between 9 and 17 pixels. The peak tended toward larger values for thick blood vessels and smaller sizes for thin vessels. The analysis produced similar results for five random test images that both readers judged to have high clarity (level 0). A 17 × 17-pixel ROI was therefore considered to optimize performance and applied to all 120 test images. Figure 4C compares acutance scores with reader grades of vitreous haze using the Miami scale. Exact agreement was moderate for both readers (G1 and G2: κ = 0.45 and 0.43, AC = 0.76 and 0.74). Acutance scores were most consistent for clear images (level 0) and fairly dispersed for fundus images that looked slightly or significantly blurry (levels 1–8). Performance was better when scores within-one (κ = 0.67 and 0.68) and within-two (κ = 0.71 and 0.73) levels of agreement of reader grades were counted, reaching an amount that is considered substantial. The agreement with reader grades using the NIH scale was nearly identical (exact: κ = 0.46 and 0.44, AC = 0.77 and 0.69; within-one: κ = 0.67 and 0.71; within-two: κ = and 0.71 and 0.75).
Figure 4.
Performance of acutance method. (A), Illustration of ROI size and seven representative locations used for acutance calculations. The locations are indicated by different symbols and target large and small vessels. (B), Acutance values for the seven locations in A for square ROIs of different pixel sizes. A 17 × 17-pixel ROI gives largest values for all but the smallest vessels. (C, D) Comparison of acutance scores for the 120 patient images with the grades of two expert readers of vitreous haze.
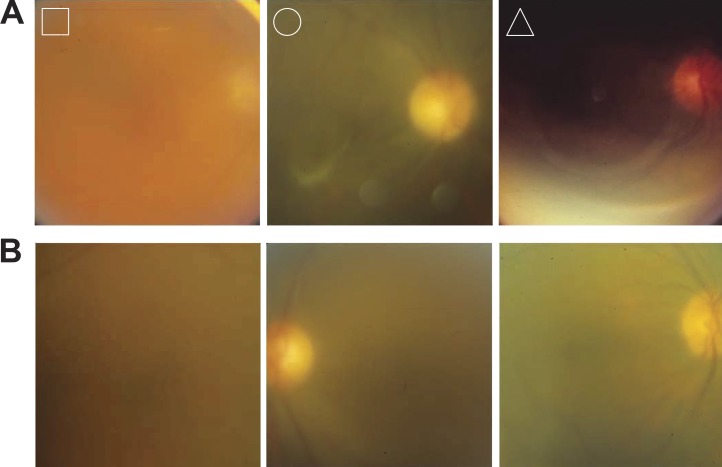
A novel computer algorithm was developed to improve the efficiency, objectivity, and accuracy of the haze-grading process. Like the acutance calculation, the algorithm needed optimization for the grading task as it produces a clarity score that depends on the spatial frequency band over which image power spectra are integrated (see Methods). Figure 5A plots the clarity score computed for the nine reference images of the Miami scale when the upper limit of the frequency band was varied. It can be seen that lowering the high-frequency limit from 256 cycles/image (all frequencies) to 30 to 50 cycles/image had little impact on clarity scores, which increased systematically with image clarity, whereas further decreases in the upper limit reduced scores for all the reference images, with the clearest ones (levels 0–3) most affected. As a result, clarity scores became largely independent of image clarity. Figure 5B plots the clarity score as the lower limit of the frequency band was varied. Scores decreased as the low-frequency limit was raised from one cycle/image (all frequencies) to approximately 10 cycles/image, but all reference images were similarly impacted. Further increases in the lower limit affected the clearest images (levels 0–3) preferentially, and clarity scores again became independent of image clarity. Taken together, the results indicate that vitreous haze is determined by information that mostly resides within the spatial frequency range of 10 to 50 cycles/image. The lower and upper limits of the integration band were therefore frozen at these values, and the algorithm was applied without further modification to the 120 test images. Figure 5C compares computed haze scores with reader grades of vitreous haze using the Miami scale. Exact agreement was substantial (G1 and G2: κ = 0.68 and 0.64, AC = 0.93 and 0.91), and within-one (κ = 0.82 and 0.81) and within-two (κ = 0.84 and 0.83) levels of agreement were almost perfect for both readers. The results are comparable to that between readers (Fig. 3), with the remaining difference in κ-value attributable to three main outliers (greater than two levels of disagreement) that were the same for both readers. Figure 6A shows the outlying fundus images. The algorithm scored the leftmost image as less hazy and the rightmost two as more hazy than the readers did. Figure 6B shows three other fundus images of similar quality based on reader grades that the algorithm scored within-two levels of agreement. From inspection of these and other test images, the outliers can be explained by the algorithm scoring the entire frame and the readers adjusting their grade based on image artifacts or islands of vessel clarity within the photographs. The agreement using the NIH scale for grading was substantial to almost perfect as well for one reader (exact: κ = 0.64, AC = 0.87; within-one: κ = 0.81; within-two: κ = 0.82) and moderate to substantial for the second reader (exact: κ = 0.58, AC = 0.77; within-one: κ = 0.75; within-two: κ = 0.78).
Figure 6.
Examples of fundus images in test set. (A) Outlier images identified in Figure 5C. Reader grades (R1:R2) were 7:7(□), 5:5 (○), and 3:4 (▵), whereas haze scores were 4.5 (□), 3.3 (○), and 8.1 (▵). (B) Images that the readers graded the same as the outliers (7:7, 5:5, and 3:4, from left to right) that the algorithm also scored similarly (7.4, 6.8, and 3.8).
Discussion
The image-processing algorithm introduced here can automatically score vitreous haze at a performance level approaching that of trained graders at a clinical reading center based on a set of 120 digital fundus photographs taken by assorted physicians across the country from random patients with varying grades of uveitis. It is superior to a generic measure of image sharpness (acutance), which may be conceptually simple and straightforward to calculate but correlates less well with reader perceptions. The algorithm produces a haze score that agrees almost perfectly to within-one level of agreement of reader grades, provided that the fundus photograph is homogeneous in quality. This level of performance is significant considering that interobserver agreement in reading centers is inherently high. Among general clinical practitioners, exact agreement is typically fair to moderate (κ-values range from 0.28 to 0.81 for NIH scale and 0.15 to 0.63 for Miami scale) and within-one level of agreement is substantial (κ-values range from 0.66 to 0.96 and 0.38 to 0.87, respectively).10,11
Two broad computational strategies have historically been applied to the evaluation of fundus photographs. One is to quantify the overall image quality along dimensions, such as luminance, contrast, sharpness, and color, using standard analysis techniques such as histogram matching and gradient mapping.17–22 This approach has achieved modest-to-good concordance with human observers to date, consistent with the acutance results. The other strategy is to use techniques that target retinal blood vessels or fundus features distinctly associated with a disease.23–27 This approach has met with better success, but vessel segmentation is a complex problem and current solutions have significant limitations. The retina vasculature must be traced either laboriously by hand or by computer using automated methods that are prone to error when image quality is poor. The algorithm introduced here operates on raw uncompressed digital fundus images using a combination of high-pass filtering, entropy analysis, and power spectrum integration that does not require user specification of ROIs or identification of target features in each image. Moreover, published methods have primarily assessed performance via categorical comparisons, using categories that are few in number (four or fewer) and qualitative in their description of image quality (e.g., good, fair, or bad). On the other hand, the vitreous haze–grading algorithm was evaluated here against readers who graded fundus images on a more extensive and quantitative scale.
Several attempts for objective analysis and quantitation of the vitreous haze have been reported recently using spectral-domain OCT (optical coherence tomography).28–30 The studies related the amount of vitreous haze to changes in signal strength. Novel parameters were identified as well, which may have diagnostic value unique to OCT imaging. However, manual and automated OCT-image assessment schemes showed only moderate correlation with reader grades as compared to the near 90% agreement for the vitreous haze–grading algorithm. Moreover, this algorithm does not require investment in an expensive and bulky OCT machine. It could simply be coded into an application that runs on any mobile device with a digital camera and a suitable optical attachment for fundus viewing, allowing for vitreous haze assessment at the bedside, from telemedical sites, and in remote poorly equipped locations. Given the low cost, high portability, and strong correlation with the gold-standard of clinical grading, our findings warrant an expanded study with a larger database of fundus photographs. More images are needed from patients with severe uveitis to fully assess algorithm performance as over 60% of the 120-image dataset graded at 0 or 1. Such a study could also address current technical limitations of the algorithm, which include manual cropping of raw fundus photographs to the prescribed image size and image artifacts like light reflections that can negatively impact algorithm performance. A graphical user interface would also be needed to facilitate operation in a physician's office or clinical reading center. There are also image acquisition limitations that apply to vitreous haze assessment in general. Like clinical graders, the algorithm can give inaccurate results based on the photographer's skills if the retina is not kept in proper focus. This issue can be mitigated by taking multiple repeated images to control for accidental defocusing or by using fundus cameras with automated focusing. Also, images taken from uveitis patients with small pupils can result in significant additional blur due to optical aberration, so use of nonmydriatic cameras would improve image quality and yield more accurate results.
In summary, the vitreous haze–grading algorithm offers a rapid, objective, and reproducible method of assessing eye inflammation that could save time and effort and remove bias that a physician may develop based on a patient's symptoms. It might even be able to detect more subtle changes in fundus clarity than humans can reliably resolve since haze scores generated by the algorithm vary on a continuum and current clinical grading scales are limited to nine integer numbers. The algorithm can be used for clinical trials for intermediate, posterior, and panuveitis but also used to measure a relative change (before and after treatment) of haze values in patients with significant media opacities. The algorithm could be incorporated into a fundus camera, giving physicians a quick, accurate, and potentially sensitive metric for evaluating the effectiveness of uveitis treatments during patient examinations. Or, it could be implemented on a computer workstation at a reading center, providing an automated means of quantitatively validating the results from large multicenter clinical trials in uveitis.
Acknowledgments
The authors declare intellectual interest in U.S. patent 9384416 B1.
Disclosure: C.L. Passaglia, (P); T. Arvaneh, (P); E. Greenberg, (P); D. Richards, (P); B. Madow, (S)
References
- 1. Forrester JV. . Uveitis: pathogenesis. Lancet 1991; 338: 1498– 1501. [DOI] [PubMed] [Google Scholar]
- 2. Kempen JH, Van Natta ML, Altaweel MM,et al. Factors predicting visual acuity outcome in intermediate, posterior, and panuveitis: the Multicenter Uveitis Steroid Treatment (MUST) Trial. Am J Ophthalmol. 2015; 160: 1133– 1141. [DOI] [PMC free article] [PubMed] [Google Scholar]
- 3. Jabs DA, Nussenblatt RB, Rosenbaum JT; Standardization of Uveitis Nomenclature (SUN) Working Group. . Standardization of uveitis nomenclature for reporting clinical data. Results of the First International Workshop. Am J Ophthalmol. 2005; 140: 509– 516. [DOI] [PMC free article] [PubMed] [Google Scholar]
- 4. Lowder C, Belfort R Jr, Lightman S,et al. Dexamethasone intravitreal implant for noninfectious intermediate or posterior uveitis. Arch Ophthalmol. 2011; 129: 545– 553. [DOI] [PubMed] [Google Scholar]
- 5. Zarranz-Ventura J, Carreño E, Johnston RL,et al. Multicenter study of intravitreal dexamethasone implant in noninfectious uveitis: indications, outcomes, and reinjection frequency. Am J Ophthalmol. 2014; 158: 1136– 1145. [DOI] [PubMed] [Google Scholar]
- 6. Kimura SJ, Thygeson P, Hogan MJ. . Signs and symptoms of uveitis, II: classification of the posterior manifestations of uveitis. Am J Ophthalmol. 1959; . 47: 171– 176. [DOI] [PubMed] [Google Scholar]
- 7. Nussenblatt RB, Palestine AG, Chan CC, Roberge F. . Standardization of vitreal inflammatory activity in intermediate and posterior uveitis. Ophthalmology. 1985; 92: 467– 471. [DOI] [PubMed] [Google Scholar]
- 8. Davis JL, Madow B, Cornett J,et al. Scale for photographic grading of vitreous haze in uveitis. Am J Ophthalmol. 2010; 150: 637– 641. [DOI] [PMC free article] [PubMed] [Google Scholar]
- 9. Madow B, Galor A, Feuer WJ, Altaweel MM, Davis JL. . Validation of a photographic vitreous haze grading technique for clinical trials in uveitis. Am J Ophthalmol. 2011; 152: 170– 176. [DOI] [PMC free article] [PubMed] [Google Scholar]
- 10. Kempen JH, Ganesh SK, Sangwan VS, Rathinam SR. . Interobserver agreement in grading activity and site of inflammation in eyes of patients with uveitis. Am J Ophthalmol. 2008; 146: 813– 818. [DOI] [PubMed] [Google Scholar]
- 11. Hornbeak DM, Payal A, Pistilli M,et al. Interobserver agreement in clinical grading of vitreous haze using alternative grading scales. Ophthalmology. 2014; 121: 1643– 1648. [DOI] [PMC free article] [PubMed] [Google Scholar]
- 12. Russ JC. . The Image Processing Handbook. 6th ed. Boca Raton, FL: CRC Press; 2011. [Google Scholar]
- 13. Choong YF, Rakebrandt F, North RV, Morgan JE. . Acutance, an objective measure of retinal nerve fiber image clarity. Br J Opthalmol. 2003; 87: 322– 326. [DOI] [PMC free article] [PubMed] [Google Scholar]
- 14. Landis JR, Koch GG. . The measurement of observer agreement for categorical data. Biometrics. 1977; 33: 159– 174. [PubMed] [Google Scholar]
- 15. Cicchetti DV, Feinstein AR. . High agreement but low kappa, II: resolving the paradoxes. J Clin Epidemiol. 1990; 43: 551– 558. [DOI] [PubMed] [Google Scholar]
- 16. Gwet KL. . Computing inter-rate reliability and its variance in the presence of high agreement. Br J Math Stat Psychol. 2008; 61: 29– 48 [DOI] [PubMed] [Google Scholar]
- 17. Lee SC, Wang Y. . Automatic retinal image quality assessment and enhancement. Proc SPIE Int Soc Opt Eng. 1999; 3661: 1581– 1590. [Google Scholar]
- 18. Lalonde M, Gagnon L, Boucher MC. . Automatic visual quality assessment in optical fundus images. Proc Vision Interface. 2001; 259– 264.
- 19. Bartling H, Wanger P, Martin L. . Automated quality evaluation of digital fundus photographs. Acta Ophthalmol. 2009; 87: 643– 647. [DOI] [PubMed] [Google Scholar]
- 20. Paulus J, Meier J, Bock R, Hornegger J, Michelson G. . Automated quality assessment of retinal fundus photos. Int J Comput Assist Radiol Surg. 2010; 5: 557– 564. [DOI] [PubMed] [Google Scholar]
- 21. Dias JMP, Oliveira CM, da Silva Cruz LA. . Evaluation of retinal image gradability by image feature classification. Proc Technol. 2012; 5: 865– 875. [Google Scholar]
- 22. Tsikata E, Lains I, Gil J,et al. Automated brightness and contrast adjustment of color fundus photographs for the grading of age-related macular degeneration. Trans Vis Sci Technol. 2017; 6: 3. [DOI] [PMC free article] [PubMed] [Google Scholar]
- 23. Fleming AD, Philip S, Goatman KA, Olson JA, Sharp PF. . Automated assessment of diabetic retinal image quality based on clarity and field definition. Invest Ophthalmol Vis Sci. 2006; 47: 1120– 1125. [DOI] [PubMed] [Google Scholar]
- 24. Hunter A, Lowell JA, Habib M, Ryder B, Basu A, Steel D. . An automated retinal image quality grading algorithm. Conf Proc IEEE Eng Med Biol Soc. 2011; 2011: 5955– 5958. [DOI] [PubMed] [Google Scholar]
- 25. Cheng X, Wong DW, Liu J,et al. Automatic localization of retinal landmarks. Conf Proc IEEE Eng Med Biol Soc. 2012; 2012: 4954– 4957. [DOI] [PubMed] [Google Scholar]
- 26. Sevik U, Kose C, Berber T, Erdol H. . Identification of suitable fundus images using automated quality assessment methods. J Biomed Opt. 2014; 19: 046006. [DOI] [PubMed] [Google Scholar]
- 27. Imani E, Pourreza HR, Banaee T. . Fully automated diabetic retinopathy screening using morphological component analysis. Comput Med Imaging Graph. 2015; 43: 78– 88. [DOI] [PubMed] [Google Scholar]
- 28. Keane PA, Karampelas M, Sim DA,et al. Objective measurement of vitreous inflammation using optical coherence tomography. Ophthalmology. 2014; 121: 1706– 1714. [DOI] [PMC free article] [PubMed] [Google Scholar]
- 29. Keane PA, Balaskas K, Sim DA,et al. Automated analysis of vitreous inflammation using spectral-domain optical coherence tomography. Trans Vis Sci Technol. 2015; 4: 4. [DOI] [PMC free article] [PubMed] [Google Scholar]
- 30. Zarranz-Ventura J, Keane PA, Sim DA,et al. Evaluation of objective vitritis grading method using optical coherence tomography: influence of phakic status and previous vitrectomy. Am J Ophthalmol. 2016; 161: 172– 180. [DOI] [PubMed] [Google Scholar]


