Abstract
Satellite instruments show a cooling of global stratospheric temperatures over the whole data record (1979–2014). This cooling is not linear, and includes two descending steps in the early 1980s and mid-1990s. The 1979–1995 period is characterized by increasing concentrations of ozone depleting substances (ODS) and by the two major volcanic eruptions of El Chichón (1982) and Mount Pinatubo (1991). The 1995-present period is characterized by decreasing ODS concentrations and by the absence of major volcanic eruptions. Greenhouse gas (GHG) concentrations increase over the whole time period. In order to isolate the roles of different forcing agents in the global stratospheric temperature changes, we performed a set of AMIP-style simulations using the NASA Goddard Earth Observing System Chemistry-Climate Model (GEOSCCM). We find that in our model simulations the cooling of the stratosphere from 1979 to present is mostly driven by changes in GHG concentrations in the middle and upper stratosphere and by GHG and ODS changes in the lower stratosphere. While the cooling trend caused by increasing GHGs is roughly constant over the satellite era, changing ODS concentrations cause a significant stratospheric cooling only up to the mid-1990s, when they start to decrease because of the implementation of the Montreal Protocol. Sporadic volcanic events and the solar cycle have a distinct signature in the time series of stratospheric temperature anomalies but do not play a statistically significant role in the long-term trends from 1979 to 2014. Several factors combine to produce the step-like behavior in the stratospheric temperatures: in the lower stratosphere, the flattening starting in the mid 1990’s is due to the decrease in ozone depleting substances; Mount Pinatubo and the solar cycle cause the abrupt steps through the aerosol-associated warming and the volcanically induced ozone depletion. In the middle and upper stratosphere, changes in solar irradiance are largely responsible for the step-like behavior of global temperatures anomalies, together with volcanically induced ozone depletion and water vapor increases in the post-Pinatubo years.
1.Introduction
Since the beginning of the 1980s, global stratospheric temperatures have decreased at all altitudes (e.g. Seidel et al., 2011). This cooling includes two abrupt steps coincident with the major volcanic eruptions of El Chichón and Mount Pinatubo in 1982 and 1991, respectively (Pawson et al., 1998). There has not been any significant cooling of the global lower stratosphere since 1995, while in the middle and upper stratosphere the cooling has resumed after a pause that lasted from the mid-1990s to the mid-2000s (McLandress et al., 2015).
Prior studies have shown that increases in concentrations of anthropogenic greenhouse gases (GHGs) and ozone-depleting substances (ODSs) have driven a sustained cooling of the stratosphere since 1980 (e.g. Ramaswamy and Schwarzkopf, 2002; Santer et al., 2003; Shepherd and Jonsson, 2008; Thompson and Solomon, 2009; Stolarski et al., 2010). The natural forcing by the solar cycle and occasional volcanic eruptions also impacted the temporal behavior of global stratospheric temperatures. The solar cycle affected stratospheric temperatures directly, via changes in incoming radiation, and indirectly, by modulating ozone formation and destruction (Gray et al., 2009; Swartz et al., 2012); volcanic sulfate aerosols warmed the stratosphere by absorbing long-wave and near-infrared radiation (Angell, 1997). In a high-chlorine atmosphere, volcanic aerosols also enhanced stratospheric ozone depletion (Tie and Brasseur, 1995), thereby cooling the stratosphere. Ozone depletion following the Mt. Pinatubo eruption caused a negative temperature anomaly in the lower stratosphere that persisted after the warming effect of the aerosol dissipated (Thompson and Solomon, 2009).
Here, we analyze the changes in stratospheric temperatures from 1979 to 2014 using satellite observations and model simulations. We examine the temperature retrievals from the Tiros Operational Vertical Sounder (TOVS) Microwave Sounding Unit (MSU) dataset in the lower stratosphere (Mears and Wentz, 2009) and the Advanced Microwave Sounding Unit (AMSU) and Stratospheric Sounding Unit (SSU) merged dataset in the middle and upper stratosphere (McLandress et al., 2015), together with simulations using a version of the NASA Goddard Earth Observing System Chemistry-Climate Model (GEOSCCM, Oman and Douglass, 2014) that includes a prognostic scheme for aerosol and a comprehensive stratospheric chemistry module. A systematic suite of simulations is performed to isolate the individual and combined impacts of GHGs, ODS, changes in solar radiation, and volcanic aerosols on the complex temporal changes in global-mean stratospheric temperatures.
Previous modeling studies have investigated the impacts of different forcings on stratospheric temperatures (e.g. Ramaswamy and Schwarzkopf, 2002; Jones et al., 2003; Ramaswamy et al., 2006; Shepherd and Jonsson, 2008; Stolarski et al., 2010; Gillett et al., 2011; Santer et al., 2013), but they mostly focused on the lower stratosphere or analyzed the role of only some of the forcing agents, for instance ODS versus GHGs, or anthropogenic versus natural forcings. This is the first study to provide a systematic and comprehensive analysis of the role of each of GHGs, ODSs, solar irradiance, and volcanic aerosol on the global temperatures in the lower, middle, and upper stratosphere.
Furthermore, this study is the first stratospheric temperature analysis to include two whole decades of observations (1995–2014) free of major volcanic eruptions. This volcanically quiescent period facilitates the estimation of the 11-year solar component of stratospheric temperature change. These last two decades are also long enough to allow for the calculation of temperature trends in an atmosphere characterized by decreasing ODS concentrations.
A description of the observational data record, the climate model and the simulation setup is included in Section 2. Section 3 contains the results of this study: Sections 3.1 and 3.2 explain the role played by the different forcing agents on the changes of the time-series of global stratospheric temperature, while Section 3.3 focuses on global stratospheric temperature trends.
2. Observations and model simulations
2.1 Description of the data records
The NOAA Microwave Sounding Units (MSU) and Advanced Microwave Sounding Units (AMSU) have provided measurements of stratospheric temperatures starting from December 1978. The observed lower stratospheric anomalies are here calculated from the Remote Sensing System (RSS) data record (Mears and Wentz, 2009), which covers the 15–20 km altitude range and merges measurements from MSU channel 4 from late 1978 to the early 2000s and from AMSU channel 9 after 1998.
In the middle and upper stratosphere, we use temperature anomalies computed from the McLandress et al. (2015) dataset, which merges the SSU and AMSU temperature records. SSUs operated onboard NOAA satellites from 1979 to 2006 and provided estimates of near-global (75°S–75°N) temperature changes. McLandress et al. (2015) created a continuous stratospheric temperature dataset from 1979 to 2012 for the middle and upper stratosphere. They transformed AMSU temperature data using the SSU 1, 2, and 3 weighting functions, which span the altitude ranges from 25km to 35 km, 35 km to 45 km, and 40 km to 50 km, respectively (Randel et al., 2009). Between 1979 and 2006, McLandress et al. (2015) used the bias-corrected and cross-calibrated time series of SSU radiances by Zou et al. (2014). The Zou et al. (2014) dataset is an update from the previous NOAA STAR SSU stratospheric temperature record (Wang et al. 2012), which showed large discrepancies relative to the UK Met Office SSU temperature record independently produced by Nash and Forrester (1986) (Thompson et al., 2012). The UK Met Office temperature record has also been recently reprocessed by Nash and Saunders (2015) and is now in good agreement with the Zou et al. (2014) temperature dataset.
All temperature anomalies shown here are calculated using the near-global time series of observed lower stratospheric temperatures with respect to the January 1995–December 2011 period. This reference period is chosen because it is the longest period in the combined MSU/AMSU/SSU data record free of major volcanic perturbations.
2.2 Description of the climate model and experiment setup
GEOSCCM is an aerosol and chemistry focused version of the GEOS-5 Earth system model, including radiatively and chemically coupled tropospheric and stratospheric aerosol and atmospheric chemistry. GEOSCCM couples the GEOS-5 atmospheric general circulation model (Rienecker et al., 2008; Molod et al., 2012) to the comprehensive stratospheric chemistry module StratChem (Pawson et al., 2008), and the Goddard Chemistry, Aerosol, Radiation, and Transport Model (GOCART, Chin et al., 2000; Colarco et al., 2010). GOCART is a bulk aerosol model with components for dust, sea salt, black carbon, organic carbon, and sulfate aerosol. Versions of GEOSCCM that include StratChem have been evaluated in the two phases of the Chemistry-Climate Model Validation (CCMVal; Eyring et al., 2006; SPARC, 2010) and reliably simulate the stratospheric circulation and transport of trace gas species and many key features of observed stratospheric chemistry, such as polar ozone depletion (Strahan et al, 2011; Douglass et al. 2012).
The version of GEOSCCM used in this work (Oman and Douglass, 2014) includes several advances, among which are a parameterization of gravity waves that can force a quasi-biennial oscillation with realistic features and a new air/sea roughness parameterization that leads to a more realistic climate (Molod et al., 2012). From a chemical perspective, an additional 5 ppt of CH3Br has been added to the surface mixing ratios prescribed in the halogen scenario used for CCMVal, to represent very short-lived brominated substances (Liang et al., 2010). For this study, we also included the effects of the solar cycle in total and spectral irradiance on atmospheric heating and photolysis, as implemented by Swartz et al. (2012). Volcanic eruptions are simulated as a direct injection of sulfur dioxide (SO2). The subsequent transformation of the sulfur dioxide into sulfate aerosol, its atmospheric transport, and its perturbation of atmospheric chemistry and radiation are interactively calculated within the model. The transport of the aerosols from the Mt. Pinatubo eruption and their effects on ozone have been studied in GEOSCCM by Aquila et al. (2012; 2013).
The simulations performed in this study span the period from January 1960 to December 2014. Here we focus on the satellite era and show results from 1979 to 2014. Each experiment is composed of three ensemble members initialized with different initial conditions from a 1960 time-slice simulation. All simulations use prescribed sea surface temperatures (SSTs) and sea ice concentrations from the MetOffice Hadley Centre observational dataset (Rayner et al, 2006), and emissions of tropospheric aerosol and aerosol precursors following Granier et al. (2011). External forcings are added sequentially (see Table 1). The following experiments are performed:
SST, which uses time-varying observed SSTs for the whole simulated period and prescribed concentrations of GHGs and ODS fixed at 1960-levels. Volcanic eruptions are not explicitly included in this experiment, and the solar forcing is held constant;
+GHG, which includes observed SSTs and increasing GHG concentrations (Fig. 1a). GHG concentrations are from observations up to 2005 and from the Representative Concentrations Pathway 4.5 after 2005 (Meinhausen et al., 2011);
+ODS, which includes observed SSTs, increasing GHGs, and changing ODS concentrations following WMO (2010) (Fig. 1b);
+Volc, which includes observed SSTs, increasing GHGs, changing ODS, and the SO2 injected by volcanic eruptions, specified after Diehl et al. (2012) up to December 2010 and Carn et al. (2015) from January 2011 to December 2014 (Fig. 1c). These databases include the magnitude and altitude of the volcanic SO2 injections for each volcanic event;
+Sun, which includes observed SSTs, increasing GHGs, changing ODS, volcanic eruptions and changes in solar flux as in Lean (2000) and subsequent updates by Coddington et al. (2015) (Fig. 1d).
Table 1.
Forcings applied in the simulation experiments performed for this study.
| Forcing | Reference | Experiment name | ||||
|---|---|---|---|---|---|---|
| SST | +GHG | +ODS | +Volc | +Sun | ||
| SST | Rayner et al. (2006) | X | ||||
| GHGs | Meinhausen et al. (2007) | X | X | |||
| ODS | WMO (2010) | X | X | X | ||
| Volcanic eruptions | Diehl et al. (2012), Carn et al. (2014) | X | X | X | X | |
| Solar cycle | Lean (2000) | X | X | X | X | X |
Figure 1.
Forcing applied in the simulations. (a) Atmospheric concentrations of CO2; (b) equivalent effective stratospheric chlorine (EESC) [Newman et al., 2007]; (c) ensemble mean of the aerosol optical thickness from explosive volcanic eruptions, resulting from prescribed injections of volcanic SO2; (d) total solar irradiance.
We prescribe ODS concentrations and let GEOSCCM calculate the ozone chemistry, rather than prescribing ozone concentrations. A disadvantage of using prognostic stratospheric ozone is that biases in stratospheric temperatures would affect reaction rates, which would, in turn, affects stratospheric temperatures. On the other hand, prescribing ODS concentrations also allows for a better separation of the natural and anthropogenic changes in ozone concentrations, since volcanic aerosols lead to ozone depletion in a high-chlorine atmosphere (Tie and Brasseur, 1995). Additionally, ODSs also act as greenhouse gases and lead to additional cooling in the stratosphere
The use of prescribed observed SSTs, rather then internally calculated by the model, aliases the effects of all forcings in the simulations, because observed SSTs include the imprint of perturbations such as volcanic eruptions (Santer et al., 2015). However, this approach produces a climate state closer to the observed one and restricts attention to intrinsic atmospheric variability, reducing the amplitude of variability between individual realizations.
3. Results
3.1 Temperature changes in the lower stratosphere
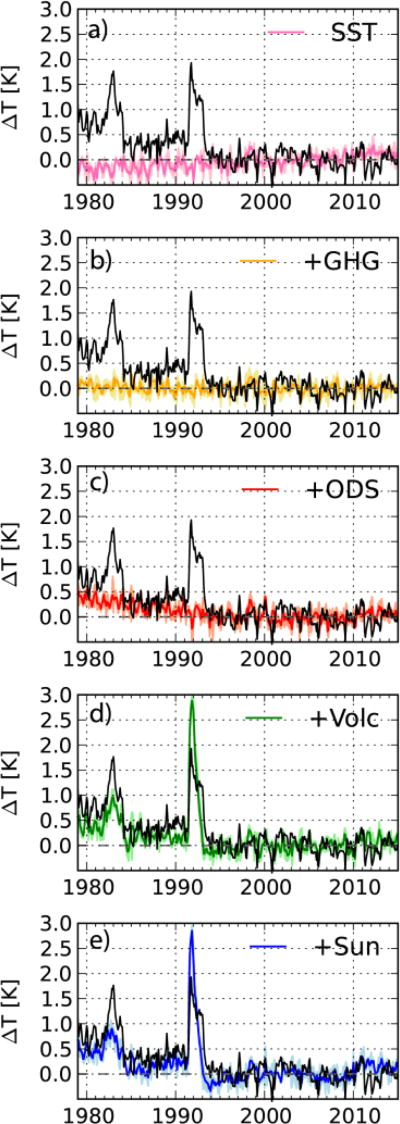
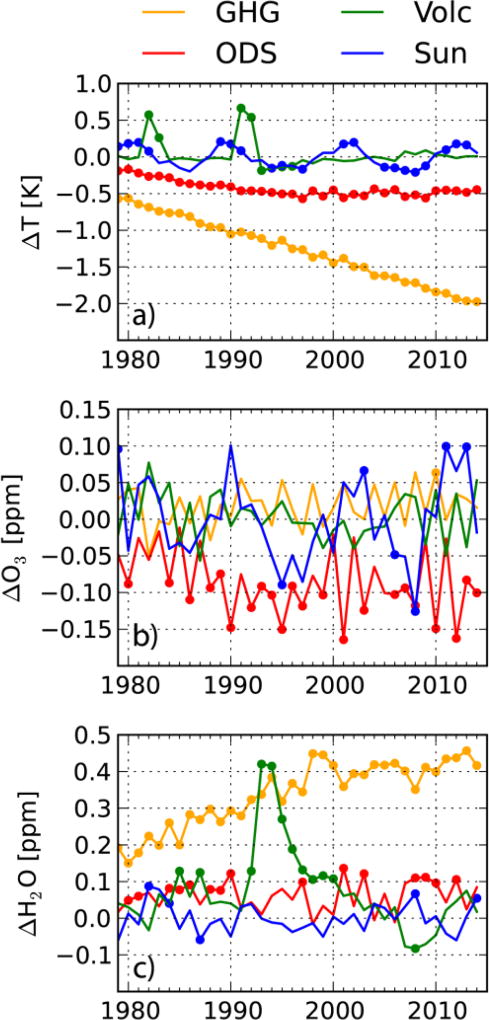
Lower stratospheric temperature changes in MSU/AMSU observations and simulations are shown in Fig. 2. The simulated atmospheric temperatures are weighted using the appropriate MSU lower stratospheric weighting function (Randel et al., 2009). Fig. 3 displays similar information, along with ozone and water concentrations at 70 hPa, but expressed as the ensemble mean differences between successive pairs of simulations, e.g., +GHG and SST, +ODS and +GHG, etc. This allows the isolation of the individual forced components of stratospheric temperature change.
Figure 2.
Stratospheric temperature anomalies with respect to the 1995–2011 climatological monthly means as calculated from MSU observations (black lines) and model simulations. Model results are weighted with the MSU channel 4 weighting function, which covers the 15 km to 25 km altitude range. Anomalies are calculated over 75°S–75°N. The solid colored lines show the model ensemble means, and the shaded areas the ensemble spread.
Figure 3.
The (a) 75°S–75°N annual mean temperature changes in the MSU channel 4 altitude range (15 km to 25 km) and 60°S–60°N (b) ozone and (c) water vapor annual mean anomalies at 70 hPa due to each forcing agent, calculated as the ensemble mean differences between (yellow) +GHG and SST, (red) +ODS and +GHG, (green) +Volc and +ODS, and (blue) +Sun and +Volc. Lines indicate the ensemble means, and the dots mark years where the simulated ensemble spread does not overlap with zero (all ensemble members show a response of the same sign).
In the lower stratosphere the SST experiment produces an ensemble-mean warming of about 0.4K over the period from 1979 to 2014 (Figure 2a). This warming is largely due to increasing GHGs aliased into the SSTs (Karoly and Wu, 2005; Santer et al., 2006). Figure 2b shows that the net effect of increasing GHGs on the global lower stratospheric temperatures is negligible over this specific time period. This net effect is composed of a direct cooling due to radiative effects on the atmosphere (Figure 3a, yellow line) and a warming due to effects mediated by sea surface temperatures (Folland et al., 1998). The increase in GHGs also produces an increase in water vapor at 70 hPa (Figure 3c, yellow line) due to the warming of the temperature of the tropopause and the increase in stratospheric methane.
Figure 2c shows that most of the observed, slow secular change in lower stratospheric temperature anomalies, which is characterized by steady cooling from 1979 to 1995 and flattening after 1995, is captured by adding the forcing associated with changing ODS concentrations. In the model, the temperature flattening after 1995 is primarily due to the slow-down in ozone depletion with decreasing ODS. The difference in global temperatures in +ODS with respect to +GHG (Fig. 3a, red line) follows the difference in ozone (Fig. 3b, red line). At this altitude, therefore, the concentrations of ODS are the primary determinant of the overall shape of the simulated temperature time series.
The strong lower stratospheric warming observed after the volcanic eruptions of El Chichón (1982) and Mt. Pinatubo (1991) is evident in Figure 2d. GEOSSCM overestimates the post-Pinatubo warming with respect to the observations by about 1.5K. This overestimated volcanic warming is a common problem in climate models (e.g., Fig. 1 in Thompson et al., 2012). In the case of GEOSCCM, this is probably due to the use of a fixed aerosol radius of 0.6 µm for aerosol from explosive volcanic eruptions. This value is within the range of observed estimates of the mean particle radius for the aerosol from Mt. Pinatubo, but Bingen et al. (2004) showed that the aerosol size changed with time, latitude, and altitude. The inclusion of a time-evolving aerosol size constrains the response to volcanic eruptions by increasing the settling velocities and modifying the aerosol optical properties (Timmreck et al., 2010; English et al., 2013).
The lower stratospheric volcanic warming after Mt. Pinatubo lasts about two years, and is followed by a two-year long cooling up to −0.14 K in the ensemble mean with respect to the simulations without volcanic forcing (Figure 3a, green line). This cooling is associated with a depletion of global ozone by about 5% in 1992 (Figure 3b, green line) and an increase in water vapor due to the warming of the tropopause by the volcanic aerosol (Figure 3c, green line). Figure 3a shows that in the model simulations there is no volcanically induced change in global lower stratospheric temperatures between 1986 and 1990.
The simulation experiment +Sun, which includes all forcings, reproduces the observed low-frequency changes in global temperature anomalies remarkably well, and even captures the observed warming between the El Chichón and Mt. Pinatubo eruptions (Figure 2e). Figure 3a (blue line) shows that in the model simulations the solar cycle enhances the cooling of the ensemble mean global temperatures from 1985 to 1986 and the warming from 1989 to 1991, capturing the observed rise in temperatures between the volcanic eruptions. In our simulation the solar cycle creates a small oscillation of the temperature anomalies in phase with its periodicity (Fig. 3a, blue line). This is true in the ensemble mean time series, but the ensemble spread overlaps with zero for the whole simulated time period.
3.2. Temperature changes in the middle and upper stratosphere
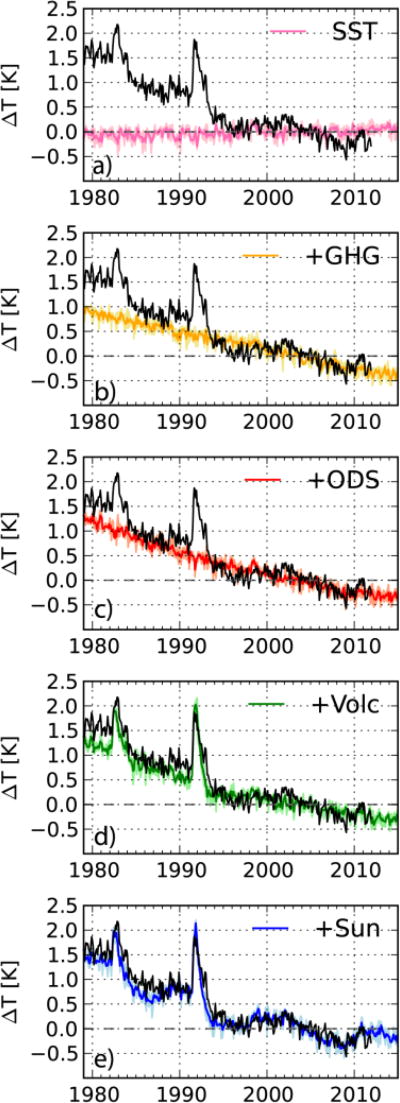
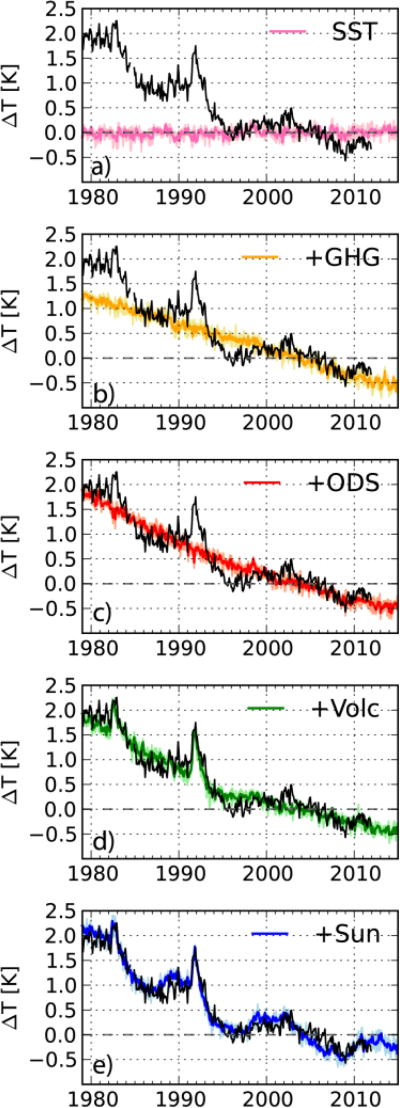
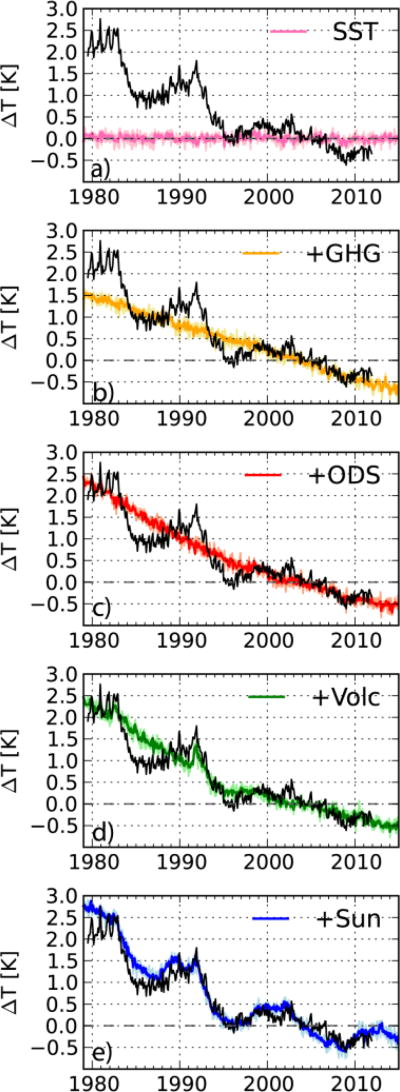
The GEOSCCM +Sun simulations reliably reproduce many features of the observed global temperature anomalies in the middle (Figure 4e) and upper (Figure 6e, Figure 8e) stratosphere.
Figure 4.
As in Figure 1 but for SSU1 (25 km–35 km).
Figure 6.
As in Figure 1 but for SSU2 (35 km–45 km).
Figure 8.
As in Figure 1 but for SSU3 (40 km–50 km).
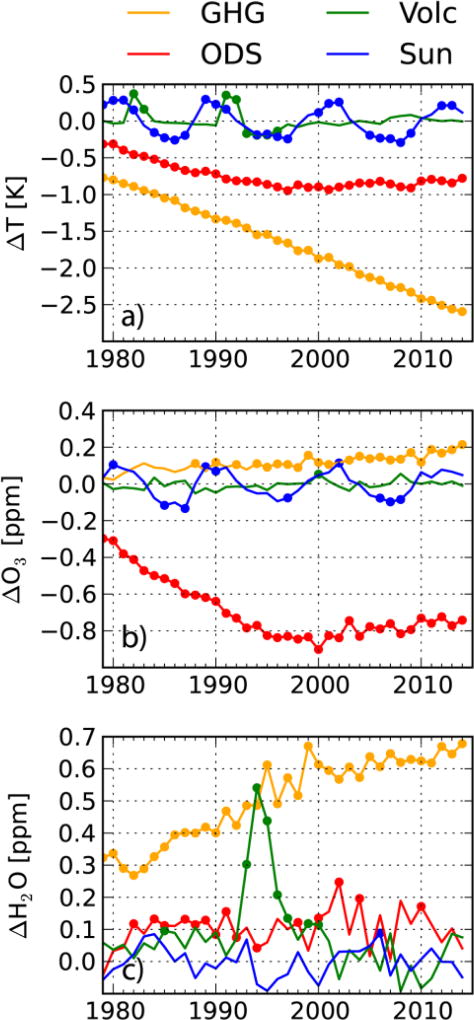
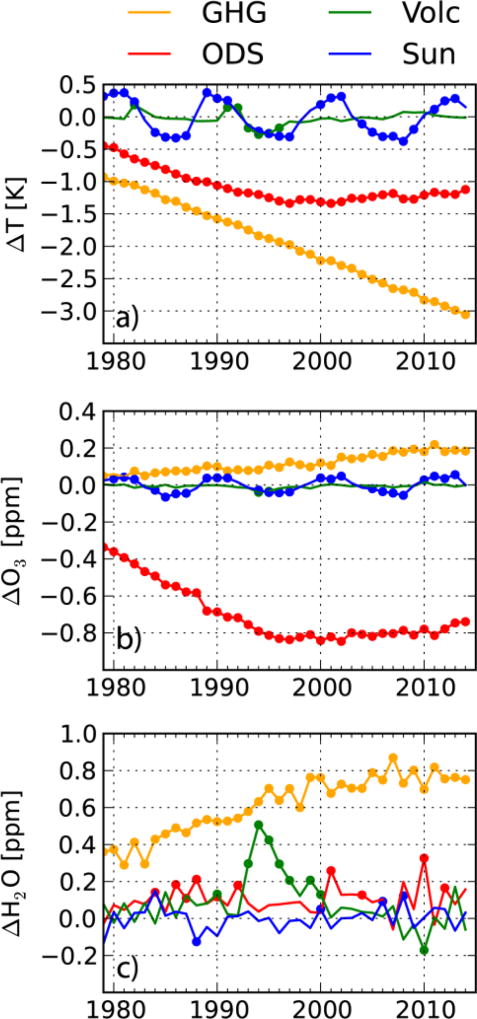
The SST experiment shows a ~0.1K warming in the SSU1 altitude range (Figure 4a) but no warming at higher altitudes (Figure 6a, Figure 8a). +GHG produces a cooling from 1979 to 2014 by 1.2K, 1.7K, and 2.2K in the SSU channels 1, 2, and 3 (Figure 8b), respectively. The increase in GHGs does not produce any trend in global ozone in the middle stratosphere (Figure 5b), but causes an increase in ozone in the upper stratosphere (Figure 7b,Figure 9b) due to the slow-down of ozone loss reactions in a colder environment (e.g. Waugh et al., 2009; Li et al., 2009). As in the MSU lower stratospheric channel, +GHG also shows an increase in stratospheric water vapor (Figs. 5c, 7c, 9c).
Figure 5.
As in Figure 2, but temperature differences are calculated for SSU1 (25 km–35 km), and ozone and water vapor differences at 20 hPa.
Figure 7.
As in Figure 2, but temperature differences are calculated for SSU2 (35 km–45 km), and ozone and water vapor differences at 5 hPa.
Figure 9.
As in Figure 2, but temperature differences are calculated for SSU3 (40 km–50 km), and ozone and water vapor differences at 2 hPa.
The inclusion of estimated observed changes in ODS concentrations (+ODS) strengthens the cooling from 1979 through 2014 in all SSU channels with respect to +GHG and brings the temperature anomalies closer to the observations (Figs. 4c, 6c, 7c). At all levels, the temperature differences between +ODS and +GHG follow the initial decrease and post-1995 flattening of ozone anomalies. This decrease ranges from about 0.1ppm in the middle stratosphere (Figure 5b) to 0.8ppm in the upper stratosphere (Figure 9b). The largest ozone and temperature differences between +ODS and +GHG are reached in the late 1990s and show a small recovery in the latter part of the simulations. The post-1995 flattening of the global temperature anomalies is not as evident here as in the lower stratosphere (Figure 2d), because the influence of ODS on the global temperature with respect to GHGs is smaller in the mid- to upper stratosphere.
The simulated stair-step behavior of the global stratospheric temperature anomalies in the SSU channels is primarily due to GHG-induced cooling and the superimposed modulation by the solar cycle. Between 1993 and 1995 the volcanically induced ozone depletion and water vapor increase cause a cooling of similar magnitude as the one associated to the solar cycle, anticipating the onset of the flattening of temperature anomalies between the mid 1990s and the mid 2000s.
As in the lower stratosphere, the volcanic forcing produces a warming in 1982–1983 and 1991–1993 (Figs. 4d, 6d, 8d). In these altitude ranges, GEOSCCM reproduces the magnitude of the volcanic warming with respect to observations. Again, a cooling with respect to +ODS lasting until the late 1990s follows the volcanic warming associated with the Mt. Pinatubo eruption. This cooling is present in all SSU channels (Figs. 5a, 7a, 9a) and is associated with an increase in stratospheric water vapor (Figs. 5c, 7c, 9c). At these altitudes, there is no significant ozone depletion associated with the eruption of Mt. Pinatubo (Figs. 5b, 7b, 9b).
In all three SSU channels, the forcing associated with the solar cycle contributes not only to the flattening of temperature anomalies between 1985 and 1991, as in MSU channel 4, but also to the post-1995 flattening of the global stratospheric temperatures (Figs. 4e, 6e, 8e). This modulation of the temperature anomaly (Figs. 5a, 7a, 9a) is associated to solar-induced modulation of ozone concentrations (Figs. 5b, 7b, 9b).
3.3 Temperature Trends
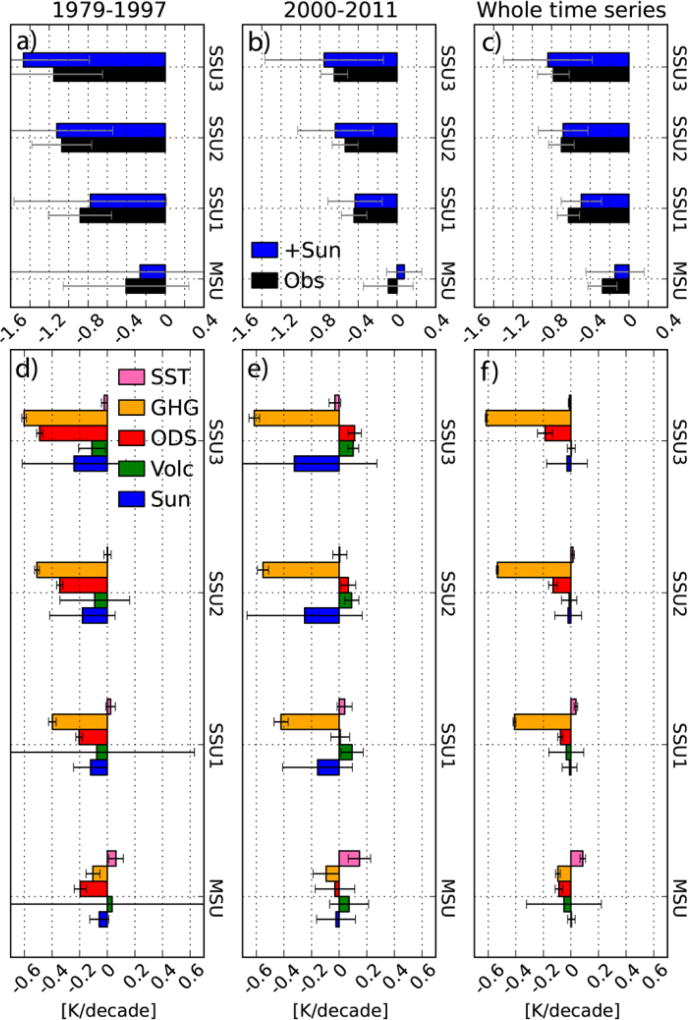
We calculated the global temperature trends for the periods from January 1979 to December 1997 and January 2000 to December 2011 and over the whole available time series, i.e. 1979–2014 for MSU and model simulations, and 1979–2011 for SSU (Fig. 10). The first two periods are chosen to match the periods used in the 2014 WMO Assessment on Ozone Depletion (Pawson et al., 2014). The upper panels of Fig. 10 show the temperature trends in the observations and in the ensemble mean of the experiment with full forcings (+Sun). Trends are calculated from the deseasonalized monthly mean temperatures by minimizing the least-squared deviations. The 95% confidence intervals take into account the autocorrelation of the residuals following Santer et al. (2000). The resulting trends and respective confidence intervals are reported in Table 2. The large lower stratospheric volcanic warming, overestimated in GEOSCCM with respect to the observations, causes the very large confidence intervals over 1979–1997 (Fig. 10a).
Figure 10.
Global temperature trends for the periods from (a, d) January 1979 to December 1997 and (b, e) January 2000 to December 2011 and (c, f) over the whole available time series (1979–2011 for SSU and 1979–2014 for MSU and simulations). Figures 7a–7c show trends from observations (black) and the +Sun ensemble mean (blue). Figures 7d–7f show the contributions of each forcing agents to the temperature trends, calculated from the ensemble mean difference time series between (yellow) +GHG and SST, (red) +ODS and +GHG, (green) +Volc and +ODS, and (blue) +Sun and +Volc. The trend due to SSTs (pink) is calculated over the ensemble mean temperature time series of the SST simulations. Trends are calculated using monthly mean temperature anomalies. Whiskers show the 95% confidence interval.
Table 2.
Global temperature trends in observations and +Sun simulation in K/decade and respective 95% confidence intervals, calculated using monthly mean anomalies. Trends in italics are not statistically significant. These values are plotted in Fig.10.
| MSU (15km–20km) | |||
|
| |||
| 1979–1997 | 2000–2011 | Whole time series | |
|
| |||
| +Sun | −0.26±1.59 | 0.07±0.18 | −0.14±0.30 |
|
| |||
| Observations | −0.41±0.65 | −0.09±0.26 | −0.27±0.15 |
|
| |||
| Single Forcings | |||
|
| |||
| SSTs | 0.06±0.05 | 0.15±0.08 | 0.09±0.02 |
|
| |||
| GHGs | −0.10±0.05 | −0.09±0.09 | −0.09±0.02 |
|
| |||
| ODS | −0.20±0.04 | −0.03±0.14 | −0.09±0.03 |
|
| |||
| Volcanoes | 0.03±1.66 | 0.07±0.14 | −0.05±0.27 |
|
| |||
| Solar cycle | −0.06±0.07 | −0.02±0.14 | −0.00±0.03 |
| SSU1 (25km–35km) | |||
|
| |||
| 1979–1997 | 2000–2011 | Whole time series | |
|
| |||
| +Sun | −0.78±0.79 | −0.43±0.28 | −0.49±0.21 |
|
| |||
| Observations | −0.88±0.33 | −0.45±0.13 | −0.63±0.12 |
|
| |||
| Single Forcings | |||
|
| |||
| SSTs | 0.02±0.03 | 0.04±0.05 | 0.04±0.01 |
|
| |||
| GHGs | −0.40±0.03 | −0.42±0.05 | −0.41±0.01 |
|
| |||
| ODS | −0.20±0.02 | 0.01±0.07 | −0.08±0.02 |
|
| |||
| Volcanoes | −0.08±0.71 | 0.09±0.08 | −0.03±0.13 |
|
| |||
| Solar cycle | −0.12±0.12 | −0.16±0.25 | −0.01±0.05 |
|
| |||
| SSU2 (35km–45km) | |||
| 1979–1997 | 2000–2011 | Whole time series | |
|
| |||
| +Sun | −1.12±0.58 | −0.64±0.39 | −0.68±0.26 |
|
| |||
| Observations | −1.07±0.31 | −0.54±0.13 | −0.70±0.13 |
|
| |||
| Single Forcings | |||
|
| |||
| SSTs | 0.00±0.03 | 0.00±0.05 | 0.01±0.01 |
|
| |||
| GHGs | −0.51±0.02 | −0.55±0.04 | −0.53±0.01 |
|
| |||
| ODS | −0.34±0.02 | 0.07±0.05 | −0.13±0.03 |
|
| |||
| Volcanoes | −0.09±0.25 | 0.09±0.05 | −0.01±0.06 |
|
| |||
| Solar cycle | −0.18±0.24 | −0.25±0.42 | −0.02±0.10 |
|
| |||
| SSU3 (40km–50km) | |||
|
| |||
| 1979–1997 | 2000–2011 | Whole time series | |
| +Sun | −1.47±0.68 | −0.76±0.61 | −0.84±0.46 |
|
| |||
| Observations | −1.15±0.51 | −0.65±0.14 | −0.78±0.16 |
|
| |||
| Single Forcings | |||
|
| |||
| SSTs | −0.02±0.02 | −0.03±0.04 | −0.01±0.01 |
|
| |||
| GHGs | −0.60±0.02 | −0.61±0.04 | −0.61±0.01 |
|
| |||
| ODS | −0.49±0.02 | 0.11±0.05 | −0.19±0.05 |
|
| |||
| Volcanoes | −0.11±0.10 | 0.10±0.04 | 0.00±0.03 |
|
| |||
| Solar cycle | −0.24±0.38 | −0.32±0.60 | −0.03±0.15 |
The lower panels of Fig. 10 show the trends of the ensemble mean-differences between successive pairs of simulations, in order to isolate the contributions of each forcing agent to the total simulated temperature trends. In the middle and upper stratosphere the cooling caused by GHGs is the dominant contribution during all time periods considered. In our simulations the GHG associated cooling goes from about −0.4 K/decade in SSU1 to about 0.6 K/decade in SSU3. From 2005 to present, however, these cooling trends could be underestimated, since the RCP4.5 scenario used in our simulations prescribes GHG emissions lower than observed from 2005 to 2014.
Increasing ODS concentrations produce an additional cooling only over the 1979–1997 time period from −0.2 K/decade in SSU1 to −0.49 K/decade in SSU3. After 2000, decreasing ODS concentrations cause a positive temperature trends in SSU2 and SSU3, and do not contribute in a statistically significant way to the temperature trends in the MSU and SSU1 altitude ranges. Over the whole time series, the GHG and ODS contributions to the lower stratospheric temperature trends are of the same magnitude, while in the middle and upper stratosphere the ODS contribution is between 20% and 31% of the GHG contribution in the SSU1 and SSU3 altitude ranges, respectively.
We expect some nonlinearities to arise when adding the effects of ODS to GHGs. Ozone loss is reduced in a colder environment, so that the GHG-induced cooling limits ozone depletion and the subsequent stratospheric cooling. These nonlinear effects are included in our individual simulations because ozone, temperature, and dynamics are coupled to each other, but the use of differences between simulations to quantify the effects of single forcings relies on the assumption that these effects add linearly. Meul et al. (2015) showed that nonlinearity significantly weakens ODS-related cooling in the tropical upper troposphere and in the lower to middle stratosphere at southern midlatitudes, inducing temperature changes between 1960 and 2000 of up to 0.4K. This corresponds to a 0.1K/decade trend. In these two regions our simulated ODS-induced temperature trend over the 1979–1997 is 0.6K/decade and 0.4K/decade, respectively (not shown). Considering the 0.1K/decade calculated by Meul et al. (2015), our estimate of the ODS related cooling could be locally underestimated by 16% and 25% in the tropical upper stratosphere and lower stratosphere at southern midlatitudes, respectively.
In our simulations volcanic eruptions cause a warming trend over the 2000–2011 period, which is statistically significant only in the SSU channels. This period is characterized by a series of relatively small volcanic eruptions that reached the stratosphere and increased stratospheric aerosol concentrations (Vernier et al., 2011; Neely et al., 2013). The large volcanic perturbations of El Chichón and Mt. Pinatubo produce a statistically significant cooling trend only over 1979–1997 in the upper stratosphere (SSU3). There, the increase in stratospheric water vapor after Mt. Pinatubo produces an additional cooling from 1993 to 1996 (Fig. 9), resulting in a significant cooling trend of −0.11 K/decade. However, the overestimation of the lower stratospheric volcanic warming immediately following the eruptions might have led to an overestimation of the water vapor entering the stratosphere after the eruption of Mt. Pinatubo and therefore to a too large volcanic cooling in the upper stratosphere. Over the whole time series, volcanic eruptions did not contribute to the simulated temperature trends.
4. Conclusions
In our simulations the cooling of the stratosphere from 1979 to present is driven by changes in ODS and GHG concentrations in the lower stratosphere and mostly by changes in GHG concentrations in the middle and upper stratosphere, in agreement with previous studies (e.g. Stolarski et al. 2010; Gillett et al., 2011). Changing ODS concentrations also had an impact on the temperature trends, significantly adding to the GHG-associated cooling up to 1997. After 2000, with the application of the Montreal Protocol, decreasing ODS concentrations produced a warming trend in the upper stratosphere.
In our simulations volcanic eruptions did not have a statistically significant impact on the simulated temperature trends in the lower stratosphere, where the confidence intervals on the simulated trends are large because of the overestimation of the volcanic warming. On the other hand, volcanic eruptions produced a statistically significant warming in the SSU channels over the 2000–2011 period, period characterized by a series of smaller volcanic eruptions that reached the stratosphere (Vernier et al., 2011). Trends calculated over the whole simulated temperature time series show that in our model the solar cycle did not impact the stratospheric temperature trends from 1979 to present.
In our simulations the flattening of the global temperature anomalies between the El Chichón and Mount Pinatubo eruptions is an effect of the solar cycle both in the MSU and in the SSU channels. In the MSU channel, however, the effects of the solar cycle are very noisy, and the ensemble spread overlaps with zero. In the mid 1990s, the eruption of Mt. Pinatubo induced an initial warming followed by a cooling of stratospheric temperatures associated to the enhanced ozone depletion and increased stratospheric water vapor concentrations, causing the abrupt step. The decrease in ODS concentrations and the subsequent decrease in ozone depletion caused the flattening of the lower stratospheric temperature anomalies after 1998, as suggested by Ferraro et al. (1995). In the middle and upper stratosphere, the solar cycle concurred with the volcanic cooling to create the post-1995 temperature flattening until 1998. After 1998 it is the onset of a solar maximum that kept the temperature anomalies from decreasing further. The characteristic stair step pattern in the temperature anomalies is therefore caused by a combination of all the forcings acting on the stratospheric temperatures.
Key points.
ODS cooled the stratosphere only up to the mid 1990s.
GHGs are the driver of the middle and upper stratospheric cooling since 2000
The stair-step pattern in temperature is due to a combination of all forcings
Acknowledgments
The authors would like to thank D. Seidel, L. Oman, and P. Newman for useful discussions, and C. McLandress for providing the AMSU/SSU temperature data. We also thank the three reviewers for their comments. The model simulations were performed at the NASA Center for Climate Simulation. W. H. S. is funded for this work by a grant from NASA’s Living With a Star program. L. M. P. and D. W. W. are funded, in part, by a grant from the U.S. National Science Foundation. The MSU data record is available at http://www.remss.com/measurements/upper-air-temperature. The simulated temperature records are available upon request to the corresponding author.
References
- Angell JK. Stratospheric warming due to Agung, El Chichón, and Pinatubo taking into account the quasi-biennial oscillation. J. Geophys. Res. 1997;102(D8):9479–9485. doi: 10.1029/96JD03588. [DOI] [Google Scholar]
- Aquila V, Oman LD, Stolarski RS, Colarco PR, Newman PA. Dispersion of the volcanic sulfate cloud from a Mount Pinatubo–like eruption. J. Geophys. Res. 2012;117:D06216. doi: 10.1029/2011JD016968. [DOI] [Google Scholar]
- Aquila V, Oman LD, Stolarski R, Douglass AR, Newman PA. The Response of Ozone and Nitrogen Dioxide to the Eruption of Mt. Pinatubo at Southern and Northern Midlatitudes. J. Atmos. Sci. 2013;70(3):894–900. doi: 10.1175/JAS-D-12-0143.1. [DOI] [Google Scholar]
- Bingen C, Fussen D, Vanhellemont F. A global climatology of stratospheric aerosol size distribution parameters derived from SAGE II data over the period 1984–2000: 2. Reference data. J. Geophys. Res. 2004;109(D6):D06202. doi: 10.1029/2003JD003511. [DOI] [Google Scholar]
- Carn SA, Yang K, Prata AJ, Krotkov NA. Extending the long-term record of volcanic SO 2emissions with the Ozone Mapping and Profiler Suite (OMPS) Nadir Mapper. Geophys. Res. Lett. 2015;42 doi: 10.1002/2014GL062437. [DOI] [Google Scholar]
- Chin M, Rood RB, Lin S-J, Müller J-F. Atmospheric sulfur cycle simulated in the global model GOCART: Model description and global properties. J. Geophys. Res. 2000;105(D20):24671–24687. doi: 10.1029/2000JD900384. [DOI] [Google Scholar]
- Coddington O, Lean JL, Pilewskie P, Snow M, Lindholm D. A solar irradiance climate data record. Bull. Amer. Meteorol. Soc. 2015 doi: 10.1175/BAMS-D-14-00265.1. [DOI] [Google Scholar]
- Colarco P, Da Silva A, Chin M, Diehl T. Online simulations of global aerosol distributions in the NASA GEOS-4 model and comparisons to satellite and ground-based aerosol optical depth. J. Geophys. Res. 2010;115(D14):D14207. doi: 10.1029/2009JD012820. [DOI] [Google Scholar]
- Diehl T, Heil A, Chin M, Pan X, Streets D, Schultz M, Kinne S. Anthropogenic, biomass burning, and volcanic emissions of black carbon, organic carbon, and SO2 from 1980 to 2010 for hindcast model experiments. Atmos. Chem. Phys. Discuss. 2012;12(9):24895–24954. doi: 10.5194/acpd-12-24895-2012. [DOI] [Google Scholar]
- Douglass AR, Stolarski RS, Strahan SE, Oman LD. Understanding differences in upper stratospheric ozone response to changes in chlorine and temperature as computed using CCMVal-2 models. J. Geophys. Res. 2012;117:D16306. doi: 10.1029/2012JD017483. [DOI] [Google Scholar]
- English JM, Toon OB, Mills MJ. Microphysical simulations of large volcanic eruptions: Pinatubo and Toba. J. Geophys. Res. 2013;118:1–16. doi: 10.1002/jgrd.50196. [DOI] [Google Scholar]
- Eyring V, Butchart N, Waugh DW, Akiyoshi H, Austin J, Bekki S, et al. Assessment of temperature, trace species, and ozone in chemistry-climate model simulations of the recent past. J. Geophys. Res. 2006;111(D22) doi: 10.1029/2006JD007327. [DOI] [Google Scholar]
- Ferraro AJ, Collins M, Lambert FH. A hiatus in the stratosphere? Nature Climate Change. 2015;5(6):497–498. doi: 10.1038/nclimate2624. [DOI] [Google Scholar]
- Folland CK, Sexton DMH, Karoly DJ, Johnson CE, Rowell DP, Parker DE. Influences of anthropogenic and oceanic forcing on recent climate change. Geophys. Res. Lett. 1998;25(3):353–356. doi: 10.1029/97GL03701. [DOI] [Google Scholar]
- Granier C, Bessagnet B, Bond T, D’Angiola A, Denier van der Gon H, Frost GJ, et al. Evolution of anthropogenic and biomass burning emissions of air pollutants at global and regional scales during the 1980–2010 period. Climatic Change. 2011;109(1–2):163–190. doi: 10.1007/s10584-011-0154-1. [DOI] [Google Scholar]
- Gray LJ, Rumbold ST, Shine KP. Stratospheric Temperature and Radiative Forcing Response to 11-Year Solar Cycle Changes in Irradiance and Ozone. J. Atmos. Sci. 2009;66:2402–2417. doi: 10.1175/2009JAS2866.1. [DOI] [Google Scholar]
- Jones GS, Tett SFB, Stott PA. Causes of atmospheric temperature change 1960–2000: A combined attribution analysis. Geophys. Res. Lett. 2003;30(5):1228. doi: 10.1029/2002GL016377. [DOI] [Google Scholar]
- Karoly DJ, Wu Q. Detection of Regional Surface Temperature Trends. J. Clim. 2005;18(21):4337–4343. doi: 10.1175/JCLI3565.1. [DOI] [Google Scholar]
- Lean J. Evolution of the Sun’s Spectral Irradiance Since the Maunder Minimum. Geophys. Res. Lett. 2000;27:2425–2428. doi: 10.1029/2000GL000043. [DOI] [Google Scholar]
- Li F, Stolarski RS, Newman PA. Stratospheric ozone in the post-CFC era. Atmos. Chem. Phys. 2009;9:2207–2213. doi: 10.5194/acp-9-2207-2009. [DOI] [Google Scholar]
- Liang Q, Stolarski RS, Kawa SR, Nielsen JE, Rodriguez JM, Blake DR, Atlas EL, Ott LE. Finding the missing stratospheric Bry: A global modeling study of CHBr3 and CH2Br2. Atmos. Chem. Phys. 2010;10:2269–2286. doi: 10.5194/acp-10-2269-2010. [DOI] [Google Scholar]
- McLandress C, Shepherd TG, Jonsson AI, von Clarmann T, Funke B. A method for merging nadir-sounding climate records, with an application to the global-mean stratospheric temperature data sets from SSU and AMSU. Atmos. Chem. Phys. 2015;15(16):9271–9284. doi: 10.5194/acp-15-9271-2015. [DOI] [Google Scholar]
- Mears CA, Wentz FJ. Construction of the Remote Sensing Systems V3.2 Atmospheric Temperature Records From the MSU and AMSU Microwave Sounders. J. Atmos. Ocean. Tech. 2009;26:1040–1056. doi: 0.1175/2008JTECHA1176.1. [Google Scholar]
- Meinshausen M, Smith SJ, Calvin KV, Daniel JS, Kainuma MLT, Lamarque J-F, Matsumoto K, Montzka SA, Raper SCB, Riahi K, Thomson AM, Velders GJM, van Vuuren D. The RCP Greenhouse Gas Concentrations and their Extension from 1765 to 2300. Climatic Change. 2011;109(1–2):213–241. doi: 10.1007/s10584-011-0156-z. [DOI] [Google Scholar]
- Meul S, Oberländer-Hayn S, Abalichin J, Langematz U. Nonlinear response of modelled stratospheric ozone to changes in greenhouse gases and ozone depleting substances in the recent past. Atmos. Chem. Phys. 2015;15(12):6897–6911. doi: 10.5194/acp-15-6897-2015. [DOI] [Google Scholar]
- Molod A, Takacs L, Suarez M, Bacmeister J, Song I–S, Eichmann A. The GEOS–5 atmospheric general circulation model: Mean climate and development from MERRA to Fortuna, Technical Report Series on Global Modeling and Data Assimilation. 2012;28 [ http://gmao.gsfc.nasa.gov/pubs/docs/Molod484.pdf.] [Google Scholar]
- Nash J, Forrester GF. Long-term monitoring of stratospheric temperature trends using radiance measurements obtained by TIROS-N series of NOAA spacecraft. Adv. Space Res. 1986;6(10):37–44. doi: 10.1016/0273-1177(86)90455-2. [DOI] [Google Scholar]
- Nash J, Saunders R. A review of Stratospheric Sounding Unit radiance observations for climate trends and reanalyses. Q. J. Meteorol. Soc. 2015;141(691):2103–2113. http://doi.org/10.1002/qj.2505. [Google Scholar]
- Neely RR, III, Toon OB, Solomon S, Vernier JP, Alvarez C, English JM, et al. Recent anthropogenic increases in SO 2from Asia have minimal impact on stratospheric aerosol. Geophys. Res. Lett. 2013;40(5):999–1004. doi: 10.1002/grl.50263. [DOI] [Google Scholar]
- Newman PA, Daniel JS, Waugh DW, Nash E. A new formulation of equivalent effective stratospheric chlorine (EESC) Atmos. Chem. Phys. 2007;7:4537–4552. doi: 10.5194/acp-7-4537-2007. [DOI] [Google Scholar]
- Oman LD, Douglass AR. Improvements in Total Column Ozone in GEOSCCM and Comparisons with a New Ozone Depleting Substances Scenario. J. Geophys. Res. 2014;119:5613–5624. doi: 10.1002/2014JD021590. [DOI] [Google Scholar]
- Pawson S, Labitzke K, Leder S. Stepwise changes in stratospheric temperature. Geophys. Res. Lett. 1998;25(12):2157–2160. doi: 10.1029/98GL51534. [DOI] [Google Scholar]
- Pawson S, Stolarski RS, Douglass AR, Newman PA, Nielsen JE, Frith SM, Gupta ML. Goddard Earth Observing System chemistry-climate model simulations of stratospheric ozone-temperature coupling between 1950 and 2005. J. Geophys. Res. 2008;113(D12):D12103. doi: 10.1029/2007JD009511. [DOI] [Google Scholar]
- Pawson S, Steinbrecht W, Charlton-Perez AJ, Fujiwara M, Karpechko AY, Petropavlovskikh I, et al. Scientific Assessment of Ozone Depletion: 2014. Global Ozone Research and Monitoring Project; 2014. Update on Global Ozone: Past, Present, and Future. [Google Scholar]
- Ramaswamy V, Schwarzkopf M. Effects of ozone and well-mixed gases on annual-mean stratospheric temperature trends. Geophys. Res. Lett. 2002;29(22):2064. doi: 10.1029/2002GL015141. [DOI] [Google Scholar]
- Ramaswamy V, Schwarzkopf MD, Randel WJ, Santer BD, Soden BJ, Stenchikov GL. Anthropogenic and Natural Influences in the Evolution of Lower Stratospheric Cooling. Science. 2006;311(5764):1138–1141. doi: 10.1126/science.1122587. [DOI] [PubMed] [Google Scholar]
- Randel WJ, Shine KP, Austin J, Barnett J, Claud C, Gillett N, et al. An update of observed stratospheric temperature trends. J. Geophys. Res. 2009;114:D02107. doi: 10.1029/2008JD010421. [DOI] [Google Scholar]
- Rayner NA, Brohan P, Parker DE, Folland CK, Kennedy JJ, Vanicek M, Ansell T, Tett SFB. Improved analyses of changes and uncertainties in sea surface temperature measured in situ since the mid-nineteenth century: the HadSST2 data set. J. Clim. 2006;19(3):446–469. doi: http://dx.doi.org/10.1175/JCLI3637.1. [Google Scholar]
- Rienecker MM, et al. The GEOS-5 data assimilation system -Documentation of versions 5.0.1, 5.1.0, and 5.2.0. Technical Report Series on Global Modeling and Data Assimilation. 2008;27 [Google Scholar]
- Santer BD, Wigley TML, Boyle JS, Gaffen DJ, Hnilo JJ, Nychka D, et al. Statistical significance of trends and trend differences in layer-average atmospheric temperature time series. J. Geophys. Res. 2000;105(D6):7337–7356. doi: 10.1029/1999JD901105. [DOI] [Google Scholar]
- Santer BD, Sausen R, Wigley TML, Boyle JS, AchutaRao KM, Doutriaux C, et al. Behavior of tropopause height and atmospheric temperature in models, reanalyses, and observations: Decadal changes. J. Geophys. Res. 2003;108(D1):4002. doi: 10.1029/2002JD002258. [DOI] [Google Scholar]
- Santer BD, Wigley TML, Gleckler PJ, Bonfils C, Wehner MF, AchutaRao K, et al. Forced and unforced ocean temperature changes in Atlantic and Pacific tropical cyclogenesis regions. P. Natl. Acad. Sci. USA. 2006;103(38):13905–13910. doi: 10.1073/pnas.0602861103. http://doi.org/10.1073/pnas.0602861103. [DOI] [PMC free article] [PubMed] [Google Scholar]
- Santer BD, Painter JF, Bonfils C, Mears CA, Solomon S, Wigley TML. Human and natural influences on the changing thermal structure of the atmosphere. Proc. Natl. Acad. Sci. U.S.A. 2013;110(43):17235–17240. doi: 10.1073/pnas.1305332110. [DOI] [PMC free article] [PubMed] [Google Scholar]
- Santer BD, Solomon S, Bonfils C, Zelinka MD, Painter JF, Beltran F, et al. Observed multivariable signals of late 20th and early 21st century volcanic activity. Geophys. Res. Lett. 2015;42(2):500–509. doi: 10.1002/2014GL062366. [DOI] [Google Scholar]
- Seidel DJ, Gillett NP, Lanzante JR, Shine KP, Thorne PW. Stratospheric temperature trends: our evolving understanding. WIREs: Climate Change. 2011;2:592–616. doi: 10.1002/wcc.125. [DOI] [Google Scholar]
- Shepherd TG, Jonsson AI. On the attribution of stratospheric ozone and temperature changes to changes in ozone-depleting substances and well-mixed greenhouse gases. Atmos. Chem. Phys. 2008;8(5):1435–1444. doi: 10.5194/acp-8-1435-2008. [DOI] [Google Scholar]
- SPARC Chemistry-Climate Model Validation (CCMVal) Eyring V, editor. SPARC CCMVal report on the evaluation of chemistry-climate models, SPARC Rep. 5, WCRP-132, WMO/TD-No. 1526. 2010 [Available at http://www.atmosp.physics.utoronto.ca/SPARC.]
- Stolarski RS, Douglass AR, Newman PA, Pawson S, Schoeberl MR. Relative Contribution of Greenhouse Gases and Ozone-Depleting Substances to Temperature Trends in the Stratosphere: A Chemistry–Climate Model Study. J. Clim. 2010;23:28–42. doi: 10.1175/2009JCLI2955.1. [DOI] [Google Scholar]
- Strahan SE, et al. Using transport diagnostics to understand chemistry climate model ozone simulations. J. Geophys. Res. 2011;116:D17302. doi: 10.1029/2010JD015360. [DOI] [Google Scholar]
- Swartz WH, Stolarski RS, Oman LD, Fleming EL, Jackman CH. Middle atmosphere response to different descriptions of the 11-yr solar cycle in spectral irradiance in a chemistry–climate model. Atmos. Chem. Phys. 2012;12:5937–5948. doi: 10.5194/acp-12-5937-2012. [DOI] [Google Scholar]
- Tie X, Brasseur G. The response of stratospheric ozone to volcanic eruptions: Sensitivity to atmospheric chlorine loading. Geophys. Res. Lett. 1995;22(22):3035–3038. doi: 10.1029/95GL03057. [DOI] [Google Scholar]
- Thompson DWJ, Solomon S. Understanding Recent Stratospheric Climate Change. J. Clim. 2009;22(8):1934–1943. doi: 10.1175/2008JCLI2482.1. [DOI] [Google Scholar]
- Thompson DWJ, Seidel DJ, Randel WJ, Zou C-Z, Butler AH, Mears C, et al. The mystery of recent stratospheric temperature trends. Nature Climate Change. 2012;491(7426):692–697. doi: 10.1038/nature11579. [DOI] [PubMed] [Google Scholar]
- Timmreck C, Graf H-F, Lorenz SJ, Niemeier U, Zanchettin D, Matei D, et al. Aerosol size confines climate response to volcanic super-eruptions. Geophys. Res. Lett. 2010;37:L24705. doi: 10.1029/2010GL045464. [DOI] [Google Scholar]
- Vernier JP, Thomason LW, Pommereau JP, Bourassa A, Pelon J, Garnier A, et al. Major influence of tropical volcanic eruptions on the stratospheric aerosol layer during the last decade. Geophys. Res. Lett. 2011;38(12) doi: 10.1029/2011GL047563. [DOI] [Google Scholar]
- Wang L, Zou C-Z, Qian H. Construction of stratospheric temperature data records from stratospheric sounding units. J. Clim. 2012;25:2931–2946. doi: 10.1175/JCLI-D-11-00350.1. [DOI] [Google Scholar]
- Waugh DW, Oman L, Kawa SR, Stolarski RS, pawson S, Douglass AR, et al. Impacts of climate change on stratospheric ozone recovery. Geophys. Res. Lett. 2009;36(3):L03805–6. doi: 10.1029/2008GL036223. [DOI] [Google Scholar]
- WMO. Scientific Assessment of Ozone Depletion: 2010, Global Ozone Research and Monitoring Project – Report No. 55. Geneva, Switzerland: 2010. p. 416. [Google Scholar]
- Zou C-Z, Qian H, Wang W, Wang L, Long C. Recalibration and merging of SSU observations for stratospheric temperature trend studies. J. Geophys. Res. 2014;119(23) doi: 10.1002/2014JD021603. [DOI] [Google Scholar]


