

Summary
Substantial evidence at the subcellular level indicates that the spatial arrangement of synaptic inputs onto dendrites could play a significant role in cortical computations, but how synapses of functionally defined cortical networks are arranged within the dendrites of individual neurons remains unclear. Here we assessed one-dimensional spatial receptive fields of individual dendritic spines within individual layer 2/3 neurons dendrites. Spatial receptive field properties of dendritic spines were strikingly diverse with no evidence of large-scale topographic organization. At a fine scale organization was evident: neighboring spines separated by < 10 microns shared similar spatial receptive field properties and exhibited a distance-dependent correlation in sensory-driven and spontaneous activity patterns. Fine-scale dendritic organization was supported by the fact that functional groups of spines defined by dimensionality reduction of receptive field properties exhibited non-random dendritic clustering. Our results demonstrate that functional synaptic clustering is a robust feature existing at a local spatial scale.
Keywords: Dendritic spine, visual cortex, synaptic cluster
Introduction
Dendritic compartmentalization of synaptic contacts is thought to play a critical role in how single neurons integrate synaptic inputs to perform functional computations. Specifically, the spatial clustering of synaptic contacts possessing similar functional properties is thought to enhance linear and nonlinear dendritic integration (Polsky et al., 2004; Losonczy et al., 2008; Branco et al., 2010; Lavzin et al., 2012; Palmer et al., 2014), facilitate biochemical signaling (Harvey et al., 2008; Nishiyama and Yasuda, 2015; Winnubst and Lohmann, 2015), and encourage cooperative plasticity between neighboring synaptic contacts (Harvey and Svoboda, 2007; Larkum and Nevian, 2008; Makino and Malinow, 2011; Nishiyama and Yasuda, 2015; Lee et al., 2016b). While these studies postulate an important role for functional clustering of inputs in mechanisms of dendritic integration, a number of in vivo studies have failed to find evidence for such clustering, raising doubts about the relevance of these dendritic mechanisms for cortical function (Jia et al., 2010b; 2011; Leischner et al., 2011). Spontaneous activity patterns of dendritic spines have been shown to exhibit temporal correlation or co-activity at a spatial scale consistent with dendritic mechanisms (Takahashi et al., 2012; Lee et al., 2016b), but how correlations in spontaneous patterns of synaptic activity relate to the functional properties of these inputs is unclear.
A departure from previous functional studies is the work by Wilson et al. (2016) which demonstrates clustering in the orientation preference of synaptic inputs that correlates with the sharpness of somatic tuning. Similar to this type of clustering in ferret, a recent study has demonstrated synaptic clustering for retinotopy in mouse V1, but not for orientation preference (Iacaruso et al., 2017). While both of these results are consistent with a role for functional synaptic clustering in shaping response properties of cortical neurons, whether the principle of synaptic clustering generalizes to the rich diversity of inputs a neuron receives remains unclear. Even individual inputs with similar orientation preference can differ in a number of other features such as optimal location in visual space, sign of contrast (ON vs. OFF), direction selectivity, and ocular preference (Lennie, 1999). Here we assess several different receptive field properties that characterize individual synaptic inputs, evaluate evidence for synaptic clustering, and determine whether clustering exists on a scale consistent with the proposed mechanisms of dendritic integration (Larkum and Nevian, 2008; Major et al., 2013).
To address these issues, we used a simple visual stimulus configuration--an edge stimulus at the cell’s preferred orientation--to map the receptive field (RF) center and polarity (ON vs. OFF) of the synaptic inputs to large numbers of spines on individual layer 2/3 neurons using in vivo two-photon imaging of a genetically encoded calcium indicator GCaMP6s (Chen et al., 2013). Spines on individual neurons exhibited a high degree of diversity in spatial organization and polarity of their receptive fields, and there was no apparent global organization within the dendritic field. Nevertheless, within this heterogeneity, fine-scale synaptic clustering exists for spatial location and polarity: spines separated by < 10 microns were more likely than chance to share similar properties and exhibit significant distance-dependent correlation in their activity patterns. This fine-scale clustering was evident in patterns of spontaneous synaptic activity and trial-to-trial activity evoked by drifting gratings. Furthermore, we found that functional groups of spines defined by dimensionality reduction of spine populations from individual neurons were predictive of spatial clustering. Taken together, these results provide strong support for fine-scale functional clustering as a fundamental organizing principle of the spatial arrangement of synaptic inputs within the dendritic fields of cortical neurons.
Results
Mapping spatial receptive fields of dendritic spines
To map the synaptic organization of visual space within the dendritic field, we used in vivo two-photon imaging of calcium dynamics following sparse adeno-associated virus (AAV) expression of a genetically encoded sensor (GCaMP6s) in layer 2/3 neurons of ferret visual cortex (Wilson et al., 2016) (see Methods). We measured the RF in visual space of both soma and dendritic spines (Fig. 1a–b) for individual neurons using sparse one-dimensional (1-D) bars of light (Movshon et al., 1978; Lampl et al., 2004). After determining the basic RF properties of the soma, we presented an array of light or dark bars aligned to the preferred orientation and centered on the somatic RF center. By design, stimuli were optimized for individual neurons and arranged such that only a subset of bars elicited calcium responses from the soma (Fig. 1a, middle), allowing us to probe locations in visual space driving both suprathreshold and subthreshold input extending beyond the spiking RF (Priebe, 2008). Probing subthreshold input from the surrounding visual space restricts sensory-driven dendritic calcium signals in the form of back-propagating action potentials. Following characterization of the somatic RF, we serially imaged dendritic segments with visible spines. Spine calcium fluorescence was isolated from dendritic shaft signals and dendritic spine responses were extracted using published methods (Wilson et al., 2016). Spines used for subsequent analysis fulfilled several criteria (see Methods). Across all neurons imaged (n = 18) we recovered a total of 1,018 spines with reliable activity driven by bar stimuli (mean = 56.6 ± 37.9 SD spines per cell, median = 47.5 spines per cell).
Figure 1. Measuring 1-D spatial receptive fields of individual soma and spines.

(a) Two-photon projection of a cortical cell soma and an example ΔF/F fluorescence trace during visual stimulation are shown (left). Stimulus-averaged responses for each bar location in visual space revealed spatial and polarity selectivity (right). Stimulus onset is at the beginning of each response shown. Black lines and gray shading indicate mean and SE, respectively. Temporal specificity of responses to individual bars allows separation of ON (e.g. increase in luminance) or OFF (e.g., decrease in luminance) responses, shown as red and blue, respectively. Peak ΔF/F responses extracted from stimulus-triggered cycles were used to generate ON and OFF spatial RFs (right). Data were fit to a Gaussian curve. (b) Same as (a) for an individual spine. Spine residual ΔF/F fluorescence trace (green) shows large, independent, isolated calcium events. (c–e) Same as (b) for additional spines from the same cortical cell. See also Figures S1–3.
To quantify the spatial RF of spines and soma we calculated the peak change in fluorescence driven by each stimulus. The onset and offset of bar stimuli were used to analyze ON and OFF responses evident in stimulus-averaged responses in both the soma (Fig. 1a, middle) and individual spines (Fig. 1b, middle). Peak ON and OFF responses were plotted as a function of stimulus location relative to the soma and fitted to a Gaussian curve to characterize RF properties (see Methods). Average peak responses evoked with a dendritic spine’s preferred stimulus were large in amplitude (mean ΔF/F = 86% ± 64 SD, median ΔF/F = 68%) and dendritic spines often displayed calcium events independent of parent dendrites.
Individual dendritic spines were strongly selective for locations in visual space, and spines occupying the same dendritic branch frequently responded to a diverse set of locations, including those not effective in evoking a somatic response (Fig. S1, Supp. Mov. 1). Many spines even responded selectively to a particular bar size (Fig. S2). Compared to the somatic RF center, spine spatial preferences spanned a wide region of visual space (absolute value of spatial preference difference: ON range = 0 – 36.0°, ON median = 4.8°; OFF range = 0 – 33.6°, OFF median = 3.4°; Fig. 2h). Although the populatio n of single spine RF centers spanned broad wide regions of visual space, synaptic aggregates for individual neurons could roughly capture somatic spatial preference, as measured by the pairwise difference between spatial preferences (ON: mean difference = 1.72° ± 6.47 ° SD, OFF mean = −0.82° ± 7.70 ° SD; Fig. S3). Although predictably, synaptic aggregate RFs were consistently larger than their somatic counterparts (ON: spine mean FWHM = 13.6° ± 13.5° SD, soma mean FWHM = 5.8° ± 4.5° SD; OFF: spine mean FWHM = 17.8° ± 15.8° SD, soma mean FWHM = 5.4° ± 5.1° SD; Fig. S3).
Figure 2. Lack of global dendritic organization for spine spatial preferences.

(a–b) Two example single neurons with all serially imaged visually responsive spines and corresponding soma colored by spatial preference (scale bar 50 μm). Spatial preferences are shown for dominant polarity for each spine. (c) Distribution of normalized spine responses for a single bar location is shown with a dendritic center of mass (gray ellipse). Ellipse axes are two SDs of spatial patterns of synaptic responses. Inset: center of mass ellipses for each stimulus spatial location. (d) An example is shown of the overlap of the center of mass ellipses calculated for two different spatial locations. (e) The relationship between bar position distance and center of mass overlap is shown. (f) The relationship between bar position distance relative to the soma preference and center of mass overlap is shown. (g) The relationship between bar position distance and center of mass overlap for ON (red) and OFF (blue) spatial patterns is shown separately. (h) The distribution of spine ON spatial preferences, relative to the soma, is shown at distal (>75 μm) and proximal (<75 μm) dendritic locations. (i) Same as (h) for OFF spatial preferences. (j) Distribution of spine ON-OFF ratios at distal and proximal dendritic locations is shown. See also Figure S3.
Dendritic spines also differed greatly in their response to stimulus polarity and arrangement of ON and OFF spatial domains. Some spines were selective for a single polarity (Fig. 1b–c), both polarities with spatial overlap (Fig. 1d), or both with spatial segregation (Fig. 1e). This wide variety of ON and OFF responses was evident in both spine ON-OFF ratios (range = 0 – 1, median = 0.50; Fig. 2j) and ON-OFF spatial overlap (range = 0.11 – 1.0, median = 0.53) (Lee et al., 2016a). Given this distribution of ON and OFF response properties, synaptic aggregates for individual neurons did not match somatic polarity sensitivity, as synaptic aggregates were generally balanced in ON and OFF contribution (soma ON-OFF ratio: range = 0.10 – 0.92, median = 0.49, synaptic aggregate ON-OFF ratio: range = 0.42 – 0.64, median = 0.47; Fig. S3).
Because the offset of white bars may not drive spines equivalent to the onset of opposing black bars (Movshon et al., 1978), in a subset of cells we presented both polarities (298 spines from six cells). While distributions of spine ON-OFF ratios and ON-OFF overlap between stimulus sets were similar (single polarity: ratio range = 0–1.0, overlap range = 0.11 – 1.0; both polarities: ratio range = 0 – 1.0, overlap range = 0.16 – 1.0), these distributions were statistically different from each other (ON-OFF ratio: single polarity median = 0.49 with an IQR of 0.27, both polarities median = 0.58 with an IQR of 0.35, p = 1.80e-9; ON-OFF overlap: single polarity median = 0.49 with an IQR 0.28, both polarities median = 0.67 with an IQR of 0.30, p = 3.97e-32; Wilcoxon rank-sum test).
Absence of large-scale dendritic organization
Before investigating the fine-scale organization of dendritic spine spatial preferences, we sought to determine whether order was present at larger scales: within individual dendritic branches or across the dendritic field. A significant degree of regional homogeneity in dendritic spine spatial preference would limit the usefulness of exploring the representation of visual space as a means to assess fine-scale dendritic organization and clustering diversity. While in mouse visual cortex, synaptic inputs are reported to be retinotopically organized within the dendritic field of individual neurons (Iacaruso et al., 2017), in ferret visual cortex we could not discern any obvious order in the large-scale topology of the representation of visual space when considering individual spine spatial preferences and corresponding locations within the dendritic arbors (Fig. 2a–b). Spines responding to spatially disparate locations appeared to be scattered throughout the dendritic field and individual branches exhibited spines representing the full range of spatial locations stimulated (Fig. S1).
To systematically test for large-scale order or dendritic topology for visual space, we examined the spatial organization of spine responses at each stimulus location (Fig. 2c). For simplicity, we began by averaging ON and OFF responses for each spine to exclude stimulus polarity, and then computed a center of mass with respect to spine locations within the dendritic arbors and their normalized responses for each visuotopic location (Fig. 2c). If there exists an orderly global representation of visuotopic space in the synaptic inputs to single neurons, then stimuli at opposing ends of the somatic spatial RF should evoke distinct spatial patterns of synaptic activity, spatially offset within the dendrites. Thus, we computed the percentage of overlap between spatial patterns of synaptic input relative to their stimulus distances, using center of mass ellipses (Fig. 2d). There was no relationship between the center of mass overlap and the distance between bar positions (slope = −0.003, r2 = 0.041, 1162 comparisons from 18 cells, Fig. 2e). We then tested the possibility that the representation of visual space in synaptic populations was relative to somatic selectivity, by examining overlap as a function of distance from somatic preference. Here we found no relationship (slope = −0.009, r2 = 0.042, 168 comparisons from 18 cells, Fig. 2f). As these data excluded polarity, we also measured the center of mass for ON and OFF responses separately, and found no relationship (ON: slope = −0.004, r2 = 0.006; OFF: slope = −0.003, r2 = 0.006; 1162 comparisons from 18 cells for both; Fig. 2g). It is important to note that we cannot rule out the possibility of an orderly topology along axes of visual space other than orthogonal to a cell’s preferred orientation as measured here.
In an effort to determine whether some large scale order in the arrangement of functional inputs escaped detection with this analysis, we asked whether spine response properties exhibited systematic order as a function of distance from the soma. For example, spines closer to the soma might exhibit a greater degree of similarity to the soma than those located at more peripheral locations in the dendritic field (Iacaruso et al., 2017). For each spine we measured the shortest dendritic path distance to the soma and then compared the RF properties for proximal (<75 μm) and distal (>75 μm) spine populations. We found no significant difference between these two populations in the degree to which their responses resembled the somatic response, either for ON or OFF spatial preferences relative to the soma (ON: proximal median = 4.8 with an IQR of 7.3, n = 223, distal median = 4.6 with an IQR of 6.5, n = 287, p = 0.287; OFF: proximal median = 3.6 with an IQR of 5.4, n = 190, distal median = 3.2 with an IQR of 5.0, n = 318, p = 0.131; Wilcoxon rank-sum; Fig. 2h–i).We then considered that there might be proximal/distal asymmetry in the spatial distribution of ON and OFF inputs, and found a small but statistically significant difference between ON-OFF ratios (proximal median = 0.52 with an IQR of 0.30, n = 413, distal median = 0.49 with an IQR of 0.28, n = 605, p = 6.4e-3; Wilcoxon rank-sum, Fig. 2j). Together, these observations demonstrate a global, distributed synaptic representation of visual space within the dendritic arbors of cortical neurons, an organization similar to that described for other cortical response properties such as orientation (Jia et al., 2010b; Chen et al., 2013; Wilson et al., 2016), tonotopy (Leischner et al., 2011), and somatotopy (Jia et al., 2011). Given the lack of large-scale order, we turned our attention to probing fine-scale synaptic arrangement of visual space within individual dendrites.
Local dendritic organization of synaptic spatial receptive fields
Despite the large amount of diversity in the synaptic inputs to single branches, we frequently observed nearby dendritic spines with similar preferences in visual space and stimulus polarity (Fig. 3a, left). In some cases, spines were located adjacent to one another on the dendritic shaft; spines 1 and 2, for instance, had a strong OFF response −6° from the somatic RF center (Fig. 3a). In other cases, spines were located opposite each other on the dendritic shaft, such as spines 3 and 4, which preferred white bars presented 9° from the somatic RF center (Fig. 3a). Furthermore, although we did observe shared synaptic RF properties between nearby dendritic spines, these spines were intermixed with those exhibiting a wide range of spatial selectivity (e.g., spines 5 and 6).
Figure 3. Local clustering of spine spatial RF properties.

(a) Example dendritic branch is shown with spines sharing similar spatial preference and RF properties. Spines are colored based on spatial preference for ON and OFF. Spines with multiple colors indicate strong ON and OFF responses with different spatial preference. Spatial ON and OFF ΔF/F responses (mean and SE) are shown with a fitted Gaussian curve. (b) Tuning correlation between spines is dependent on dendritic distance. Data shown are mean and SE with an exponential curve fit (black line). A bootstrapped shuffled correlation is also shown (gray). (c) The distribution is shown of the mean correlation of clustered spine pairs (correlation > 0.5, distance < 10 μm) with soma RF (black outline). Also shown is the distribution of RF correlation between all individual spines and soma (gray). See also Figure S4.
To systematically characterize functional clustering, we computed a pairwise cross-correlation of spine spatial RFs (see Methods) and distance along the dendritic shaft. Across all contiguous dendritic branches imaged (933 spines from 116 segments, mean = 8.04 ± 5.9 SD per dendrite), we found that spines less than 5 μm apart exhibited greater similarity in their functional responses than those farther away (Fig. 3b). Importantly, local spines exhibited greater tuning correlation than explained by randomly shuffling spines within their respective contiguous dendritic segments (0 – 2 μm: mean correlation = 0.28 ± 0.03 SE, mean shuffled correlation = 0.17 ± 0.01 SE; Fig. 3b). An exponential fit to these data (see Methods) revealed that the length constant of functionally defined synaptic clusters was ~5 μm, similar to recent measurements of 2-D RF correlation in mouse V1 (Iacaruso et al., 2017). Tuning correlation, which accounts for multiple aspects of spine RFs, was also strongly related to the difference in spatial preferences (Fig. S4).
Since we previously demonstrated synaptic clustering aligned to somatic orientation preferences (Wilson et al., 2016), clusters might preferentially represent somatic properties. By examining only nearby, correlated spine pairs with similar functional responses (distance < 10 μm, correlation > 0.5, n = 271 pairs), we computed the average RF correlation of the somatic RF with spine pairs (Fig. 3c). The majority of spine pairs, potentially comprising synaptic clusters, did not strongly reflect somatic RF properties (median correlation = 0.25, IQR = 0.54, n = 271) and this distribution was not statistically different than the RF correlation between all individual spines and somas (median correlation = 0.17, IQR = 0.51, n = 933, p = 0.11, Wilcoxon rank-sum, Fig. 3c). These data provide compelling evidence that local synaptic clustering spans a range of functional spatial RF properties.
Functional similarity between neighboring spines suggests that an appropriate visual stimulus co-activates spines and this co-activation could show a similar distance dependence. As our stimulus generates brief synaptic calcium transients (Fig. 1b–e), we were able to observe co-active synaptic calcium events on a trial-by-trial basis (Fig. 4a). Nearby spines with matching spatial preferences were sometimes strongly co-activated by repeated presentations of the same bar (Fig. S5a and Supp. Movie 2). Synaptic events, depicted in Figure 4a, were identified as single trial events with amplitudes greater than five SDs of the baseline calcium fluorescence (Fig. S5b, see Methods). Across dendritic branches imaged simultaneously (n = 921 spines from 123 segments, mean = 7.5 ± 4.9 SD spines per dendritic segment) we found a strong distance-dependent relationship between spine trial-to-trial correlation and dendritic distance (Fig. 4b). As for RF similarity, nearby spines were significantly correlated compared to a within-segment shuffle (0 – 2 μm: mean correlation = 0.23 ± 0.02 SE, n = 200 spine comparisons, mean shuffled correlation = 0.14 ± 0.004 SE, n = 1000 iterations, p = 1.38e-32, Welch’s t-test); the spatial length constant was ~5 μm. This relationship was observed even when excluding synaptic trials correlated with the dendritic signal (exclusion criteria: > 0.15 correlation; 0 – 2 μm: mean correlation = 0.17 ± 0.02 SE, n = 200 spine comparisons, mean shuffled correlation = 0.07 ± 0.002 SE). We also computed the probability of co-active synaptic calcium events (Fig. S5b, see Methods) and found a significantly greater probability of co-activity between spine pairs less than 5 μm apart (Fig. 4c), although the spatial dependency for this relationship was weak. It is perhaps not surprising that we observed similar local synaptic clusters with both tuning and trial-to-trial correlation, as there was a strong relationship between the two metrics for dendritic spines (bootstrapped principal component analysis, PCA, slope = 0.29 ± 0.01 SE, r2 = 0.28, Fig. 4d).
Figure 4. Synaptic clusters exhibit spatiotemporal correlation.
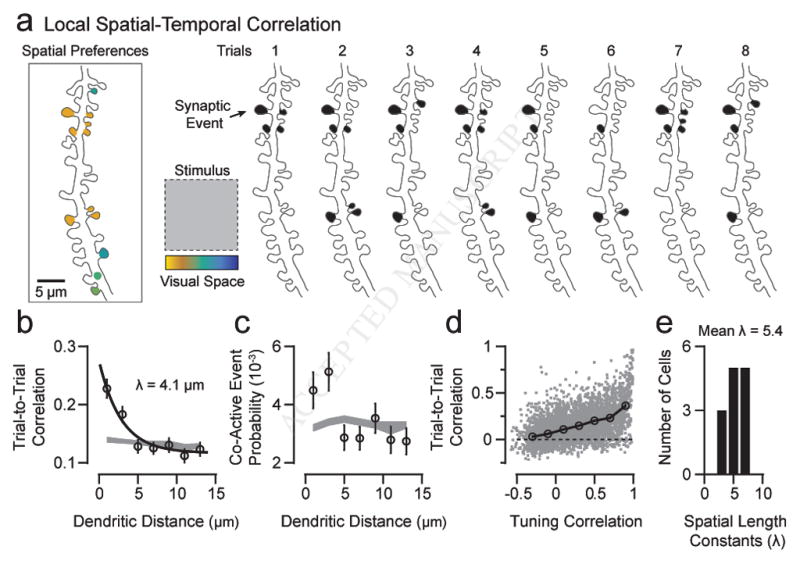
(a) Example dendritic branch is shown with responsive dendritic spines, colored by spatial preference. Co-active synaptic events occurred across repeated presentations of a bar at a single spatial location. (b) The trial-to-trial correlation between spines was dependent on dendritic distance. Data shown are mean and SE with an exponential curve fit (black line). A bootstrapped shuffled correlation is also shown (gray). See also Figure S5. (c) The probability of co-active synaptic events is plotted relative to spine dendritic distance. Data shown are mean and SE, and a bootstrapped shuffled correlation is shown in gray. (d) The relationship between spine tuning correlation and trial-to-trial correlation is shown. Individual points (gray squares) are shown with mean and SE (black circles). (e) The distribution of spatial length constants were measured across cells.
Different cells might exhibit functional clustering at different spatial scales, possibly resulting from differences in measurement (sampling biases) or from genuine differences in physiological properties. Thus, we computed spatial length constants for each cell’s dendritic spines using spatiotemporal correlations. Out of 18 cells, 13 had statistically significant length constants, as measured with a bootstrapped fit of an exponential function (see Methods). Of this subset, there was surprising consistency in extracted spatial length constants (Fig. 4e); overall, these values matched our previous measurements across all spines (mean λ = 5.4 μm ± 1.6 SD). Taken together, these data strongly support fine-scale local synaptic clustering within functionally diverse synaptic inputs arranged throughout the dendritic arbors.
Local clustering of spontaneous activity and drifting grating responses
Because activation patterns of dendritic spines during spatial mapping exhibited local clustering similar to that reported for spontaneous activity in rodent visual (Winnubst et al., 2015) and somatosensory (Takahashi et al., 2012) cortex, we wondered whether dendritic spines on cortical cells in ferret V1 also display this innate organization. We collected long bouts of spontaneous activity (5–10 min) from neighboring dendritic spines containing events both independent and coincident with global dendritic calcium signals (Fig. 5a–b). Across a population of 244 spines from 13 dendritic segments (median = 19 spines/segment) we found a strong relationship between the temporal correlation of dendritic spine activity and the spine’s distance along the dendritic shaft, exhibiting a spatial scale of ~5 μm (Fig. 5c).
Figure 5. Local clustering of spontaneous activity and drifting grating evoked co-activity.

(a) Two-photon projection of an example dendritic branch with dendritic spines is shown. (b) Time-series traces of ΔF/F activity from a subset of dendritic spines (black) and corresponding global dendritic activity (gray) are shown. Note that spine time-series traces are bAP-subtracted and an exponential filter has been applied (see Methods). (c) The relationship between spine correlation of spontaneous activity and distance along dendritic shaft is shown. Data are shown as mean and SE with an exponential curve fit (black line). A bootstrapped shuffled correlation is shown in gray. (d) Two-photon projection of an example dendritic segment is shown. (e) Individual dendritic spine responses (black) to the presentation of a single oriented grating (0°) is shown, as well as the corresponding dendritic response (gray). (f) The trial-to-trial correlation between spines during drifting grating presentation is dependent on dendritic distance. Data are shown as mean and SE with an exponential curve fit (black line). A bootstrapped shuffled correlation is shown in gray.
The similarity in scale of synaptic clustering between mammalian species and for both spontaneous and driven activity suggests that fine scale synaptic clustering might be a fundamental property. If so, then sensory inputs beyond simple, single bars of light should drive spatially confined patterns of spine activity. In a separate set of experiments, we examined trial-to-trial responses of dendritic spines to presentations of drifting gratings at multiple directions (Fig. 5d). Responses during individual trials revealed that neighboring dendritic spines could exhibit strong co-activity that could occur independent of global dendritic calcium events (Fig. 5e). Across a population of visually responsive dendritic spines (n = 127 from 15 dendritic segments, median = 7 spines/segment) we found that trial-to-trial correlations between spines were distance dependent at a spatial scale of 5 – 10 μm (Fig. 5f). A similar relationship was also observed when excluding synaptic trials correlated with the dendrite (exclusion criteria: > 0.15 correlation; 0 – 2 μm: mean correlation = 0.26 ± 0.02 SE, n = 52 spine comparisons, mean shuffled correlation = 0.18 ± 0.006 SE). Taken together with spontaneous activity patterns and spatiotemporal activity driven by 1-D spatial mapping, our data strongly support fine-scale local synaptic clustering as a pervasive feature of synaptic inputs onto cortical cells.
Functionally defined synaptic clusters with dimensionality reduction
A strong test of the significance of fine-scale functional synaptic clustering is to start with an objective classification of a neuron’s spines into groups based solely on functional measures and ask whether these groups exhibit spatial clustering within the dendritic field at the spatial scale we have described. In order to identify functional synaptic groups within our synaptic populations we turned to dimensionality reduction using PCA and k-means clustering. For this analysis we only used cells with greater than 30 spines (n = 10 cells, total spines = 731, mean = 73.1 ± 43.4 SD spines per cell) and chose the minimum number of principal components (PCs) explaining 60–70% of the variance in each respective dataset (mean = 66.3% ± 4.2 SD).
We first calculated z-scored spine spatial ON and OFF responses (Fig. 6a) and used PCA to generate a set of coefficients describing each spine in a low-dimensional subspace. While PCA reduces the dimensionality of synaptic populations, it can be difficult to visualize more than three PCs at a time. For example, the population in Figure 6a is best described using five PCs but only three can be readily visualized at once. In order to visualize PC coefficients in a two-dimensional (2-D) coordinate system we employed the t-distributed stochastic neighboring embedding algorithm (t-SNE) (Maaten and Hinton, 2008; Ziemba et al., 2016), as shown in Figure 6b (left), which differentiate groupings of spines. We then ran a supervised k-means clustering algorithm on the synaptic PCA coefficients in order to cluster spines (see Methods), where the optimal number of clusters was chosen using the Calinski Harabasz score (Caliński and Harabasz, 1974) as the criterion (Fig. 6b, middle, see Methods). The t-SNE visualization further revealed functional groupings after each spine was labeled based on its identified k-means cluster (Fig. 6b, right). With these functional clusters identified, we could project the labels derived from k-means clustering onto spine locations throughout the dendritic tree (Fig. 6c). Finally, we computed the probability of nearby spines falling into the same functional cluster compared to random chance (see Methods).
Figure 6. Synaptic clusters convey functionally distinct spatial RF properties.

(a) A population of spines from an example cell and z-scored spatial RF responses for both polarities are shown. (b) Left: 2-D visualization of principal component coefficients is shown for the synaptic population in (a) [computed using t-SNE (Maaten and Hinton, 2008)]. Each point represents one spine. Middle: k-means cluster evaluation score is shown for these coefficients. Right: 2-D visualization of principal component coefficients for the synaptic population in (a) is shown. Colors indicate group labels from k-means clustering. (c) Dendritic locations of a subset of spines from (a) are shown. Each spine is colored to indicate the group label from k-means clustering; the group label from k-means clustering is also indicated next to each spine. (d) Neighboring spines < 5 μm distant are more likely to found in the same functional cluster compared to a bootstrapped shuffle (left). Neighboring spines within a 5–10 μm or 10–15 μm distance are no more likely to be from the same functional cluster than chance (middle, right). Shown are points from individual cells (white) and the population (black), in mean and SE. (e) Spatial RFs were generated by averaging spine spatial RFs within the same defined cluster. Data are shown as mean and SE for ON (red) and OFF (blue) responses, normalized within each functional cluster. Also shown is a soma RF (far right). (f) Shown is the relationship between the correlation of functional clusters and soma RFs and the proportion of spines in a corresponding functional cluster.
Across our population of cells, neighboring spines separated by < 5 μm along dendrites were more likely to fall into the same functional cluster (probability same group: mean = 0.31 ± 0.05 SE, median = 0.26 with an IQR of 0.17; shuffled probability: mean = 0.18 ± 0.02 SE, median = 0.16 with an IQR of 0.03; p = 0.002, Wilcoxon signed-rank; Fig. 6d, left). At larger distances (5 – 10 μm, 10 – 15 μm), the probability of spines originating from same functional clusters became no different than by chance (p = 0.70 and p = 0.77, respectively, Wilcoxon signed-rank) (Fig. 6d, middle and right). Cross-validation of our analysis (see Methods) showed that this spatial relationship was robust. These analyses provide corroborating evidence that populations of dendritic spines conveying similar functional properties are clustered within the dendritic arbors on a local spatial scale.
Having identified functional ensembles in our spine populations, we wondered how ensembles relate to the somatic RF. Synaptic clusters might build the somatic RF or aid in providing strong input co-tuned with the somatic output (Cossell et al., 2015; Wilson et al., 2016; Lee et al., 2016c; 2016c). To explore this possibility we generated spatial RFs for identified clusters by averaging spine spatial RFs within the same k-means cluster. We found that the spatial RF for functional clusters in a single cell were highly selective for visual space and stimulus polarity, and could be distinct from each other (Fig. 6e). Functional cluster RF properties could even be distinct from the soma (Fig. 6e, right), suggesting that presynaptic populations are comprised of groups of spines conveying a multitude of features. We then examined the RF correlation between functional clusters and the soma with respect to the proportion of spines in each functional cluster. If synaptic populations are responsible for shaping only the soma properties, we would expect to observe a greater number of spines contributing to functional clusters resembling the soma. Instead, we observed large fractions of spines in functional clusters sharing little similarity to soma RFs (Fig. 6f). There was also no relationship between spatial RF correlations and the proportion of spines in each functional cluster (bootstrapped PCA slope = 0.03 ± 0.04 SE, r2 = 0.05, n = 57 functional clusters from ten cells). From these analyses, synaptic clusters appear to be selective for features both resembling and distinct from the somatic output.
Discussion
Here we demonstrated the local organization of dendritic synaptic inputs by probing the 1-D spatial RFs of individual synaptic inputs onto cortical neurons in ferret visual cortex using in vivo two-photon imaging of a genetically encoded calcium indicator. Building upon our previous study of orientation preference and synaptic homogeneity on dendritic branches (Wilson et al., 2016), we focused on evoking dendritic spine activity within these branches by mapping visual space with bars of preferred orientation. We found no evidence of large-scale topographic organization of visual space across dendritic arbors. However, RFs of neighboring spines within ~5 μm were significantly correlated in their spatial location and were co-activated. Co-activation on this spatial scale was also observed in spontaneous synaptic calcium activity and spine responses driven by drifting gratings. As a further test for understanding the distribution of synaptic inputs within the dendritic field we employed a method of dimensionality reduction (PCA) and a clustering algorithm (k-means) to identify groups of spines based on functional similarity alone. Functional groups were selective for different spatial locations and stimulus polarity, while also exhibiting local dendritic spatial clustering. Altogether, these data suggest that local functional synaptic clustering is a fundamental principle of dendritic organization applying to the diverse set of inputs processed by individual cortical cells.
Comparison with mouse V1
A similar study that probes the synaptic representation of visual space in mouse V1 corroborates our measurements of spine RF diversity and distance-dependent tuning correlations (Iacaruso et al., 2017). This study, in contrast to our own, presents evidence for a global organization of visual space within the dendritic field such that proximal inputs reflect somatic/dendritic RF properties and distal inputs are selective for more distal locations in visual space. They also observe a coarse topology of visual space across the dendritic arbors of individual cells. While discrepancies between our studies might reflect differences in stimulus design (1-D vs. 2-D sparse noise), it is possible there are species differences in how visual space is mapped within a neuron’s dendritic field. Indeed, cortical magnification of central visual space in the ferret is several orders of magnitude larger than that of the mouse (~2×102 mm2/deg2 and ~1×10⁻³ mm2/deg2, respectively) (Law et al., 1988; Garrett et al., 2014), while the width of the dendritic arbors of layer 2/3 neurons is more comparable in size (NeuroMorph.Org; Ascoli et al., 2007). Thus, it is perhaps not surprising that a coarse visuotopic progression is evident within the dimensions of the dendritic field in the mouse and less detectable in the ferret. It also appears there is a species difference in synaptic architecture at the scale of synaptic clustering. While Iacaruso et al. (2017) provide evidence for synaptic clustering based on visuotopy, they find no evidence for clustering of inputs with similar orientation preference. In the ferret, synaptic clustering is found not only for visuotopy and polarity but also for orientation preference, stimulus-evoked temporal co-activity, and spontaneous activity. Further studies will be necessary to better understand the factors contributing to the spatial organization of functional inputs within the dendritic field of cortical neurons at both global and local scales and how these vary across species.
Spatial scale of synaptic plasticity and coactivity
An intriguing finding from our study is the omnipresent spatial length constant of 5 – 10 μm. This value has been reported across a wide range of studies employing different experimental techniques in several neural circuits. Following the induction of synaptic plasticity in hippocampal neurons, many biochemical signaling molecules diffuse into neighboring spines and along dendritic segments in a spatially restricted manner (Nishiyama and Yasuda, 2015). For example, the activation of the guanosine triphosphatase Ras in single spines caused the spread of Ras through ~10 μm of dendrites and neighboring spines (Harvey et al., 2008). Similarly, the induction of plasticity in single spines causes a rapid activation of RhoA which diffuses ~5 μm along the parent dendrite (Murakoshi et al., 2011). Synaptic plasticity in single spines can also have a direct cooperative effect: neighboring spines < 10 μm within a spine undergone synaptic plasticity have a reduced threshold for potentiation (Harvey and Svoboda, 2007). Further, in developing hippocampal neurons, synaptic inputs can trigger local calcium-induced calcium activity at this spatial scale (~8–9 μm), a property enhanced by clustered synaptic input and dependent on ryanodine receptor activation (Lee et al., 2016b).
Since local plasticity mechanisms might shape synaptic arrangements on dendritic segments, studies have explored the spatial scale of spine ensemble activity. Studies by both Takahashi et al. (2012) and Kleindenst et al. (2011) reached a similar conclusion from in vitro measurements: spines within ~10 μm exhibited higher rates of co-activation. Takahashi et al. (2012) also observed co-active spines in vivo and arrived at a similar, albeit slightly smaller, spatial length constant for spine co-activations (~6 μm), which closely resembled our own measurements (Fig. 5a–c). A recent study in mouse visual cortex demonstrated that spontaneous synaptic co-activity exhibits a spatial scale of ~10 μm, with the greatest probability of co-activity occurring between neighboring spines < 5 μm apart (Winnubst et al., 2015). The similarity between our in vivo functional measurements and these studies provide an indirect link, suggesting that functional synaptic clusters arise through spatially restricted mechanisms of plasticity (Larkum and Nevian, 2008; Winnubst and Lohmann, 2015).
Source of clustered synaptic inputs
Although our observations of synaptic clusters suggest that wiring specificity underlies synaptic architecture, the source of clustered inputs is unclear. Co-active and spatially clustered spines could originate from multiple synaptic contacts of single presynaptic axons. Anatomical reconstructions of a small dendritic volume, comparable to the spatial extent of our dendritic spine imaging, reveal single axons terminating on two or three spines of the same dendritic segment, albeit a minority of the total axonal contacts (Kasthuri et al., 2015). Recent work reconstructing functional excitatory networks in mouse V1 revealed that connected neurons with multiple synaptic contacts occur more often than by chance and multiple synaptic contacts between neuron pairs are arranged closely together on dendritic branches at distances comparable to the distance-dependent correlations we observed (Lee et al., 2016c). This clustering, however, was predicted by anatomical proximity between axons and dendrites, rather than exhibiting specificity in synaptic connectivity (Lee et al., 2016c). Simply, studies of cortical ultrastructure suggest synapse structural locations might not directly relate to synaptic co-activity. Alternatively, co-active spines could arise from convergent afferents from functionally similar presynaptic networks (Takahashi et al., 2012). Because these presynaptic networks might also exhibit synchronized activity, it would be difficult to distinguish this possibility from a single anatomical source without combining functional and ultrastructure synaptic measurements.
Contribution of synaptic clustering to somatic responses
The prevailing view of input organization on dendritic structures is that clustered inputs amplify functional features contributing to spike generation at the soma and, in the case of the measurements presented here, the RF center (Polsky et al., 2004; Losonczy et al., 2008; Branco et al., 2010; Lavzin et al., 2012; Palmer et al., 2014). While an attractive hypothesis, our measurements suggest the role of synaptic clustering in shaping somatic response is more complex; functional clustering was not restricted to spines correlated with the somatic RF (Fig. 3). Additionally, synaptic clusters revealed with PCA were not functionally restricted to the exact somatic RF properties (Fig. 6) suggesting that each cluster potentially represents a collection of synaptic inputs conveying a specific feature or comprising a functional subunit underlying the full RF. In fact, methods estimating the full extent of V1 neuron RFs can reveal a rich set of spatial filters or RFs, rather than a single one, from spiking responses (Rust et al., 2005) and from subthreshold membrane potential fluctuations (Fournier et al., 2014). Our results suggest that synaptic clustering could amplify inputs contributing to both supra- and subthreshold responses, and emphasize the challenges that remain in understanding the complex interplay of different factors within the dendritic field that shape a neuron’s input/output function. In this regard, it should not be surprising that the synaptic aggregate we calculated for individual neurons in our sample was not highly predictive of the somatic response properties (Fig. S3). A full accounting of the input/output function would need to take into account differences in synaptic strength, the distribution of inhibitory inputs within the dendritic field as well as the nonlinearities expected to derive from dendritic clustering.
Implications for network organization
The lack of a global dendritic topography of synaptic inputs within neurons in V1 is surprising but consistent with the distributed functional representations evident for other visual properties (Jia et al., 2010b; Chen et al., 2013; Wilson et al., 2016) as well as with topographically organized properties in other cortical areas (Jia et al., 2011; Leischner et al., 2011). These data suggest that organization at the cellular level is formed through integration and processing of distributed networks at the subcellular level. While this mechanism appears disadvantageous in forming a systematic retinotopic map in visual cortex, it is perhaps amenable to the formation of more selective and larger spatial RFs of higher-order cortical areas, and allows for flexibility in forming multidimensional or multimodal RFs. This wiring allows local integration of synaptic inputs from the entirety of a cell’s RF (center and surround), potentially providing a basis for contextual interactions within the dendritic field (Major et al., 2008; Branco et al., 2010; Behabadi et al., 2012). Functional intermingling of inputs from different sources could also allow for facilitative nonlinear interactions within individual dendrites (Xu et al., 2012).
At the subcellular level, functionally distributed synaptic inputs might provide a number of advantages in the operation of single neurons. Synaptic diversity on individual branches could enhance the computational power of neurons by allowing individual branches or dendritic segments to be more flexible and form specific outputs given the wide range of sensory inputs (Larkum and Nevian, 2008; Major et al., 2013; Remme and Schreiber, 2015). Depending on synaptic strength or efficacy, distributed arrangements could provide an optimal dynamic range for integrating and transforming incoming inputs. A dendritic branch receiving synaptic inputs conveying a single functional property would be susceptible to saturation of dendritic signals and limited sensitivity if those inputs were sufficiently strong; in contrast, distributing those inputs across dendrites would limit saturation susceptibility in individual dendrites. This scenario might prove difficult for neurons to operate in the face of noisy or weak synaptic inputs, but the addition of functional clustering at a local scale could aid in increasing branch sensitivity without sacrificing dynamic range, taking advantage of either dendritic nonlinearities or passive integration (Polsky et al., 2004; Losonczy et al., 2008; Lavzin et al., 2012; Palmer et al., 2014). Local spatial clustering, in combination with a heterogeneous distribution of synaptic inputs and redundancy of functional properties conveyed to individual dendrites could contribute to error tolerance of individual cortical cells in forming robust response properties. A further advantage of distributed synaptic clustering could be a balance in the trade-off between selectivity and plasticity (Remme and Schreiber, 2015): functionally homogenous branches would provide strong somatic input but be resistant to synaptic plasticity, while individual spines within a fully heterogeneous branch would be more easily modifiable but would provide little, if not negligible, somatic input. Although our observations provide strong evidence of local dendritic clustering, the nature of synaptic networks within individual neurons is only recently coming into focus. For example, spatial dimensions of synaptic clusters might depend on natural stimuli or active vision, such as saccadic eye movements or attention. Continued work in this area will undoubtedly provide a more complete understanding of the subcellular operations driving the activity of individual neurons and shaping the functional properties of cortical networks.
STAR METHODS
CONTACT FOR REAGENT AND RESOURCE SHARING
Further information and requests for resources and reagents should be directed to and will be fulfilled by the Lead Contact David Fitzpatrick (david.fitzpatrick@mpfi.org).
EXPERIMENTAL MODEL AND SUBJECT DETAILS
All procedures were approved by the Max Planck Florida Institute for Neuroscience Institutional Animal Care and Use Committee and adhered to the standards of the National Institutes of Health. Juvenile female ferrets (Mustela putorius furo, Marshall Farms) were used all experiments. Ages of acute experiments ranged from P35 to P50. Animals were housed in a vivarium under 16h light/8h dark cycle.
METHODS DETAILS
Virus injection
Juvenile female ferrets (Mustela putorius furo, Marshall Farms) aged P21-P28 (n = 18) were anesthetized with ketamine (50 mg/kg, IM) and isoflurane (1–3%) delivered in O2, then intubated and artificially respirated. Atropine (0.2 mg/kg, SC) was administered to reduce secretions and 1:1 mixture of lidocaine and bupivacaine administered subcutaneously in the scalp. Animals were placed on a feedback-controlled heating pad to maintain internal temperature at 37°C. Under sterile surgical condit ions, a small craniotomy (0.8 mm) was made over the visual cortex 7–8 mm lateral and 2–3 mm anterior to lambda. AAV2/1.hSyn.Cre (Penn Vector Core) was diluted (1:50,000 or 1:100,000) in phosphate-buffered saline (Sigma) and mixed with AAV2/1.CAG.Flex.GCaMP6s or AAV2/1.hSyn.Flex.GCaMP6s (Penn Vector Core) to sparsely express GCaMP6s in layer 2/3 cortical neurons. Beveled glass micropipettes (10–15 μm outer diameter, Drummond Scientific Company) were lowered into the brain, and 138–207 nl of virus were injected over 5 minutes (Nanoject II, Drummond Scientific Company) at 600, 400, and 200 μm below the pia. To prevent dural regrowth and attachment to the arachnoid membrane, the craniotomy was filled with 1% w/v agarose (Sigma-Aldrich).
Cranial Window
After two to three weeks of expression, ferrets were anesthetized with 50 mg/kg ketamine and 1–3% isoflurane. Atropine (0.2 mg/kg, SQ) and bupivacaine were administered. Animals were placed on a feedback-controlled heating pad to maintain an internal temperature of 37 to 38 °C. A tracheotomy was performed and an endotracheal tube installed to artificially respirate the animal. Isoflurane was delivered between 1 and 2% throughout the surgical procedure to maintain a surgical plane of anesthesia. An intravenous cannula was placed to deliver fluids. ECG, endtidal CO2, external temperature, and internal temperature were continuously monitored during the procedure and subsequent imaging session. The scalp was retracted and a custom titanium headplate adhered to the skull using C&B Metabond (Parkell). A 3.5–4.0 mm craniotomy was performed at the viral injection site and the dura retracted to reveal the cortex. One to two pieces of custom coverglass (3 mm diameter, 0.7mm thickness, Warner Instruments) were adhered to a larger coverglass (8mm diameter, #1.5 thickness, Electron Microscopy Sciences) using optical adhesive (# 71, Norland Products) and placed onto the brain to gently compress the underlying cortex and dampen biological motion during imaging. The cranial window was hermetically sealed using a stainless steel retaining ring (5/16″ internal retaining ring, McMaster-Carr), Kwik-Cast (World Precision Instruments), and Vetbond (3M). A 1:1 mixture of 1% Tropicamide Ophthalmic Solution (Akorn) and 10% Phenylephrine Hydrochloride Ophthalmic Solution (Akorn) was applied to both eyes to dilate the pupils and retract the nictating membranes. Eyes were either lubricated hourly with Silicon Oil AP 150 Wacker (Sigma-Aldrich) or contact lenses were inserted (6 – 7mm diameter, Art Optical). Upon completion of the surgical procedure, Isoflurane was gradually reduced and then vecuronium (2 mg/kg/hr) or pancuronium (2 mg/kg/hr) was delivered IV to immobilize the animal.
Two-photon imaging
The animal was placed under the microscope 25 cm from the stimulus monitor, with the monitor subtending 130 degrees in azimuth and 74 degrees in elevation. Imaging was performed using a Bergamo II (Thorlabs) running Scanimage 5 or Scanimage 2015 (Pologruto et al., 2003) (Vidrio Technologies) with dispersion compensated 950nm excitation provided by an Insight DS+ (Spectraphysics). Average excitation power after the exit pupil of the objective (16x, CFI75, Nikon Instruments) ranged from 10 to 80 mW. Individual neurons in layer 2/3 were selected for imaging based on several criteria: visible dendritic spines, nuclear exclusion, orientation-tuned responses, and a lack of large blood vessels obscuring the dendritic field.
Images of dendritic segments were acquired at 30Hz (512×512, resolution: 8.42 – 12.2 pixels/μm) and images of soma were acquired at 30Hz (512×512, resolution: 4.2 – 5.9 pixels/μm). Z-stacks of individual cells were acquired prior to dendritic imaging by averaging 30–100 frames per plane using 1–2μm z-steps. Multiple dendrites, both basal and apical, across multiple depths were imaged on individual cells (178 dendritic segments from 18 cells, median = 9.5 segments/cell). This imaging method only allows visualization of a fraction of spines on a given neuron: those on in-plane dendrites. Dendritic spines can also be obfuscated by blood vessels or other dendrites and small spines might be beyond the microscope resolution. Coarse dendritic ROI position was recorded on the z-stack throughout the experiment. Due to warping of the brain over long imaging sessions, dendritic imaging fields of view were registered onto individual slices of the z-stack using control point registration and an affine transformation. Two-photon frame triggers from Scanimage were synchronized with stimulus information using Spike2 (CED). Throughout the experiment, dendrites were carefully monitored for indications of photodamage. Individual neurons were excluded from data analysis if they exhibited nuclear fluorescence or showed prolonged calcium responses, suggesting cytotoxicity as a result of strong GCaMP expression.
Images in the paper were as follows:
Figure 1a–e Structures: 6750 frames (Standard Deviation projection)
Figure 5a Structure: 6000 frames (Standard Deviation projection)
Figure 5d Structure: 13000 frames (Standard Deviation projection)
Figure S1 Structure: 6750 frames (Standard Deviation projection)
Figure S1 Synaptic Events: 8 – 12 frames (Median projection)
Figure S5a Structure: 5500 frames (Standard Deviation projection)
Figure S5a Synaptic Events: 12 frames (Median projection)
Visual stimuli and receptive field mapping
Stimuli were generated using Psychopy (Peirce, 2007). Somatic orientation selectivity was assessed by presenting drifting gratings. Using a small grating preferred orientation, the location of spatial RF for the dominant eye was mapped for the soma, aided by custom online analysis software (MATLAB). An array light or dark bars aligned to the preferred orientation were centered over the soma RF location. The number of bars used ranged from 7 to 11 and the widths were 2 – 5°, where the parameters were chosen to elicit strong, reliable responses from the soma in a spatially restricted location. We pseudorandomly presented each bar location for 8–10 trials (1 second duration, 2–3 second ISI). In a subset of imaging sessions, 8 trials of 16 full-field drifting gratings were presented (12.5% contrast, 0.06 cycles/°, 4 cycles/second, 3 second stimulus period followed by 3 second ISI, plus a blank).
Cells used for analysis in this paper were required to have somatic responses to 1-D bar stimuli matching that cell’s orientation preference and whose spatial receptive field (RF) center could then be identified and targeted with the bar array. Further, cells were required to have a robust spatial RF stable throughout the course of the imaging. Cells whose RF could not be determined throughout the experiment or became unstable were not used. Typically, we acquired 1 – 2 cells per animal.
Analysis
Images were corrected for in-plane motion using a correlation-based approach (MATLAB). ROI drawing was performed in ImageJ (Schindelin et al., 2012). For somata and spines, ROI’s were circular or drawn using custom software (Cell Magic Wand, see Software). For dendrites, polygonal ROIs were drawn spanning the extent of a short, contiguous dendritic segment. ROI distances from the soma were measured by reconstructing dendritic arbors using Simple Neurite Tracer (Schindelin et al., 2012) and local spine positions on dendritic segments were measured by straightening contiguous dendritic segments in MATLAB. These measurements were combined together to provide estimates of spine distance from the soma. Fluorescence time-courses were computed as the mean of all pixels within the ROI at each time point and were extracted using Miji (Sage et al., 2012). Fluorescence time courses were then synchronized with stimulus information, and visually evoked responses were computed as changes in fluorescence relative to the baseline fluorescence. Dendritic spine fluorescence signals were sometimes contaminated by regenerative dendritic events and we used a computational subtraction procedure to isolate spine calcium signals (Wilson et al., 2016) as follows: (1) perform a robust fit (MATLAB) of spine ΔF/F against dendritic ΔF/F for stimulus-evoked data and (2) subtract a scaled version of the dendritic ΔF/F, where the scaling factor equals the slope from the robust fit. Following subtraction, dendritic spines correlated with dendritic signals (r > 0.50) were excluded from analysis. Note that this correlation was calculated between spine and dendrite ΔF/F while excluding spine ΔF/F values less than 0. Spines used for subsequent analysis were required to have stimulus-evoked responses with an SNR > 1:
where μ is the mean and σ the standard error for stimulus conditions and blank conditions, respectively. This criterion was used for spine responses evoked by both bars and drifting gratings. Spines were also required to have at least three isolated calcium events relative to the dendritic signal, evaluated by visual examination of subtracted ΔF/F time-series traces.
To identify spine calcium events, ΔF/F traces were smoothed with an exponentially weighted moving average filter (MATLAB) (Jia et al., 2010a) and locating the peaks of calcium events. Peak amplitude of calcium events were compared to the standard deviation of baseline spine fluorescence values prior to subtraction. Spines used for analysis of spontaneous activity were required to have at least 1 calcium event (peak amplitude > 3 SD background fluorescence) independent of dendritic calcium events.
Peak ΔF/F responses to bars and gratings were computed using the Fourier analysis to calculate mean and modulation amplitudes for each stimulus presentation, which were summed together. For bars, responses were computed for stimulus onset and offset separately to extract polarity-sensitive responses. Spatial RF ON and OFF responses were fit with a Gaussian equation:
Here x is the bar position, xpref is the preferred spatial location, σ is the tuning width, a is the response amplitude, and ao is an unselective response component. Spatial RF full-width half-max (FWHM) was calculated using the Gaussian fits as follows:
The center-of-mass of spine responses was computed as follows:
Here r is the normalized response of each spine (i) for a given spatial location stimulated (s) and the position of each spine within the dendritic field is represented by its (x,y) coordinates (in microns). Responses were normalized across all ON and OFF stimuli within each spine. To calculate the error within each synaptic response spatial distribution we generated bootstrapped distributions of center-of-mass for each individual stimulus within individual cells. Ellipses were extracted from these data to quantify the (x,y) center and axes lengths, set to be 2 standard deviations.
Trial-to-trial correlations were computed as the correlation of peak ΔF/F responses to each stimulus on a per-trial basis. For spontaneous activity, the correlation was computed between spine ΔF/F time courses (after subtraction) in their entirety (7,828 – 11,772 frames). Distance-dependent correlations were compared to those calculated after shuffling spines and preforming a bootstrap, sampling with replacement from only spines on individual dendritic segments. Distance-dependent correlations were fit with an exponential equation:
Here x is the dendritic distance in microns, α is the mean maximum correlation, β is the baseline correlation, and λ is the spatial length constant. To measure spatial length constants in individual cells, we bootstrapped the data: sampling with replacement, computing the distant-dependent correlation 10,000 times and assessing whether the distribution was significantly different from a mean of 0.
Functional clusters within spine populations were identified by dimensionality reduction with principal components analysis (PCA) and k-means (MATLAB) clustering on PCA coefficients. PCA was conducted on z-scored mean ON and OFF spine responses for individual cells. Only cells with greater than 30 spines were used (n = 10 cells). The number of PCs used for each cell’s spine population was chosen as the minimum number to explain 60–70% of the population variance. As the number of PC’s ranged from 3–6, PC coefficients were visualized in 2 dimensions using the t-distributed stochastic neighboring embedding algorithm (t-SNE) (Maaten and Hinton, 2008). To visualize the data in Figure 6 we used a perplexity value of 20. PCA coefficients were clustered using k-means clustering, running the algorithm for 1,000 iterations. The number of k-means clusters was chosen by identifying the peak of the Calinski-Harabasz score (Caliński and Harabasz, 1974) after evaluating PCA coefficients. Spine populations were then sorted by k-means clustering label. We cross-validated these methods and the nearest neighbor analysis on functional groups by repeatedly preforming this set of analyses on a random subset of each cell’s spine population, comprising 80% of the total spines. We used this procedure to bootstrap our nearest neighbor analysis (probability of spines within a given dendritic distance originating from the same functional group), running for 10,000 iterations.
QUANTIFICATION AND STATISTICAL ANALYSIS
Statistical analyses were performed in MATLAB. We used two-sided non-parametric Wilcoxon ranked-sum or Wilcoxon signed-rank test for paired values. We used two-sided Welch’s t-test for parametric data. Correlations were calculated as Pearson’s and exact sample sizes are included in the text. A bootstrapped PCA was used to quantify the relationships between 2 independent variables (Sokal and Rohlf, 1995). No estimates of statistical power were performed prior to experiments; animal numbers were minimized to conform to ethical guidelines while accurately measuring parameters of animal physiology.
DATA AND SOFTWARE AVAILABILITY
Data are available from the lead author upon reasonable request.
Software
Data are available from the lead author upon reasonable request. Cell Magic Wand (https://github.com/fitzlab/CellMagicWand) was used to draw ROIs for image analysis.
Supplementary Material
Acknowledgments
We are grateful to David Whitney and Kenneth Latimer for helpful discussions and analytical advice, Dominque Ouimet-Erlacher for surgical expertise and animal care, and the support of the Fitzpatrick lab and the Max Planck Florida Institute for Neuroscience.
Footnotes
Author Contributions: B.S. designed the project, B.S., D.E.W., and D.F. wrote the manuscript, B.S. and D.E.W. conducted the experiments, B.S. and D.E.W. analyzed the data.
Publisher's Disclaimer: This is a PDF file of an unedited manuscript that has been accepted for publication. As a service to our customers we are providing this early version of the manuscript. The manuscript will undergo copyediting, typesetting, and review of the resulting proof before it is published in its final citable form. Please note that during the production process errors may be discovered which could affect the content, and all legal disclaimers that apply to the journal pertain.
References
- Ascoli GA, Donohue DE, Halavi M. NeuroMorpho.Org: a central resource for neuronal morphologies. The Journal Neuroscience. 2007;27(35):9247–51. doi: 10.1523/JNEUROSCI.2055-07.2007. [DOI] [PMC free article] [PubMed] [Google Scholar]
- Behabadi BF, Polsky A, Jadi M, Schiller J. Location-dependent excitatory synaptic interactions in pyramidal neuron dendrites. PLoS Comput Bio. 2012;8(7):e1002599. doi: 10.1371/journal.pcbi.1002599. [DOI] [PMC free article] [PubMed] [Google Scholar]
- Branco T, Clark BA, Häusser M. Dendritic discrimination of temporal input sequences in cortical neurons. Science. 2010;329:1671–1675. doi: 10.1126/science.1189664. [DOI] [PMC free article] [PubMed] [Google Scholar]
- Caliński T, Harabasz J. A dendrite method for cluster analysis. Communications in Statistics-theory and Methods. 1974;3(1):1–27. [Google Scholar]
- Chen T-W, Sun Y, Baohan A, Jayaraman V, Svoboda K. Ultrasensitive fluorescent proteins for imaging neuronal activity. Nature. 2013;499:295. doi: 10.1038/nature12354. [DOI] [PMC free article] [PubMed] [Google Scholar]
- Cossell L, Iacaruso MF, Muir DR, Houlton R, Sader EN, Ko H, Hofer SB, Mrsic-Flogel TD. Functional organization of excitatory synaptic strength in primary visual cortex. Nature. 2015;518:399–403. doi: 10.1038/nature14182. [DOI] [PMC free article] [PubMed] [Google Scholar]
- Fournier J, Monier C, Levy M, Marre O, Sari K, Kisvarday ZF, Fregnac Y. Hidden complexity of synaptic receptive fields in cat V1. The Journal of Neuroscience. 2014;34(16):5515–5528. doi: 10.1523/JNEUROSCI.0474-13.2014. [DOI] [PMC free article] [PubMed] [Google Scholar]
- Garrett ME, Nauhaus I, Marshel JH, Callaway EM. Topography and areal organization of mouse visual cortex. The Journal of Neuroscience. 2014;34(37):12587–12600. doi: 10.1523/JNEUROSCI.1124-14.2014. [DOI] [PMC free article] [PubMed] [Google Scholar]
- Harvey CD, Svoboda K. Locally dynamic synaptic learning rules in pyramidal neuron dendrites. Nature. 2007;450:1195. doi: 10.1038/nature06416. [DOI] [PMC free article] [PubMed] [Google Scholar]
- Harvey CD, Yasuda R, Zhong H, Svoboda K. The spread of Ras activity triggered by activation of a single dendritic spine. Science. 2008;321:136. doi: 10.1126/science.1159675. [DOI] [PMC free article] [PubMed] [Google Scholar]
- Iacaruso MF, Gasler IT, Hofer SB. Synaptic organization of visual space in primary visual cortex. Nature. 2017 doi: 10.1038/nature23019. online. [DOI] [PMC free article] [PubMed] [Google Scholar]
- Jia H, Rochefort NL, Chen X, Konnerth A. In vivo two-photon imaging of sensory-evoked dendritic calcium signals in cortical neurons. Nat Protoc. 2010a;6:28–35. doi: 10.1038/nprot.2010.169. [DOI] [PubMed] [Google Scholar]
- Jia H, Rochefort NL, Chen X, Konnerth A. Dendritic organization of sensory input to cortical neurons in vivo. Nature. 2010b;464:1307–1312. doi: 10.1038/nature08947. [DOI] [PubMed] [Google Scholar]
- Jia H, Sakmann B, Konnerth A. Dendritic coding of multiple sensory inputs in single cortical neurons in vivo. Proceedings of the National Academy of Sciences. 2011;108:15420. doi: 10.1073/pnas.1112355108. [DOI] [PMC free article] [PubMed] [Google Scholar]
- Kasthuri N, et al. Saturated Reconstruction of a Volume of Neocortex. Cell. 2015;162:648–661. doi: 10.1016/j.cell.2015.06.054. [DOI] [PubMed] [Google Scholar]
- Kleindienst T, Winnubst J, Roth-Alpermann C, Bonhoeffer T, Lohmann C. Activity-dependent clustering of functional synaptic inputs on developing hippocampal dendrites. Neuron. 2011;72:1012–1024. doi: 10.1016/j.neuron.2011.10.015. [DOI] [PubMed] [Google Scholar]
- Lampl I, Ferster D, Poggio T. Intracellular measurements of spatial integration and the MAX operation in complex cells of the cat primary visual cortex. J Neurophysiol. 2004;92:2704. doi: 10.1152/jn.00060.2004. [DOI] [PubMed] [Google Scholar]
- Larkum ME, Nevian T. Synaptic clustering by dendritic signalling mechanisms. Current opinion in neurobiology. 2008;18:321–331. doi: 10.1016/j.conb.2008.08.013. [DOI] [PubMed] [Google Scholar]
- Lavzin M, Rapoport S, Polsky A, Garion L, Schiller J. Nonlinear dendritic processing determines angular tuning of barrel cortex neurons in vivo. Nature. 2012;490:397–401. doi: 10.1038/nature11451. [DOI] [PubMed] [Google Scholar]
- Law MI, Zahs KR, Stryker MP. Organization of primary visual cortex (area 17) in the ferret. The Journal of Comparative Neurology. 1988;278:157–180. doi: 10.1002/cne.902780202. [DOI] [PubMed] [Google Scholar]
- Lee K-S, Huang X, Fitzpatrick D. Topology of ON and OFF inputs in visual cortex enables an invariant columnar architecture. Nature. 2016a;533:90–94. doi: 10.1038/nature17941. [DOI] [PMC free article] [PubMed] [Google Scholar]
- Lee KFH, Soares C, Thivierge J-P, Béïque J-C. Correlated Synaptic Inputs Drive Dendritic Calcium Amplification and Cooperative Plasticity during Clustered Synapse Development. Neuron. 2016b;89:784–799. doi: 10.1016/j.neuron.2016.01.012. [DOI] [PubMed] [Google Scholar]
- Lee WCA, Bonin V, Reed M, Graham BJ, Hood G, Glattfelder K, Reid RC. Anatomy and function of an excitatory network in the visual cortex. Nature. 2016c;532:370–374. doi: 10.1038/nature17192. [DOI] [PMC free article] [PubMed] [Google Scholar]
- Leischner U, Rochefort NL, Nelken I, Konnerth A. Functional mapping of single spines in cortical neurons in vivo. Nature. 2011;475:501. doi: 10.1038/nature10193. [DOI] [PubMed] [Google Scholar]
- Lennie P. Single units and visual cortical organization. Perception. 1999;27:889–935. doi: 10.1068/p270889. [DOI] [PubMed] [Google Scholar]
- Losonczy A, Makara JK, Magee JC. Compartmentalized dendritic plasticity and input feature storage in neurons. Nature. 2008;452:436. doi: 10.1038/nature06725. [DOI] [PubMed] [Google Scholar]
- Maaten L, Hinton G. Visualizing data using t-SNE. Journal of Machine Learning Research. 2008;9:2579–2605. [Google Scholar]
- Major G, Larkum ME, Schiller J. Active properties of neocortical pyramidal neuron dendrites. Annu Rev Neurosci. 2013;36:1–24. doi: 10.1146/annurev-neuro-062111-150343. [DOI] [PubMed] [Google Scholar]
- Major G, Polsky A, Denk W, Schiller J, Tank DW. Spatiotemporally graded NMDA spike/plateau potentials in basal dendrites of neocortical pyramidal neurons. J Neurophysiol. 2008;99:2584–2601. doi: 10.1152/jn.00011.2008. [DOI] [PubMed] [Google Scholar]
- Makino H, Malinow R. Compartmentalized versus global synaptic plasticity on dendrites controlled by experience. Neuron. 2011;72:1001. doi: 10.1016/j.neuron.2011.09.036. [DOI] [PMC free article] [PubMed] [Google Scholar]
- Movshon JA, Thompson ID, Tolhurst DJ. Receptive field organization of complex cells in the cat’s striate cortex. The Journal of physiology. 1978;283:79. doi: 10.1113/jphysiol.1978.sp012489. [DOI] [PMC free article] [PubMed] [Google Scholar]
- Murakoshi H, Wang H, Yasuda R. Local, persistent activation of Rho GTPases during plasticity of single dendritic spines. Nature. 2011;472:100–104. doi: 10.1038/nature09823. [DOI] [PMC free article] [PubMed] [Google Scholar]
- Nishiyama J, Yasuda R. Biochemical computation for spine structural plasticity. Neuron. 2015;87(1):63–75. doi: 10.1016/j.neuron.2015.05.043. [DOI] [PMC free article] [PubMed] [Google Scholar]
- Palmer LM, Shai AS, Reeve JE, Anderson HL, Paulsen O, Larkum ME. NMDA spikes enhance action potential generation during sensory input. Nature neuroscience. 2014;17:383–390. doi: 10.1038/nn.3646. [DOI] [PubMed] [Google Scholar]
- Peirce JW. PsychoPy—psychophysics software in Python. Journal of neuroscience methods. 2007;162(1):8–13. doi: 10.1016/j.jneumeth.2006.11.017. [DOI] [PMC free article] [PubMed] [Google Scholar]
- Pologruto TA, Sabatini BL, Svoboda K. ScanImage: flexible software for operating laser scanning microscopes. Biomed Eng Online. 2003;2:13. doi: 10.1186/1475-925X-2-13. [DOI] [PMC free article] [PubMed] [Google Scholar]
- Polsky A, Mel BW, Schiller J. Computational subunits in thin dendrites of pyramidal cells. Nature neuroscience. 2004;7:621. doi: 10.1038/nn1253. [DOI] [PubMed] [Google Scholar]
- Priebe N, Ferster D. Inhibition, spike threshold, and stimulus selectivity in primary visual cortex. Neuron. 2008;57(4):482–497. doi: 10.1016/j.neuron.2008.02.005. [DOI] [PubMed] [Google Scholar]
- Remme M, Schreiber S. Dendritic distribution of synaptic input creates a trade-off between input selectivity and flexibility. BMC Neuroscience. 2015;16:P220. [Google Scholar]
- Rust NC, Schwartz O, Movshon JA, Simoncelli EP. Spatiotemporal elements of macaque V1 receptive fields. Neuron. 2005;46:945–956. doi: 10.1016/j.neuron.2005.05.021. [DOI] [PubMed] [Google Scholar]
- Sage D, Prodanov D, Tinevez J, Schindelin J, Year MIJ. Making Interoperability Between ImageJ and Matlab Possible. ImageJ User & Developer Conference (IUDC’12) Mondorf-les-Bains; Grand Duchy of Luxembourg; 2012. p. 227. [Google Scholar]
- Schindelin J, Arganda-Carreras I, Frise E, Kaynig V, Longair M, Pietzsch T, Preibisch S, Rueden C, Saalfeld S, Schmid B, Tinevez J-Y, White DJ, Hartenstein V, Eliceiri K, Tomancak P, Cardona A. Fiji: an open-source platform for biological-image analysis. Nat Methods. 2012;9:676–682. doi: 10.1038/nmeth.2019. [DOI] [PMC free article] [PubMed] [Google Scholar]
- Sokal RR, Rohlf FJ. The principles and practice of statistics in biological research. New York: Edition; 1995. [Google Scholar]
- Takahashi N, Kitamura K, Matsuo N, Mayford M, Kano M, Matsuki N, Ikegaya Y. Locally synchronized synaptic inputs. Science. 2012;335:353–356. doi: 10.1126/science.1210362. [DOI] [PubMed] [Google Scholar]
- Wilson DE, Whitney DE, Scholl B, Fitzpatrick D. Orientation selectivity and the functional clustering of synaptic inputs in primary visual cortex. Nature neuroscience. 2016;19:1003–1009. doi: 10.1038/nn.4323. [DOI] [PMC free article] [PubMed] [Google Scholar]
- Winnubst J, Cheyne JE, Niculescu D, Lohmann C. Spontaneous Activity Drives Local Synaptic Plasticity In Vivo. Neuron. 2015;87:399–410. doi: 10.1016/j.neuron.2015.06.029. [DOI] [PubMed] [Google Scholar]
- Winnubst J, Lohmann C. Synaptic clustering during development and learning: the why, when, and how. Frontiers in molecular neuroscience. 2015:5. doi: 10.3389/fnmol.2012.00070. [DOI] [PMC free article] [PubMed] [Google Scholar]
- Xu N, Harnett MT, Williams SR, Huber D, O’Connor DH, Svoboda K, Magee JC. Nonlinear dendritic integration of sensory and motor input during an active sensing task. Nature. 2012;492:247–251. doi: 10.1038/nature11601. [DOI] [PubMed] [Google Scholar]
- Ziemba CM, Freeman J, Movshon JA, Simoncelli EP. Selectivity and tolerance for visual texture in macaque V2. Proceedings of the National Academy of Sciences. 2016;113:E3140–3149. doi: 10.1073/pnas.1510847113. [DOI] [PMC free article] [PubMed] [Google Scholar]
Associated Data
This section collects any data citations, data availability statements, or supplementary materials included in this article.