Fig. 3.
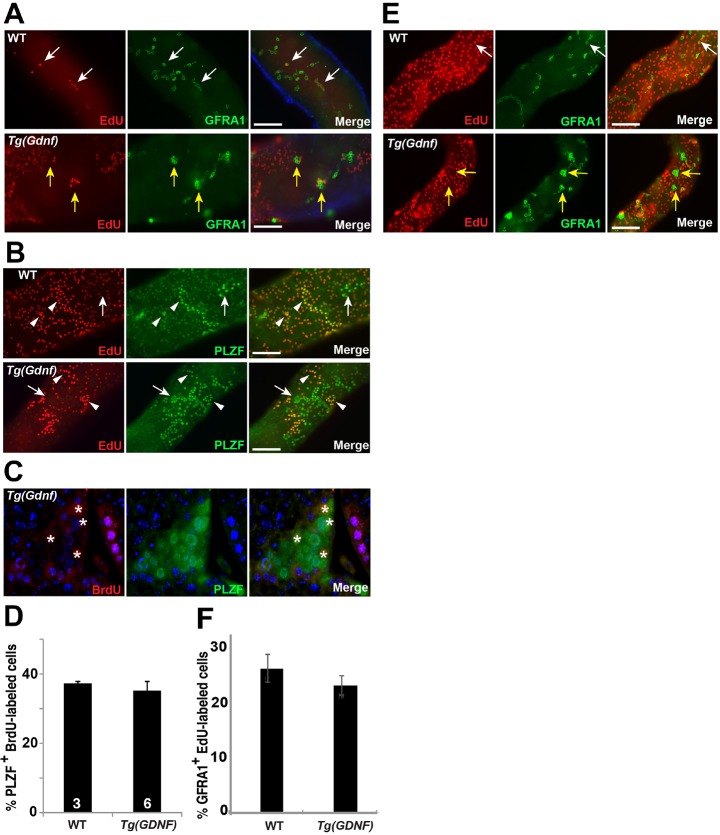
GDNF does not change spermatogonia proliferation. (A) Whole-mount tubules labeled with EdU and immunostained for GFRA1. White arrows indicate As and Aal co-labeled cells. Yellow arrows indicate EdU− GFRA1+ clusters in Tg(Gdnf) tubules. (B) Whole-mount tubules labeled with EdU and immunostained for PLZF. Arrows indicate EdU− PLZF+ Aal and Tg(Gdnf). Arrowheads indicate EdU+ PLZF+ Aal spermatogonia. (C) Testis section labeled with BrdU and immunostained for PLZF. Asterisks indicate BrdU+ cells within a large Tg(Gdnf) cluster. (D) The percentage of BrdU+ PLZF+ cells counted on wild-type and Tg(Gdnf) testis sections as in C, after 4 consecutive days of BrdU injection. Approximately 1000 PLZF cells were counted in randomly selected tubules from each animal (n shown in bars). Data are presented as mean±s.e.m. (E) Whole-mount tubules from P21 mice labeled with EdU and immunostained for GFRA1. White arrows indicate As and Aal co-labeled cells. Yellow arrows indicate EdU− GFRA1+ clusters in Tg(Gdnf) tubules. (F) Percentage BrdU+ GFRA1+ cells counted on wild-type and Tg(Gdnf) testis sections as in E 1 day after BrdU injection. While 27% of GFRA1+ cells (∼600 cells) had incorporated EdU in wild type, only 24% of GFRA1+ were positive (∼1500 cells counted) for EdU in Tg(Gdnf) testis. Data are presented as mean±s.e.m. Scale bars: 100 μm.

