Abstract
Purpose
In cyclic light-reared Pde6brd10 mice, rod cell oxidative stress contributes to the degenerative phenotype. Dark rearing Pde6brd10 mice slows but does not prevent atrophy. This suggests that outer retinal oxidative stress occurs in Pde6brd10 mice independent of light exposure, a hypothesis tested in this study.
Methods
Mouse strains Pde6brd10 and C57Bl/6 (wild type) were dark reared until postnatal day (P) 23 (P23) or P30. In subgroups of dark-reared mice, (1) layer-specific excessive free radical production (i.e., an oxidative stress biomarker) in vivo via QUEnch-assiSTed magnetic resonance imaging (QUEST MRI) was indicated by a significant reduction in the greater-than-normal spin-lattice relaxation rate R1 (1/T1) with methylene blue, (2) superoxide production was measured ex vivo in whole retina (lucigenin), and (3) retinal layer spacing and thickness were assessed in vivo (optical coherence tomography, MRI).
Results
In P23 male Pde6brd10 mice, only the outer superior retina showed oxidative stress in vivo, as measured by QUEST MRI; a lucigenin assay confirmed supernormal superoxide production. In contrast, at P30, no evidence for retinal oxidative stress was observed. In P23 female Pde6brd10 mice, no retinal oxidative stress was apparent; however, at P30, oxidative stress was observed in superior inner and outer nuclear layers. Male and female Pde6brd10 mice at P23 had normal retinal thicknesses, whereas at P30, modest thinning was noted in inferior and superior retina.
Conclusions
We confirmed that outer retinal oxidative stress occurs in male and female dark-reared Pde6brd10 mice. Male and female Pde6brd10 mice demonstrated similar degrees of retinal thinning, but with unexpectedly distinct spatial and temporal retinal oxidative stress patterns.
Keywords: QUEST MRI, free radicals, reactive oxygen species, retinitis pigmentosa
Retinitis pigmentosa (RP), a group of genetic disorders that cause degeneration of the photoreceptors that leads to blindness, is a disease with no cure. Accumulating evidence of RP in animal models raised under 12 hours of light and 12 hours of dark (i.e., cyclic light) suggests that rod cell oxidative stress contributes to photoreceptor atrophy.1–9 For example, cyclic light-reared Pde6brd10 mice demonstrate rod cell oxidative damage on postmortem examination before overt outer retinal degeneration, and antioxidant treatment prolongs photoreceptor survival.1–8 However, conventional ex vivo assays provide poor temporal resolution (e.g., immunohistochemical indices of oxidative damage) or little spatial resolution (e.g., superoxide production from whole retina measured by lucigenin). Furthermore, merging information from these common assays is not possible. Clinically, trials of antioxidant treatment in patients with RP have shown unclear neuroprotective benefits.3,10,11 This ambiguity is likely due to an inability of conventional methods to assess antioxidant efficacy within the retinas of patients, and thus treatment cannot be personalized or optimized with regard to dosing and timing.3,10,11 To address the above problems, new imaging methods with translational potential are needed to measure an oxidative stress biomarker (e.g., excessive free radical production), with high spatial and time resolution, in different layers of the retina in vivo.
To this end, we have developed QUEnch-assiSTed magnetic resonance imaging (QUEST MRI), an imaging method to noninvasively measure sustained production of abnormally high levels of inherently paramagnetic free radicals in different retinal layers.12–14 A positive QUEST MRI index is defined as excessive production of paramagnetic free radicals as a greater-than-normal spin-lattice relaxation rate R1 (1/T1) that can be significantly lowered with an antioxidant (i.e., a quench).12,13,15,16 Methylene blue (MB) is used in this study to suppress excessive free radical production based on its established “parasitic” electron transporter property that effectively minimizes excessive mitochondrial- and oxidase-induced free radical production 24 hours posttreatment.17–20
It is well established that photoreceptor survival can be prolonged in models of RP by rearing animals in the dark.21–24 However, the conditions underlying the eventual degeneration of photoreceptors with dark rearing are not well understood.22 In this study, we examined the novel hypothesis that outer retinal oxidative stress occurs in Pde6brd10 mice independent of light exposure. We compared QUEST MRI in vivo to a “gold standard” ex vivo biomarker of oxidative stress (retinal superoxide production).15 Retinal laminar spacing and thicknesses were evaluated in vivo by using optical coherence tomography (OCT) and MRI.12,13
Materials and Methods
All animals were treated in accordance with the National Institutes of Health Guide for the Care and Use of Laboratory Animals, the Association for Research in Vision and Ophthalmology Statement for the Use of Animals in Ophthalmic and Vision Research, and the Institutional Animal and Care Use Committee (IACUC) authorization. Anesthetized mice were humanely euthanized by cervical dislocation followed by a bilateral pneumothorax, as detailed in our IACUC-approved protocol.
Groups
Male and female Pde6brd10 mice with a C57BL/6 background (Jackson Laboratories, Bar Harbor, ME, USA) and C57BL/6 mice (wildtype [wt]; Jackson Laboratories) were dark reared from birth until postnatal day (P) 23 (P23) or P30. These timepoints were chosen based on literature evidence that there is little outer retinal atrophy at P23 and modest thinning at P30.21,22,24,25 The results from the present study support the thickness results in the literature (see Fig. 6). Approximately 24 hours prior to QUEST MRI examination, subgroups of mice were injected intraperitoneally with either saline (controls) or MB dissolved in saline (bolus intraperitoneal, 1 mg/kg; Sigma-Aldrich Corp., St. Louis, MO, USA). The dose and timing of MB treatment were chosen based on previous studies showing their efficacy at reducing neuronal oxidative stress.17–20
Figure 6.
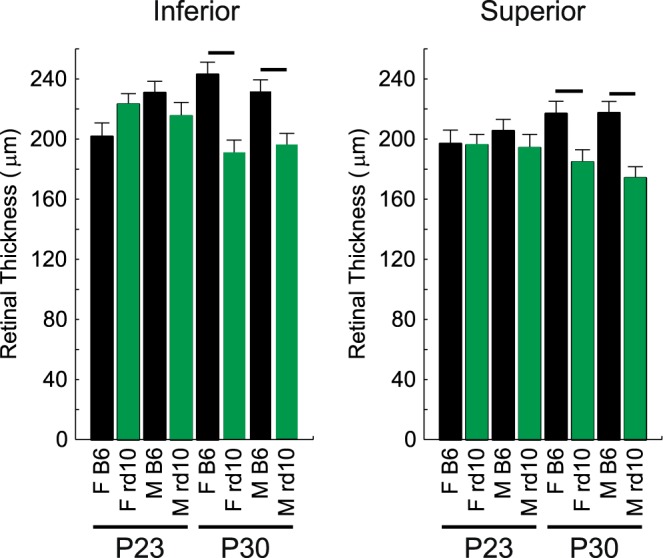
No evidence for retinal thinning in dark-reared P23 mice. MRI-derived whole retinal thicknesses for inferior and superior central retina for saline-injected P23 male wt (n = 7, black), P23 female wt (n = 5, black), P23 male Pde6brd10 (n = 5, green), P23 female Pde6brd10 (n = 8, green), P30 male wt (n = 7, black), P30 female wt (n = 6, black), P30 male Pde6brd10 (n = 7, green), P30 female Pde6brd10 (n = 6, green) mice. Bar = significant difference (P < 0.05).
QUEST MRI
In addition to being dark reared, mice were maintained in darkness for at least 16 hours before and during the MRI examination. In all groups, immediately before the MRI experiment, animals were anesthetized with urethane (36% solution intraperitoneally; 0.083 mL/20 g animal weight, prepared fresh daily; Sigma-Aldrich Corp.) and treated topically with 1% atropine sulfate (Akorn Pharmaceuticals, Lake Forest, IL, USA) to ensure dilation of the pupil. This was followed by application of 3.5% lidocaine gel (Akorn Pharmaceuticals) to reduce sensation that might trigger eye motion and to help keep the ocular surface moist. High resolution 1/T1 data were acquired on a 7 Tesla system (ClinScan; Bruker, Billerica, MA, USA) by using a receive-only surface coil (1.0-cm diameter), as regularly performed in our laboratory.26 In all cases, several single spin-echo (time to echo [TE] 13 milliseconds, 7 × 7 mm2, matrix size 160 × 320, slice thickness 600 μm, in-plane resolution 21.875 μm) images were acquired at different repetition times (TRs) in the following order (number per time between repetitions in parentheses): 0.15 seconds (6), 3.50 seconds (1), 1.00 seconds (2), 1.90 seconds (1), 0.35 seconds (4), 2.70 seconds (1), 0.25 seconds (5), and 0.50 seconds (3). To compensate for reduced signal-noise ratios at shorter TRs, progressively more images were collected as the TR decreased.
Retinal Superoxide Production
Subgroups of dark-reared P23 wt and Pde6brd10 mice were maintained in darkness for at least 16 hours before euthanasia, and their retinas were removed in a dim room. Superoxide production was measured on one retina by using a standard lucigenin (bis-N-methylacridinium nitrate; Sigma-Aldrich Corp.) assay in which each retina preparation was given three carefully timed and gentle shakes, followed each time with three measurements (total of nine measurements).13 Data from one male Pde6brd10 mouse were not used because the laboratory lights were accidentally turned on. Because each subgroup had data collected on different days, companion measurements were obtained each day from 3 dark-adapted 2-month-old wt mice. This allowed us to normalize that day's data to the 2-month-old wt mice and compare data from each group across days.
Optical Coherence Tomography
Optical coherence tomography (OCT) (Envisu R2200 VHR SDOIS; Leica Microsystems, Inc., Buffalo Grove, IL, USA) was used to visualize retinal layer spacing in vivo in subsets of mice (n = 2 per group). Mice were anesthetized with urethane (36% solution intraperitoneally; 0.083 mL/20 g animal weight, prepared fresh daily; Sigma-Aldrich Corp.). A 1% atropine sulfate solution was used to dilate the pupils and GenTeal was used to lubricate the eyes. Optical coherence tomography images were also used to visualize possible changes in laminar spacing in experimental mice and to spatially calibrate the transretinal QUEST MRI profiles.26
MRI Data Analysis
Within each T1 data set comprised of 23 images, images acquired with the same TR were first registered (rigid body) and then averaged to generate a stack of 8 images. These averaged images were then registered across TRs. It is well known that using imperfect slice profiles leads to a bias in the estimate of T1 and a lower than expected T1 value (Chapter 18 in the book by Haacke et al.27). By normalizing to the shorter TR, some of the bias can be reduced, giving a more precise estimate for T1. We normalized by first applying 3 × 3 Gaussian smoothing (performed three times) on only the TR 150-millisecond image to minimize noise and emphasize signal. The smoothed TR 150-millisecond image was then divided into the rest of the images in that T1 data set. In our experience, this procedure minimized the day-to-day variation in the 1/T1 profile previously noted and obviated the need for a “vanilla control” group to minimize day-to-day variations.12,13 The 1/T1 maps were calculated using the 7 normalized images via fitting to a 3-parameter T1 equation (y = a + b*[exp(−c*TR)], where a, b, and c are fitted parameters) on a pixel-by-pixel basis by using R (v.3.3.1) scripts developed in-house and the minpack.lm package (v.1.1.1, Elzhov TV, Mullen KM. minpack.lm: R interface to the Levenberg-Marquardt nonlinear least-squares algorithm found in MINPACK. R package version 1.1–1).
In our previous studies, central retinal superior and inferior 1/T1 values (± 0.4 to 1 mm from the optic nerve head) were examined. However, to better align the retinal regions measured between the two methods in this study, here we expanded our analysis of QUEST MRI data to include more peripheral retinal regions (± 0.4 to 1.4 mm from the optic nerve head). We also noticed that the inferior and superior sides had different 1/T1 profiles and antioxidant responses, and thus each side was analyzed and presented separately.
In each mouse, retinal thicknesses (μm) were objectively determined using the “half-height method” wherein a border is determined via a computer algorithm based on the crossing point at the midpoint between the local minimum and maximum, as detailed elsewhere.28,29 The distance between two neighboring crossing points thus represents an objectively defined retinal thickness. The 1/T1 profiles in each mouse were then normalized with 0% depth at the presumptive vitreoretinal border and 100% depth at the presumptive retina-choroid border. The present resolution is sufficient for extracting meaningful layer-specific anatomical and functional data, as previously discussed.30,31
Statistical Analysis
Data are presented as mean ± standard error of the mean (SEM), and a significance level of 0.05 was used for all analyses. All measurements (superoxide, MRI thickness, and 1/T1) were evaluated for a normal distribution by using residuals from the model used to test for differences, with no extreme departures from normality observed for any of the measurements. We used a linear mixed model for analyzing all outcome measurements. Type 3 tests in SAS (SAS Institute, Cary, NC, USA) were used to test fixed effects by using the Kenward-Roger method to calculate degrees of freedom.
Preliminary examination of the MRI profile data suggested that (1) superior and inferior sides of the retina exhibited distinctly different profiles in saline and MB Pde6brd10 mice, and (2) male Pde6brd10 mice appeared more responsive to MB than female Pde6brd10 mice. Thus, we included both side and sex in the analyses of the MRI profile data. We used a linear mixed model with cubic splines to model and compare mouse-specific MRI profiles. We included the fixed effects of “group” (wt, Pde6brd10 with saline, Pde6brd10 with MB), side, sex, MRI depth included as a cubic spline, and interactions among these effects. The number of “windows” with a relationship between 1/T1 and MRI depth (i.e., “knots”) was initially evaluated separately for each group (each “strain”/side/sex combination), and the Akaike information criteria (AIC) and Schwarz Bayesian information criteria (BIC) were used to identify the model with the fewest knots needed to model all groups. We also evaluated the number of knots in the potential full model that included all interactions. Based on this initial analysis, we used 5 knots for P23 mice and 7 knots for P30 mice in all remaining analyses. Random coefficients for the intercept and the depth-specific coefficients (cubic spline coefficients) were included in the model, based on comparing models with different sets of random coefficients by using AIC and BIC. For P23 mice, the 4-way interaction of group × sex × side × depth (all depth coefficients included) was marginally significant (P = 0.0712) based on a likelihood ratio test. Given the lower power expected for such a higher-order interaction, we decided to continue with a model that included the 4-way interaction. This 4-way interaction represents the differences in the 1/T1 MRI profiles among the specific combinations of group, sex, and side. For P30 mice, the 4-way interaction of group × sex × side × depth (all depth coefficients included) was not significant (P = 0.1969) based on a likelihood ratio test. All 3-way interactions were significant (P < 0.05), leading us to choose a final model with no 4-way interaction, but instead, all 3-way interactions. Mean differences between groups along depth were evaluated using contrasts based on the final model.
Superoxide was measured in 3 batches with 3 replicates per batch for each mouse, leading us to include random effects for mouse within group and batch within mouse and group. We included the fixed effects of strain and sex, along with the strain × sex interaction. Our preliminary analyses suggested that the variability differed among the strain × sex combinations. We included different residual and batch variances for male Pde6brd10 mice, based on evaluating potential heterogeneous variances by using the likelihood ratio test. Sex differences within strain, and strain differences within sex were examined using contrasts based on the final model.
Thickness was compared among postnatal day, strain (B6 vs. Pde6brd10), sex, and side (inferior vs. posterior) by using a linear mixed model that included a random intercept due to mouse nested within strain, day, and sex.
Results
QUEST MRI at P23
A positive QUEST MRI response indicative of oxidative stress was defined as the overlap region in the 1/T1 profiles containing 1/T1 that was greater-than-normal with a saline injection and was significantly reduced with a MB injection. Only retinal regions satisfying these two criteria were presented as significant in the QUEST MRI figures. For clarity, regions not satisfying these two conditions were not indicated on the graphs.
As shown in Figure 1, saline-injected male dark-reared Pde6brd10 mice had outer retinal (56%–88% depth) 1/T1s that were significantly greater (P < 0.05) than in dark-reared wt mice, but on only the superior sides of the retina. Dark-reared male Pde6brd10 mice that were given MB had significantly reduced outer retinal (64%–92% depth) 1/T1 that also localized to the superior retina (Fig. 1). In contrast, no retinal region in dark-reared female Pde6brd10 mice demonstrated a positive QUEST MRI response (i.e., a supernormal 1/T1 that was quenchable) (Fig. 2).
Figure 1.
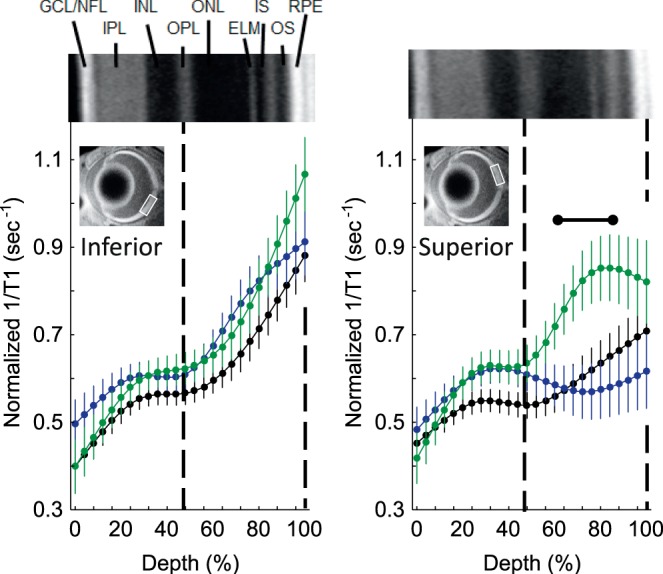
Excessive free radical production in male dark-reared P23 mice retina. Modeling results of normalized 1/T1 MRI profiles in vivo for central retina on either the inferior (left) or superior (right) side (indicated by the box in the MRI insert of each graph; see Methods for details) for the following groups: dark-reared P23 wt group (black, n = 7), dark-reared P23 Pde6brd10 mice injected with saline (green, n = 5), and dark-reared P23 Pde6brd10 mice injected with MB (blue, n = 7). Representative dark-reared P23 Pde6brd10 mice OCT image (above profiles) illustrates laminar spacing (OCTs are not different between groups; Fig. 4); layer assignments (GCL, ganglion cell layer; INL, inner nuclear layer; IPL, inner plexiform layer; IS, rod inner segment layer; OLM, outer limiting membrane; ONL, outer nuclear layer; OPL, outer plexiform layer; OS, rod outer segment layer) are as previously published.44 Dashed vertical lines map OPL and retina-choroid boundary onto MRI profiles (below). Range bar: region showing a significant (P < 0.05) positive QUEST MRI response, indicative of oxidative stress (i.e., 1/T1 that is greater-than-normal with a saline injection and significantly reduced with a MB injection). Each 1/T1 data set was normalized to its TR 150-millisecond image (“Normalized 1/T1”; Methods section).
Figure 2.
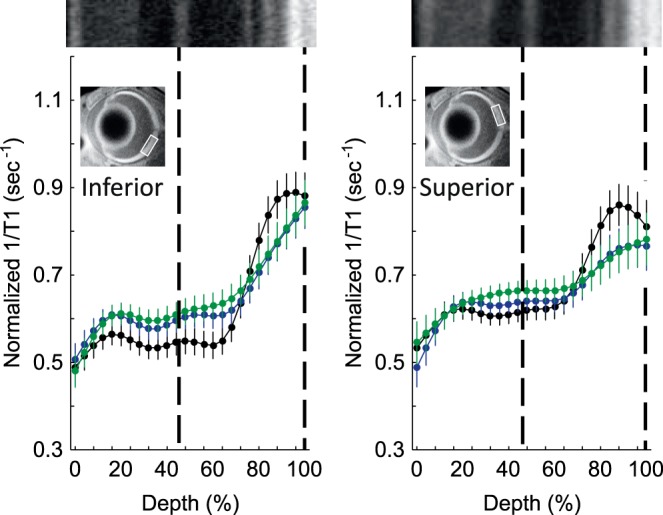
No excessive free radical production in female dark-reared P23 mice retina. Modeling results of normalized 1/T1 MRI profiles in vivo for central retina on either the inferior (left) or superior (right) side (indicated by the box in the MRI insert of each graph; see Methods for details) for the following groups: dark-reared P23 wt group (black, n = 5), dark-reared P23 Pde6brd10 mice injected with saline (green, n = 8), and dark-reared P23 Pde6brd10 mice injected with MB (blue, n = 6). Other figure conventions are detailed in Figure 1.
Retinal Superoxide Production at P23
Compared to wt mice, only dark-reared male Pde6brd10 mice had a significant retinal production of superoxide free radicals (Fig. 3).
Figure 3.
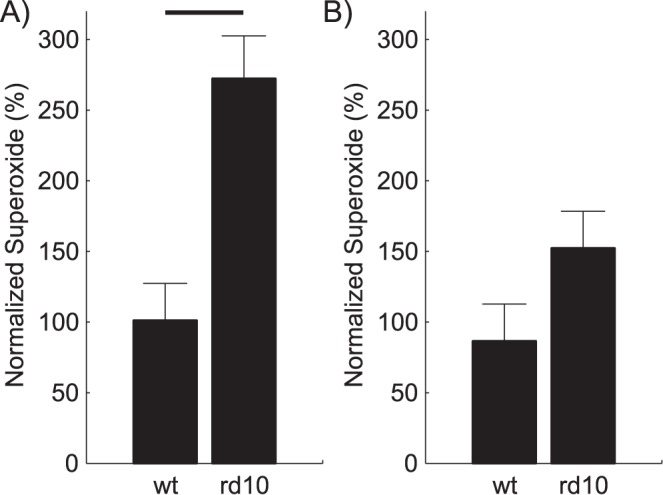
Retinal superoxide production in dark-reared P23 mice. Modeling results of superoxide production (normalized to same day data [unpublished data] from 2-month-old wt mice) from wt or Pde6brd10 (A) male (n = 3 and 5, respectively) or (B) female (n = 3 and 6, respectively) mice. Black bar = significant difference (P < 0.05).
QUEST MRI at P30
In dark-reared male Pde6brd10 mice, no retinal region showed evidence for excessive free radical production, as measured by QUEST MRI (Fig. 4). However, saline-injected female dark-reared Pde6brd10 mice had significantly greater (P < 0.05) 1/T1 values in both the inner and outer retina (16%–80% and 96%–100% depths, respectively) compared to those of dark-reared wt female mice, but on only the superior side of the retina. Methylene blue reduced the inner and outer retinal (28%–64% depth) 1/T1 significantly (P < 0.05), also on only the superior side of dark-reared female Pde6brd10 mice.
Figure 4.
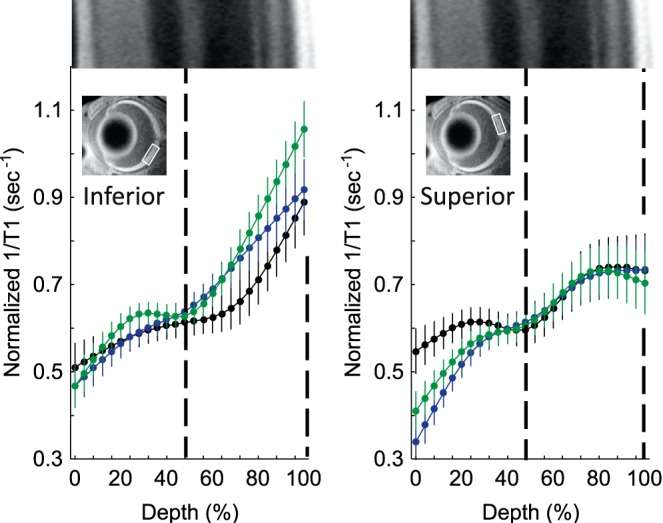
No excessive free radical production in male dark-reared P30 mice retina. Modeling results of normalized 1/T1 MRI profiles in vivo for central retina on either the inferior (left) or superior (right) side (indicated by the box in the MRI insert of each graph; see Methods for details) for the following groups: dark-reared P30 wt group (black, n = 5), dark-reared P30 Pde6brd10 mice injected with saline (green, n = 5), and dark-reared P30 Pde6brd10 mice injected with MB (blue, n = 6). Other figure conventions are detailed in Figure 1.
Retinal Anatomy at P23 and P30
The OCT images were sampled from a small number of mice in each group and used to spatially calibrate the QUEST MRI in Figures 1, 2, 4, and 5. The OCT data illustrates the presence of all retinal layers at both P23 and P30 timepoints, but such limited sampling was insufficient to draw conclusions about retinal thickness. Instead, we measured whole retinal thickness on inferior and superior sides by using a previously validated MRI method.30,31 As expected from the literature, no evidence for retinal thinning was noted in dark-reared male or female Pde6brd10 retina at P23, whereas both groups exhibited modest retinal thinning by P30.21,22,24,25
Figure 5.
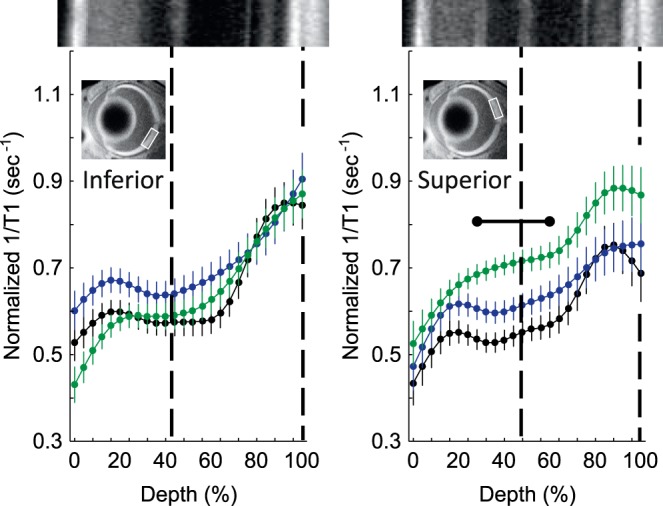
Excessive free radical production in female dark-reared P30 mice retina. Modeling results of normalized 1/T1 MRI profiles in vivo for central retina on either the inferior (left) or superior (right) side (indicated by the box in the MRI insert of each graph; see Methods for details) for the following groups: dark-reared P30 wt group (black, n = 6), dark-reared P30 Pde6brd10 mice injected with saline (green, n = 6), and dark-reared P30 Pde6brd10 mice injected with MB (blue, n = 5). Other figure conventions are detailed in Figure 1.
Discussion
In this study, we confirmed an important but untested hypothesis in the field: retinal oxidative stress occurs in the absence of light in vivo in the Pde6brd10 model of RP. In addition, we also found that male and female Pde6brd10 mice underwent similar extents of outer retinal atrophy by P30, but with surprisingly distinct spatial oxidative stress patterns and time courses. These observations highlight QUEST MRI as a powerful in vivo tool for spatially mapping snapshots of an oxidative stress biomarker. Here, only 2 timepoints were examined and they were insufficient for determining when the occurrence of oxidative stress in male and female switched and if oxidative stress occurred before the appearance of retinal degeneration in male and female Pde6brd10 mice. Nonetheless, these novel results set the stage for future intervention studies to address such mechanistic questions.
The present results raise the possibility that different mechanisms underlie the generation of oxidative stress in male and female Pde6brd10 mice. One mechanism may involve microglia, resident retinal macrophages, which target the nuclear layer and have been implicated in photoreceptor degeneration in experimental RP.32,33 A drug that suppresses microglia activation also inhibits photoreceptor atrophy in Pde6brd10 mice.33 Intriguingly, uniocular damage activates retinal microglia in the contralateral eye.34 Based on this observation, we speculate that the superior retina oxidative stress observed in this study might activate microglia in inferior retina that in turn contributes to the overall retinal thinning observed at P30 (Fig. 6).
Another potential mechanism may be the presence of an abnormal phototransduction protein that could generate oxidative stress even in darkness. In this case, the close spatial and biochemical interactions between the endoplasmic reticulum (ER) and mitochondria within the inner segment layer may result in excessive production of free radicals.35 Processing of mutant proteins can generate ER stress, a pathologic condition that is linked to photoreceptor atrophy in Pde6brd1 mice.9,36–38
It is possible that a combination of both of the above mechanisms contributes to the different spatial maps of oxidative stress in male and female Pde6brd1 mice. Male Pde6brd10 mice show evidence for oxidative stress localized to the outer nuclear layer and inner segment (Fig. 1), whereas in female Pde6brd10 mice, the indication of oxidative stress is in inner and outer nuclear layers (Fig. 4). Based on these maps, we speculate that in male mice, outer retinal oxidative stress might involve mitochondrial and ER stress in the inner segment layer and activated microglia-induced oxidation of DNA in the outer nuclear layer. In female mice, activated microglia-induced oxidation of DNA may occur in the inner and outer nuclear layers.39 More studies are needed to test these possibilities.
Methylene blue was chosen for the present study as both a practical decision to minimize the number of systemic injections administered to the young, small mice on the day of the experiment, and because MB can suppress superoxide production from mitochondria by accepting electrons from NADH and transferring them to cytochrome c; MB is also reported to have other effects.20 Methylene blue does not act as a typical antioxidant, such as α-lipoic acid, which neutralizes the excessive production of free radicals.15 Thus, it is possible that the present results may underestimate the level of excessive free radicals produced in the dark-reared mice. In preliminary studies in our lab using sodium iodate-treated wt mice, we noted a spatially more limited QUEST MRI response with MB than that of α-lipoic acid (unpublished data). Nonetheless, the positive QUEST MRI responses in male and female mice herein supports its use.
Based on results in this study and the literature, we feel that QUEST MRI has been sufficiently validated to be a stand-alone assay of retinal oxidative stress. Its accuracy and precision have been confirmed in the xanthine-xanthine oxidase reaction ex vivo and against ex vivo assays in several different models of neuronal oxidative stress.12,13,15,16,40 Also, the underlying physics behind QUEST MRI that a continuous net production of free radicals (i.e., oxidative stress) generates a robust and detectable T1 contrast mechanism is consistent with inherently paramagnetic free radicals shortening the lifetime (i.e., T1) of water protons, causing 1/T1 to increase linearly based on the concentration of the paramagnetic agent.41 Thus, QUEST MRI is a powerful translation-ready tool for studying neuronal oxidative stress in vivo without having to inject a contrast agent in experimental RP models and in other neurodegenerative models.12,15,16,40
Conclusions
In summary, we show for the first time that rod photoreceptor oxidative stress is apparent in dark-reared male and female Pde6brd10 mice. Future QUEST MRI studies are planned to evaluate additional timepoints in male and female dark-reared Pde6brd10 mice, as well as the efficacy of novel treatments against oxidative stress and activated microglia in order to improve survival of photoreceptors in RP models.42,43 The present results represent a first step in the development of a clinically viable tool for measuring the efficacy of antioxidant therapy in patients.
Acknowledgments
Supported by the National Eye Institute (RO1 EY026584, R01 AG058171; BAB), National Eye Institute Core Grant P30 EY04068, an unrestricted grant from Research to Prevent Blindness (Kresge Eye Institute; BAB), and the Undergraduate Research and Creative Projects Award of Wayne State University's Undergraduate Research Opportunities Program (KD).
Disclosure: B.A. Berkowitz, None; R.H. Podolsky, None; A.M. Berri, None; K. Dernay, None; E. Graffice, None; F. Shafie-Khorassani, None; R. Roberts, None
References
- 1. Rohrer B, Pinto FR, Hulse KE, Lohr HR, Zhang L, Almeida JS. . Multidestructive pathways triggered in photoreceptor cell death of the RD mouse as determined through gene expression profiling. J Biol Chem. 2004; 279: 41903– 41910. [DOI] [PubMed] [Google Scholar]
- 2. Sanz MM, Johnson LE, Ahuja S, Ekstrom PA, Romero J, van Veen T. . Significant photoreceptor rescue by treatment with a combination of antioxidants in an animal model for retinal degeneration. Neuroscience. 2007; 145: 1120– 1129. [DOI] [PubMed] [Google Scholar]
- 3. Campochiaro PA, Strauss RW, Lu L,et al. Is there excess oxidative stress and damage in eyes of patients with retinitis pigmentosa? Antioxid Redox Signal. 2015; 23: 643– 648. [DOI] [PMC free article] [PubMed] [Google Scholar]
- 4. Galbinur T, Obolensky A, Berenshtein E,et al. Effect of para-aminobenzoic acid on the course of retinal degeneration in the rd10 mouse. J Ocul Pharmacol Ther. 2009; 25: 475– 482. [DOI] [PubMed] [Google Scholar]
- 5. Zeng H, Ding M, Chen XX, Lu Q. . Microglial NADPH oxidase activation mediates rod cell death in the retinal degeneration in rd mice. Neuroscience. 2014; 275: 54– 61. [DOI] [PubMed] [Google Scholar]
- 6. Oveson BC, Iwase T, Hackett SF,et al. Constituents of bile, bilirubin and TUDCA, protect against oxidative stress-induced retinal degeneration. J Neurochem. 2011; 116: 144– 153. [DOI] [PMC free article] [PubMed] [Google Scholar]
- 7. Roddy GW, Rosa RH Jr, Oh JY,et al. Stanniocalcin-1 rescued photoreceptor degeneration in two rat models of inherited retinal degeneration. Mol Ther. 2012; 20: 788– 797. [DOI] [PMC free article] [PubMed] [Google Scholar]
- 8. Fukuda S, Ohneda O, Oshika T. . Oxidative stress retards vascular development before neural degeneration occurs in retinal degeneration rd1 mice. Graefes Arch Clin Exp Ophthalmol. 2014; 252: 411– 416. [DOI] [PubMed] [Google Scholar]
- 9. Kang K, Tarchick MJ, Yu X, Beight C, Bu P, Yu M. . Carnosic acid slows photoreceptor degeneration in the Pde6b(rd10) mouse model of retinitis pigmentosa. Sci Rep. 2016; 6: 22632. [DOI] [PMC free article] [PubMed] [Google Scholar]
- 10. Sacchetti M, Mantelli F, Merlo D, Lambiase A. . Systematic review of randomized clinical trials on safety and efficacy of pharmacological and nonpharmacological treatments for retinitis pigmentosa. J Ophthalmol. 2015; 2015: 737053. [DOI] [PMC free article] [PubMed] [Google Scholar]
- 11. Usui S, Oveson BC, Iwase T,et al. Overexpression of SOD in retina: need for increase in H2O2-detoxifying enzyme in same cellular compartment. Free Radic Biol Med. 2011; 51: 1347– 1354. [DOI] [PMC free article] [PubMed] [Google Scholar]
- 12. Berkowitz BA, Lewin AS, Biswal MR, Bredell BX, Davis C, Roberts R. . MRI of retinal free radical production with laminar resolution in vivo. Invest Ophthalmol Vis Sci. 2016; 57: 577– 585. [DOI] [PMC free article] [PubMed] [Google Scholar]
- 13. Berkowitz BA, Bredell BX, Davis C, Samardzija M, Grimm C, Roberts R. . Measuring in vivo free radical production by the outer retina. Invest Ophthalmol Vis Sci. 2015; 56: 7931– 7938. [DOI] [PMC free article] [PubMed] [Google Scholar]
- 14. Stinnett G, Moore K, Samuel E,et al. A novel assay for the in vivo detection of reactive oxygen species using MRI (E-Abstract 1917). : ISMRM Meeting Abstracts 23rd Annual Meeting & Exhibition. Toronto, Canada; 2015. [Google Scholar]
- 15. Berkowitz BA, Podolsky RH, Lenning J,et al. Sodium iodate produces a strain-dependent retinal oxidative stress response measured in vivo using QUEST MRI. Invest Ophthalmol Vis Sci. 2017; 58: 3286– 3293. [DOI] [PMC free article] [PubMed] [Google Scholar]
- 16. Berkowitz BA, Lenning J, Khetarpal N,et al. In vivo imaging of prodromal hippocampus CA1 subfield oxidative stress in models of Alzheimer disease and Angelman syndrome. FASEB J. 2017; 31: 4179– 4186. [DOI] [PMC free article] [PubMed] [Google Scholar]
- 17. Poteet E, Winters A, Yan L-J,et al. Neuroprotective Actions of Methylene Blue and Its Derivatives. PLoS One. 2012; 7: e48279. [DOI] [PMC free article] [PubMed] [Google Scholar]
- 18. Riha PD, Bruchey AK, Echevarria DJ, Gonzalez-Lima F. . Memory facilitation by methylene blue: dose-dependent effect on behavior and brain oxygen consumption. Eur J Pharmacol. 2005; 511: 151– 158. [DOI] [PubMed] [Google Scholar]
- 19. Wen Y, Li W, Poteet EC,et al. Alternative mitochondrial electron transfer as a novel strategy for neuroprotection. J Biol Chem. 2011; 286: 16504– 16515. [DOI] [PMC free article] [PubMed] [Google Scholar]
- 20. Oz M, Lorke DE, Hasan M, Petroianu GA. . Cellular and molecular actions of methylene blue in the nervous system. Med Res Rev. 2011; 31: 93– 117. [DOI] [PMC free article] [PubMed] [Google Scholar]
- 21. Chang B, Hawes NL, Pardue MT,et al. Two mouse retinal degenerations caused by missense mutations in the beta-subunit of rod cGMP phosphodiesterase gene. Vision Res. 2007; 47: 624– 633. [DOI] [PMC free article] [PubMed] [Google Scholar]
- 22. Cronin T, Lyubarsky A, Bennett J. . Dark-rearing the rd10 mouse: implications for therapy. Adv Exp Med Biol. 2012; 723: 129– 136. [DOI] [PMC free article] [PubMed] [Google Scholar]
- 23. Pang JJ, Boye SL, Kumar A,et al. AAV-mediated gene therapy for retinal degeneration in the rd10 mouse containing a recessive PDEbeta mutation. Invest Ophthalmol Vis Sci. 2008; 49: 4278– 4283. [DOI] [PMC free article] [PubMed] [Google Scholar]
- 24. Dong E, Bachleda A, Xiong Y, Osawa S, Weiss ER. . Reduced phosphoCREB in Müller glia during retinal degeneration in rd10 mice. Mol Vis. 2017; 23: 90– 102. [PMC free article] [PubMed] [Google Scholar]
- 25. Guo C, Otani A, Oishi A,et al. Knockout of ccr2 alleviates photoreceptor cell death in a model of retinitis pigmentosa. Exp Eye Res. 2012; 104: 39– 47. [DOI] [PubMed] [Google Scholar]
- 26. Berkowitz BA, Bissig D, Roberts R. . MRI of rod cell compartment-specific function in disease and treatment in-vivo. Prog Retin Eye Res. 2016; 51: 90– 106. [DOI] [PMC free article] [PubMed] [Google Scholar]
- 27. Haacke EM, Brown RW, Thompson MR, Venkatesan R. . Magnetic Resonance Imaging: Physical Principles and Sequence Design. New York, NY: Wiley; 1999. [Google Scholar]
- 28. Bissig D, Berkowitz BA. . Same-session functional assessment of rat retina and brain with manganese-enhanced MRI. Neuroimage. 2011; 58: 749– 760. [DOI] [PMC free article] [PubMed] [Google Scholar]
- 29. Cheng H, Nair G, Walker TA,et al. Structural and functional MRI reveals multiple retinal layers. Proc Natl Acad Sci U S A. 2006; 103: 17525– 17530. [DOI] [PMC free article] [PubMed] [Google Scholar]
- 30. Berkowitz BA, Grady EM, Roberts R. . Confirming a prediction of the calcium hypothesis of photoreceptor aging in mice. Neurobiol Aging. 2014; 35: 1883– 1891. [DOI] [PubMed] [Google Scholar]
- 31. Berkowitz BA, Grady EM, Khetarpal N, Patel A, Roberts R. . Oxidative stress and light-evoked responses of the posterior segment in a mouse model of diabetic retinopathy. Invest Ophthalmol Vis Sci. 2015; 56: 606– 615. [DOI] [PMC free article] [PubMed] [Google Scholar]
- 32. Zhao L, Zabel MK, Wang X,et al. Microglial phagocytosis of living photoreceptors contributes to inherited retinal degeneration. EMBO Mol Med. 2015; 7: 1179– 1197. [DOI] [PMC free article] [PubMed] [Google Scholar]
- 33. Roche SL, Wyse-Jackson AC, Gomez-Vicente V,et al. Progesterone attenuates microglial-driven retinal degeneration and stimulates protective fractalkine-CX3CR1 signaling. PLoS One. 2016; 11: e0165197. [DOI] [PMC free article] [PubMed] [Google Scholar]
- 34. Rojas B, Gallego BI, Ramírez AI,et al. Microglia in mouse retina contralateral to experimental glaucoma exhibit multiple signs of activation in all retinal layers. J Neuroinflammation. 2014; 11: 133. [DOI] [PMC free article] [PubMed] [Google Scholar]
- 35. Malhotra JD, Kaufman RJ. . Endoplasmic reticulum stress and oxidative stress: a vicious cycle or a double-edged sword? Antioxid Redox Signal. 2007; 9: 2277– 2293. [DOI] [PubMed] [Google Scholar]
- 36. Lin JH, LaVail MM. . Misfolded proteins and retinal dystrophies. Adv Exp Med Biol. 2010; 664: 115– 121. [DOI] [PMC free article] [PubMed] [Google Scholar]
- 37. Chiang WC, Kroeger H, Sakami S,et al. Robust endoplasmic reticulum-associated degradation of rhodopsin precedes retinal degeneration. Mol Neurobiol. 2015; 52: 679– 695. [DOI] [PMC free article] [PubMed] [Google Scholar]
- 38. Yang LP, Wu LM, Guo XJ, Tso MO. . Activation of endoplasmic reticulum stress in degenerating photoreceptors of the rd1 mouse. Invest Ophthalmol Vis Sci. 2007; 48: 5191– 5198. [DOI] [PubMed] [Google Scholar]
- 39. Murakami Y, Ikeda Y, Yoshida N,et al. MutT homolog-1 attenuates oxidative DNA damage and delays photoreceptor cell death in inherited retinal degeneration. Am J Pathol. 2012; 181: 1378– 1386. [DOI] [PubMed] [Google Scholar]
- 40. Berkowitz BA, Bredell BX, Davis C, Samardzija M, Grimm C, Roberts R. . Measuring in vivo free radical production by the outer retina. Invest Ophthalmol Vis Sci. 2015; 56: 7931– 7938. [DOI] [PMC free article] [PubMed] [Google Scholar]
- 41. Matsumoto K, Hyodo F, Matsumoto A,et al. High-resolution mapping of tumor redox status by magnetic resonance imaging using nitroxides as redox-sensitive contrast agents. Clin Cancer Res. 2006; 12: 2455– 2462. [DOI] [PubMed] [Google Scholar]
- 42. Byrne AM, Roche SL, Ruiz-Lopez AM, Jackson ACW, Cotter TG. . The synthetic progestin norgestrel acts to increase LIF levels in the rd10 mouse model of retinitis pigmentosa. Mol Vis. 2016; 22: 264– 274. [PMC free article] [PubMed] [Google Scholar]
- 43. Doonan F, O'Driscoll C, Kenna P, Cotter TG. . Enhancing survival of photoreceptor cells in vivo using the synthetic progestin Norgestrel. J Neurochem. 2011; 118: 915– 927. [DOI] [PubMed] [Google Scholar]
- 44. Berkowitz BA, Schmidt T, Podolsky RH, Roberts R. . Melanopsin phototransduction contributes to light-evoked choroidal expansion and rod L-type calcium channel function in vivo. Invest Ophthalmol Vis Sci. 2016; 57: 5314– 5319. [DOI] [PMC free article] [PubMed] [Google Scholar]


