Abstract
Purpose
To determine the true distribution of radiopaque beads (ROB) following hepatic embolization in swine as imaged by microCT compared to in vivo cone-beam computed tomography (CBCT) imaged at different kVp settings.
Materials & Methods
Swine (n=3) underwent hepatic transarterial embolization (n=6) using 70-150 μm ROBs under fluoroscopic guidance. After stasis, in vivo CBCT was performed at 120, 100 and 80 kVp. The animal was euthanized, the liver resected and microCT was performed on embolized tissue samples with 17 μm resolution. The resulting CBCT and microCT data were segmented and registered. Total vessel length, minimum volume enclosing ellipsoid (MVEE) and number of independent volumes were measured. Maximum Intensity Projections (MIP) were generated for each CBCT.
Results
Metrics for all CBCT segmentations differed significantly from microCT segmentations. 80 kVp segmentations presented significantly greater vessel length, MVEE, and number of independent volumes compared to 120 and 100 kVp segmentations. Additionally, 100 kVp presented significantly greater vessel length than 120 kVp segmentations. MIPs presented greater visualization than CBCT segmentations and improved as kVp decreased.
Conclusions
The full ROB distribution is more extensive than is apparent on CBCT. Quantitative measures of embolic distribution demonstrated significantly better correlation to microCT with decreasing kVp. Similarly, qualitative analysis of MIPs showed improved visualization of beads with decreasing kVp. These findings demonstrate the clinical value of 100 and 80 kVp protocols in the imaging of radiopaque embolizations compared to 120 kVp. However, considerations on X-ray penetration and dose may favor use of 100 kVp imaging over 80 kVp.
Introduction
Microparticle embolic therapies have been developed over the past 30 years that may deliver drugs and/or restrict blood flow, such as transarterial chemoembolization and drug-eluting bead transcatheter arterial chemoembolization. These particles are administered under the guidance of angiography and cone-beam computed tomography (CBCT), with the rate and distribution of contrast flow providing procedural feedback [1, 2]. Particulate embolization endpoints are defined by slowing of liquid contrast. Embolization results are monitored without exact knowledge of the embolic location or distribution [3-6]. Recently, radiopaque beads (ROB) have been developed for embolization. Unlike traditional embolic microparticles, ROBs have iodine bound within their structure, which allows for real-time visualization of spatial distribution under standard clinical imaging [3, 5, 7-9]. This information has the potential to better define procedural endpoints, predict localized drug delivery and provide a higher level of patient specific treatment [3, 4, 7, 8, 10].
Imaging systems are also an important consideration during ROB embolizations [1, 2, 11]. Angiography provides clinicians with real-time imaging of blood flow and ROB distribution, while CBCT provides 3D imaging of the liver, tumor, hepatic vasculature and ROB localization to further inform therapeutic delivery [11, 12]. Although speculative, this information is potentially valuable to clinicians, however since the dimensions of currently available ROBs are small compared to the spatial resolution of CBCT (<300 μm diameter beads vs. isotropic voxel dimensions of 656 μm) it is not possible to visualize with clinical CBCT individual beads and very small vessels or, therefore, the full distribution of ROBs [1, 8].
The goal of this study was to compare ROB distribution as imaged with CBCT using different imaging protocols, to the full ROB extent, or true distribution, as imaged with microCT serving as a control. This information could potentially aid clinicians in the interpretation of procedural imaging and better inform procedural decision-making by demonstrating the differences between clinical visualization of embolic distribution and the true distribution of the ROB. Collectively, this information could better inform clinical understanding of spatial distribution and reduce the risk of undertreatment or nontarget embolization. Previous work has demonstrated the effects of CBCT scan parameters on image quality and patient exposure [13-15]. This study investigated the effect of different CBCT peak kilovoltage (kVp) settings on ROB conspicuity. We hypothesized that the visualization of bead geometry and distribution would approach that of the true distribution (imaged with microCT) as kVp is decreased, approaching the K-edge of iodine (33.2 keV). Therefore, in vivo and ex vivo imaging of ROB embolizations were performed and compared across different imaging modalities and settings.
Materials & Methods
Hepatic Transarterial Embolization and In Vivo Imaging
All procedures were performed under a protocol approved by the Institutional Animal Care and Use Committee using three healthy castrated male Yorkshire domestic swine, ranging in weight from 57 to 67 kg. Swine were sedated with intramuscular ketamine (25mg/kg), midazolam (0.5mg/kg), and glycopyrrolate (0.01mg/kg) and anesthetized with propofol (1mg/kg IV). Animals were intubated and maintained under general anesthesia with isoflurane throughout the procedure. The femoral artery was exposed and a 6-F vascular sheath was placed. A 4-F or 5-F angiographic catheter was advanced into the hepatic artery and a 2.8-F microcatheter was used to selectively catheterize lobar arteries with fluoroscopic guidance and angiography (Allura Xper FD-20; Philips, Best, The Netherlands).
Prior to administration, 70-150 μm ROBs (LC Bead LUMI® 70-150 μm; BiocompatiblesUK Ltd, a BTG group company, Farnham, United Kingdom) were mixed with Visipaque 320 contrast at a ratio of 1:9 v:v dilution. The suspension was agitated and mixed throughout the procedure to maintain uniformity and to prevent clumping or clogging. Beads were delivered slowly, over an average procedure time of 30 minutes, to avoid reflux or early stasis. Stasis was the primary procedural endpoint. Embolization was performed in up to three distinct lobes of the liver, chosen to ensure that each embolization was independent of the others, for a total of six embolizations across the three swine. Following a delay to allow washout of contrast (mean 71 ± 37 min) CBCT was performed at 120 kVp, 100 kVp and 80 kVp with a spatial resolution of 0.656 mm. Maximum Intensity Projections (MIP) were generated for each energy level with a slab thickness of 40mm.
Sample Collection
The animal was euthanized at the end of the procedure. The liver was then resected, and embolized regions were identified and isolated under fluoroscopic guidance. Specimens were cut to fit within the 68 mm diameter bore of the ex vivo MicroCT scanner. The embolized tissues were fixed in formalin and stored at 4 °C, prior to ex vivo imaging. The single tissue specimen collected for each embolized artery represented an independent sample.
Ex Vivo Imaging
Embolized tissue samples were imaged using microCT (SkyScan 1176, Bruker, Kontich, Belgium), a non-clinical research system, at a pixel size of 17.49 mm, 80 kVp, and 300 mA. This pixel size was well below the size of any individual bead. Tomography projections were then reconstructed as cross sectional images with Bruker NRecon (Bruker, Kontich, Belgium) software and converted to DICOM format with Bruker SkyScan DICOM Converter software (Bruker, Kontich, Belgium).
Image Segmentation
CBCT and microCT data sets were imported into Mimics 19.0 (Materialise, Leuven, Belguim) and segmented by intensity-based thresholding. The threshold was manually selected for each sample such that maximum vascular distribution was visualized without including non-vascular tissue. A volume filter was uniformly applied to each segmentation to delete any independent volume smaller than the volume of a 70 μm bead (3-Matic 11.0; Materialise, Leuven, Belgium). MicroCT segmentations were registered to CBCT segmentations using a rigid point registration with bifurcations serving as landmarks. Bifurcations were selected as registration landmarks because they were conserved in in vivo and ex vivo imaging, despite differences in geometry due to changes in sample shape following excision, fixation and orientation during imaging. This registration minimized geometric differences due to differences in in vivo and ex vivo orientation for each sample. The CBCT segmentations were then cropped to remove any excess bead volume beyond the boundaries of sample imaged using microCT (Figure 1).
Figure 1.
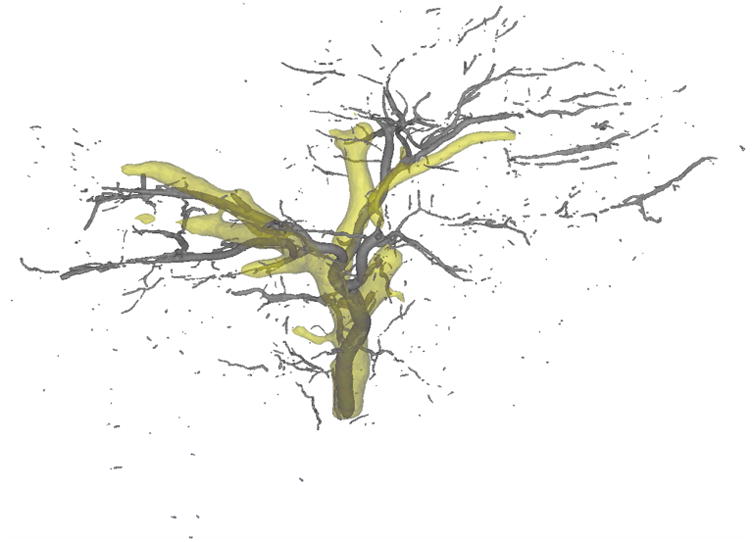
Representative registration of 100 kVp CBCT bead segmentation (yellow) and microCT bead segmentation (gray) following image analysis and volume filtration.
Geometric Analysis
Geometric analysis was performed on each segmentation to quantify the ROB distribution seen on CBCT segmentation and relate it to the corresponding microCT segmentation. Centerlines were generated for each independent volume within the segmentation in Mimics, using constant reconstruction parameters. These centerlines were then exported, and analyzed using Matlab R2014b (Mathworks, Natick, MA). The total amount of visualized vasculature was quantified by measuring the total centerline length for each segmentation. Spatial distribution was quantified based on the spread of ROBs throughout the tissue. This spread was characterized by determining the minimum volume that fully captured the ROB centerline distribution. For this purpose, a minimum volume enclosing ellipsoid (MVEE) measurement was determined, based on a previously defined algorithm that has been used as a reproducible measure of anatomical geometry [16-19]. The number of independent volumes that constitute each segmentation was also recorded as a measure of the ability of each protocol to distinguish small vessels, individual beads or collections of beads.
Statistical Analysis
CBCT segmentation measurements were expressed as a fraction of those for the corresponding microCT for MVEE, total path length and number of independent volumes. All measurements are expressed as mean ± SD. Student's t-test was used to determine significance defined as a p<0.05.
Results
Visualization of Embolic Distribution
Differences in observed ROB distribution were found between CBCT data using different kVp settings and these differences were greater when comparing CBCT to microCT (Figure 2). All pathlength and MVEE values based on CBCT segmentations were significantly lower than those determined by microCT (Table 1). For example, CBCT path length at 80 kVp was 12.0 ± 5.8% (p<0.001) of the microCT pathlength. When comparing CBCT path length between the different kVp settings evaluated, significant differences were found between 80 kVp segmentations and both the 120 (p<0.01) and 100 kVp (p<0.05) segmentations. A difference was also noted between the 100 kVp and 120 kVp segmentation path lengths (p<0.05).
Figure 2.
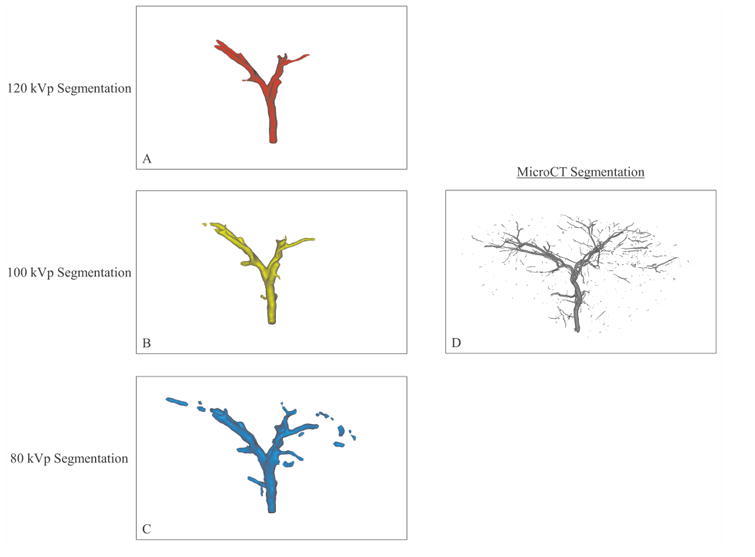
Segmentation of imaging volumes with CBCT at 120 kVp (A), 100 kVp (B) and 80 kVp (C) and microCT (D). The microCT segmentation shows more extensive ROB distribution than the CBCT segmentations. Among the CBCT segmentations, visualization of distal vasculature improved as kVp decreased.
Table 1.
Comparison of path length, MVEE and number of independent volumes expressed as a percentage of microCT values.
| 120 kVp | 100 kVp | 80 kVp | |
|---|---|---|---|
| % MicroCT Path Length | 6.0 ± 2.6**††‡ | 7.4 ± 3.1**† | 12.0 ± 5.8** |
| % MicroCT MVEE | 19.4 ± 13**†† | 24.3 ± 16**†† | 48.3 ± 21 * |
| % Independent Volumes | 0.6 ± 0.4**††† | 0.7 ± 0.3**††† | 1.9 ± 0.3** |
Denotes a significant difference in CBCT versus microCT at p<0.01,
p<0.001.
Denotes a significant difference in CBCT versus 80 kVp at p<0.05,
p<0.01,
p<0.001.
Denotes a significant difference between CBCT at 120 kVp versus 100 kVp at p<0.05.
Similar trends in visualization were noted for MVEE measurements (Figure 3). A significant difference in MVEE was found between the 80 kVp segmentation and both the 120 (p<0.01) and 100 kVp (p<0.01) segmentations. No significant difference was observed between the 120 and 100 kVp segmentations.
Figure 3.
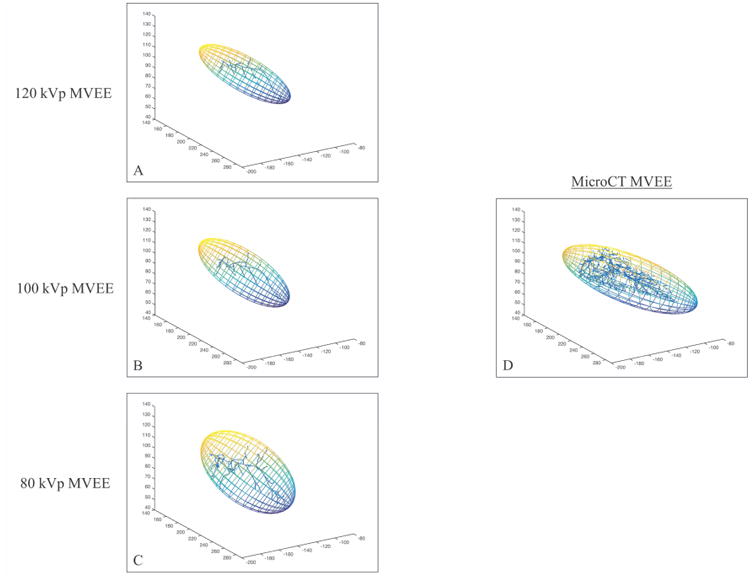
MVEE results of one embolization imaged CBCT at 120 kVp (A), 100 kVp (B) and 80 kVp (C) and microCT (D). The MicroCT segmentation yielded the largest MVEE, while the MVEE for CBCT segmentations increased as kVp decreased. CBCT images were performed in vivo, while MicroCT imaging was performed ex vivo resulting in differences in sample configuration.
Differences in the ability of modalities to resolve small volumes were also noted (Table 1). All CBCT segmentations were comprised of significantly fewer numbers of independent volumes compared to microCT (p<0.001). When comparing the number of independent volumes visualized by CBCT between the different kVp settings evaluated, a significant difference in the number of independent volumes was observed between 80 kVp segmentations and both the 120 (p<0.001) and 100 kVp CBCT segmentations (p<0.001).
Qualitative Assessment of MIP Images
Qualitative analysis of MIP images was in agreement with quantitative analysis with improved visualization of embolized vasculature as image kVp decreased (Figure 4). Additionally, MIPs revealed more detailed vasculature than the corresponding CBCT segmentation (Figure 5). Despite the improvements in embolic visualization using MIP images as kVp decreased to 80 kVp, embolized vasculature was still less well visualized than in microCT segmentations (Figure 5).
Figure 4.
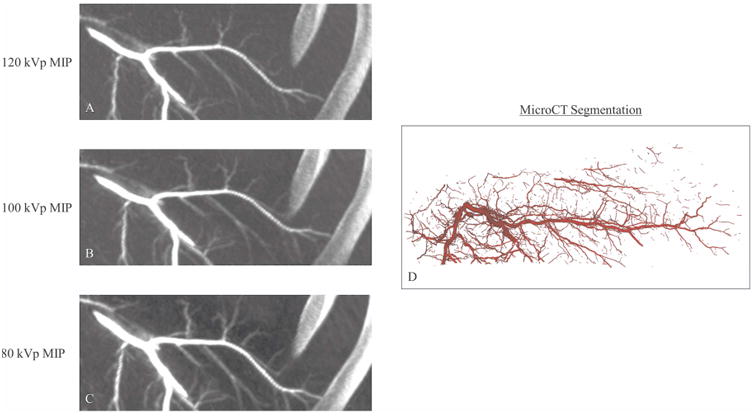
Comparison of MIPs generated from CBCT images acquired at 120 kVp (A), 100 kVp (B) and 80 kVp (C) with the corresponding microCT segmentation (D). Presented MIPs were cropped from the full in vivo image to highlight the area corresponding to the explanted sample. Improved visualization of distal vasculature was noted in MIP images as CBCT kVp decreased.
Figure 5.
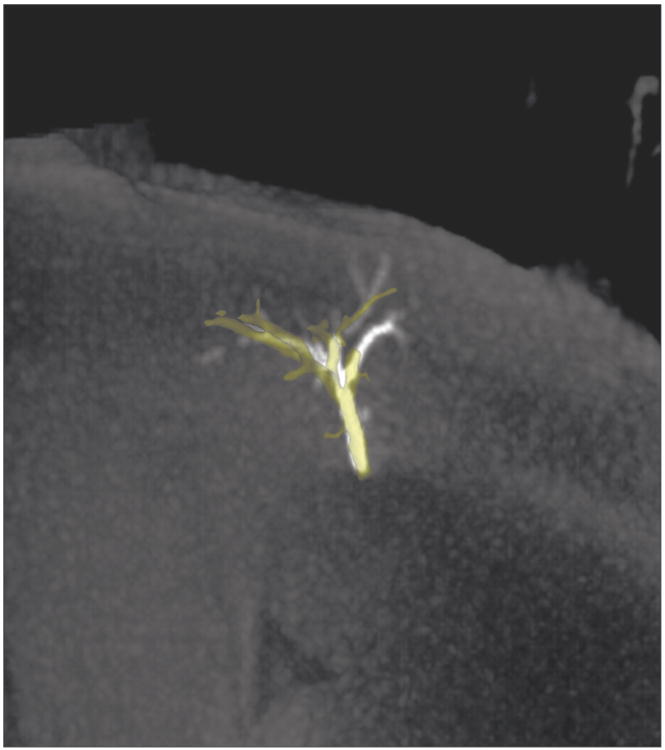
100kVp CBCT (yellow) segmentation and 40 mm slab MIP. Improved visualization of distal vasculature was observed on the MIP versus the CBCT segmentation.
Discussion
The findings demonstrate differences between ROB distribution observed by CBCT and the more extensive bead distribution in the liver as imaged by microCT. CBCT segmentations provided less detailed visualization of bead geometry and distribution compared to MIP imaging and microCT, as expected. In addition, CBCT kVp settings have a significant effect on bead visualization, whereby decreasing kVp corresponds to greater visualization of beads that more closely match the true distribution and geometry in the liver demonstrated with microCT. Although early reports demonstrate potential utility, the exact clinical relevance of such added visualization remains to be defined [8].
Quantitative analysis of ROB distribution using CBCT revealed lower geometric detail compared to microCT, highlighting the potentially important limitations of ROB conspicuity on clinical imaging, particularly with single beads or very small embolized vessels. Collectively, measurements of path length, MVEE and independent volumes reflect embolizations as a whole, based on the beads' radiopacity. Comparison of ROB distribution between clinical in vivo and non-clinical ex vivo imaging may characterize treatment effect and further inform an operator's interpretation of clinical imaging. Not surprisingly, all measurements of path length, MVEE and independent volumes showed a greater distribution of ROBs on microCT compared to what was observed using CBCT, at all kVp settings. When comparing CBCT data to microCT, the 80 kVp imaging protocol provided more accurate measurements relative to 120 and 100 kVp protocols. Additionally, 100 kVp CBCT images provided better quantification of path length than 120 kVp data. Both 100 kVp and 80 kVp imaging offer advantages over 120 kVp. However, the dose area product (DAP) for 80 kVp is more than double that of a 120 kVp CBCT (data on file). In larger subjects, the exposure may be dose limited such that the DAP approaches that of the 100 kVp scan, but with associated degradation of image quality due to lower X-ray penetration. Such considerations of dose and X-ray penetration may favor general use of 100 kVp imaging over 80 kVp for imaging ROB. Nonetheless, “what we see” on CBCT does not exactly match “what we get” on microCT, the significance of which remains unknown. Regardless, CBCT provides a rough approximation in geometry and distribution of ROB.
Qualitative analysis of ROBs using MIPs was in agreement with quantitative findings. MIPs were found to present greater definition and distribution of embolized vasculature compared to CBCT segmentations as kVp decreased. In addition, MIPs presented greater visualization of embolized vasculature than the corresponding CBCT segmentations. Despite this improvement in visualization, it is important to note that MIPs are two dimensional images, and do not provide the same three-dimensional information as CBCT.
There are some limitations associated with this work. Although swine have been consistently used in the modeling of human hepatic vasculature, there are significant differences in the vascular size, distribution and functionality of normal swine liver versus human hypervascular liver tumors. Another limitation of this work was the size restriction of the collected tissue samples for microCT. The embolized tissue had to be isolated from the liver and cut to conform to the dimensions of the microCT scanner, which may have resulted in the loss of embolized vasculature and beads. After explant, the liver assumed a different configuration compared to its in vivo shape which had the potential to affect MVEE measurements or rigid non-elastic registrations. Additionally, there was the potential for contrast retained in the occluded vessels to influence the segmentations. The average wash out period of 71 minutes allowed for the bulk of liquid contrast to washout (data on file). However, it remains theoretically possible that some residual liquid contrast may remain that cannot be distinguished from ROB radiopacity. Steps were taken to minimize this quantitative and qualitative error regarding measures of embolic geometry and distribution. Especially for microCT, the pixel size is small compared to the minimum bead size, and the threshold may be set to include only the radiodense beads, thus excluding lower conspicuity liquid contrast.
In summary, the full extent of ROB distribution is more extensive than is apparent on clinical CBCT. There are also differences in the ability of CBCT protocols to image and predict and accurately reflect ROB distributions. Quantitative and qualitative analysis revealed that an 80 kVp CBCT setting provides significantly better visualization of bead geometry and distribution than the 120 and 100 kVp settings for both CBCT segmentations and MIP images. While both 80 and 100 kVp CBCT show better visualization than 120 kVp imaging, considerations of X-ray penetration and dose may favor use of 100 kVp imaging over 80 kVp [13-15]. Future work may include the evaluation of ROB imaging with multidetector CT, as that clinical modality is a staple in follow-up of patients. The understanding of bead distribution may advance the science underlying embolization by studying bioeffects of different bead sizes, relative efficacy of embolization procedures and drug distribution following embolization with drug eluting beads. Clinical correlations between bead distribution and clinical responses may further inform the value and interpretation of ROB imaging as a potential surrogate biomarker. A broader and more accurate real-time comprehension of the geographic distribution and bioeffects of embolization beads may allow for a more standardized, reproducible or normalized technique. This may enable a more uniform approach for studying and delivering embolization. Such a toolkit could allow for a more complete personalization of image-guided information, as oncology embraces customized, patient-specific tailoring of therapies, including image guided therapies.
Acknowledgments
Andrew Mikhail, PhD, Center for Interventional Oncology, Radiology and Imaging Sciences, Clinical Center, National Institutes of Health, Bethesda, Maryland, USA 20892. Tel.: +1 301-435-8945, andrew.mikhail@nih.gov;
Danielle Donahue, BS, Mouse Imaging Facility, National Institute of Neurological Disorders and Stroke, Clinical Center, National Institutes of Health, Bethesda, Maryland, USA, 20892. Tel.: +1 301-594-3887, donahued@mail.nih.gov;
Disclosure and Conflict of Interest: This work was supported by the Center for Interventional Oncology in the Intramural Research Program of the National Institutes of Health (NIH). NIH has Cooperative Research and Development Agreements with Philips Healthcare and Biocompatibles UK Ltd. Dr. van der Bom, Dr. Radaelli, and Mr. van der Sterren are paid employees of Philips Healthcare. Dr. Lewis is a paid employee of Biocompatibles UK Ltd. NIH may hold intellectual property in the field. The content of this manuscript does not necessarily reflect the views or policies of the Department of Health and Human Services, nor do mention of trade names, commercial products, or organizations imply endorsement by the USA Government. This work was supported by NIH grants This work was supported by NIH grants 1ZIDBC011242 and 1ZIDCL040015.
Footnotes
SIR Annual Scientific Meeting: Results relating to this work was presented at the 2017 SIR Annual Scientific Meeting under the title “Assessment of Radiopaque Bead Volume and Distribution Following Hepatic TACE in Swine: CBCT and MicroCT”.
Publisher's Disclaimer: This is a PDF file of an unedited manuscript that has been accepted for publication. As a service to our customers we are providing this early version of the manuscript. The manuscript will undergo copyediting, typesetting, and review of the resulting proof before it is published in its final citable form. Please note that during the production process errors may be discovered which could affect the content, and all legal disclaimers that apply to the journal pertain.
Contributor Information
John G. Thompson, Center for Interventional Oncology, Radiology and Imaging Sciences, Clinical Center, National Institutes of Health, Bethesda, Maryland 20892, USA. Tel.: +1 301 268 2015.
William van der Sterren, Philips, Image Guided Interventions, Image-Guided Therapy Systems, Philips, Veenpluis 4-6, 5680 DA Best, The Netherlands Tel.: +31 402 793 579.
Ivane Bakhutashvili, Center for Interventional Oncology, Radiology and Imaging Sciences, Clinical Center, National Institutes of Health, Bethesda, Maryland, USA 20892. Tel.: +1 301-526-7589.
Imramsjah van der Bom, Philips, Image Guided Interventions, Clinical Science IGT Systems North & Latin America, Philips, 2 Canal Park, Cambridge, MA 02141, USA. Tel.: +1 508-981-1450.
Alessandro Radaelli, Philips, Image Guided Interventions, Image-Guided Therapy Systems, Philips, Veenpluis 4-6, 5680 DA Best, The Netherlands Tel.: +31 611 364 914.
John Karanian, Center for Interventional Oncology, Radiology and Imaging Sciences, Clinical Center, National Institutes of Health, Bethesda, Maryland, USA 20892. Tel.: +1 301-789-9447.
Juan Esparza-Trujillo, Center for Interventional Oncology, Radiology and Imaging Sciences, Clinical Center, National Institutes of Health, Bethesda, Maryland, USA 20892. Tel.: +1 301-594-2067.
David Woods, Center for Interventional Oncology, Radiology and Imaging Sciences, Clinical Center, National Institutes of Health, Bethesda, Maryland, USA 20892. Tel.: +1 240-441-5098.
Andrew Lewis, Biocompatibles UK Ltd, a BTG International Group Company, Lakeview, Riverside Way, Watchmoor Park, Camberley GU15 3YL, UK. Tel.: +1 44 1276 902 204.
Bradford J. Wood, Center for Interventional Oncology, Radiology and Imaging Sciences, Clinical Center, National Institutes of Health, Bethesda, Maryland, USA 20892. Tel.: +1 301 496 7739.
References
- 1.Bapst B, Lagadec M, Breguet R, Vilgrain V, Ronot M. Cone Beam Computed Tomography (CBCT) in the Field of Interventional Oncology of the Liver. Cardiovasc Interv Radiol. 2016;39:8–20. doi: 10.1007/s00270-015-1180-6. [DOI] [PubMed] [Google Scholar]
- 2.Tacher V, Radaelli A, Lin M, Geschwind JF. How I Do It: Cone-Beam CT during Transarterial Chemoembolization for Liver Cancer. Radiology. 2015;274:320–34. doi: 10.1148/radiol.14131925. [DOI] [PMC free article] [PubMed] [Google Scholar]
- 3.Duran R, Sharma K, Dreher MR, et al. A Novel Inherently Radiopaque Bead for Transarterial Embolization to Treat Liver Cancer - A Pre-clinical Study. Theranostics. 2016;6:28–39. doi: 10.7150/thno.13137. [DOI] [PMC free article] [PubMed] [Google Scholar]
- 4.Tacher V, Duran R, Lin MD, et al. Multimodality Imaging of Ethiodized Oil-loaded Radiopaque Microspheres during Transarterial Embolization of Rabbits with VX2 Liver Tumors. Radiology. 2016;279:741–53. doi: 10.1148/radiol.2015141624. [DOI] [PMC free article] [PubMed] [Google Scholar]
- 5.Negussie AH, Dreher MR, Johnson CG, et al. Synthesis and characterization of image-able polyvinyl alcohol microspheres for image-guided chemoembolization. Journal of Materials Science-Materials in Medicine. 2015;26:10. doi: 10.1007/s10856-015-5530-3. [DOI] [PMC free article] [PubMed] [Google Scholar]
- 6.Sharma KV, Bascal Z, Kilpatrick H, et al. Long-term biocompatibility, imaging appearance and tissue effects associated with delivery of a novel radiopaque embolization bead for image-guided therapy. Biomaterials. 2016;103:293–304. doi: 10.1016/j.biomaterials.2016.06.064. [DOI] [PubMed] [Google Scholar]
- 7.Sharma KV, Dreher MR, Tang YQ, et al. Development of “Imageable” Beads for Transcatheter Embolotherapy. J Vasc Interv Radiol. 2010;21:865–76. doi: 10.1016/j.jvir.2010.02.031. [DOI] [PMC free article] [PubMed] [Google Scholar]
- 8.Levy EB, Krishnasamy VP, Lewis AL, et al. First Human Experience with Directly Image-able Iodinated Embolization Microbeads. Cardiovasc Interv Radiol. 2016;39:1177–86. doi: 10.1007/s00270-016-1364-8. [DOI] [PMC free article] [PubMed] [Google Scholar]
- 9.Lewis AL, Dreher MR, O'Byrne V, et al. DC BeadM1 (TM) : towards an optimal transcatheter hepatic tumour therapy. J Mater Sci-Mater Med. 2016;27:12. doi: 10.1007/s10856-015-5629-6. [DOI] [PMC free article] [PubMed] [Google Scholar]
- 10.Dreher MR, Sharma KV, Woods DL, et al. Radiopaque Drug-Eluting Beads for Transcatheter Embolotherapy: Experimental Study of Drug Penetration and Coverage in Swine. J Vasc Interv Radiol. 2012;23:257–64. doi: 10.1016/j.jvir.2011.10.019. [DOI] [PMC free article] [PubMed] [Google Scholar]
- 11.Pesapane F, Nezami N, Patella F, Geschwind JF. New concepts in embolotherapy of HCC. Med Oncol. 2017;34:18. doi: 10.1007/s12032-017-0917-2. [DOI] [PubMed] [Google Scholar]
- 12.Kim HC. Role of C-Arm Cone-Beam CT in Chemoembolization for Hepatocellular Carcinoma. Korean J Radiol. 2015;16:114–24. doi: 10.3348/kjr.2015.16.1.114. [DOI] [PMC free article] [PubMed] [Google Scholar]
- 13.Kim S, Yoo S, Yin FF, Samei E, Yoshizumi T. Kilovoltage cone-beam CT: Comparative dose and image quality evaluations in partial and full-angle scan protocols. Med Phys. 2010;37:3648–59. doi: 10.1118/1.3438478. [DOI] [PubMed] [Google Scholar]
- 14.Elkhateeb SM, Torgersen GR, Arnout EA. Image quality assessment of clinically-applied CBCT protocols using a QAT phantom. Dentomaxillofac Radiol. 2016;45:11. doi: 10.1259/dmfr.20160075. [DOI] [PubMed] [Google Scholar]
- 15.Daly MJ, Siewerdsen JH, Moseley DJ, Jaffray DA, Irish JC. Intraoperative cone-beam CT for guidance of head and neck surgery: Assessment of dose and image quality using a C-arm prototype. Med Phys. 2006;33:3767–80. doi: 10.1118/1.2349687. [DOI] [PubMed] [Google Scholar]
- 16.Moshtagh N. Minimum Volume Enclosing Ellipsoid. 2005 [Google Scholar]
- 17.Liang X, Ramamohanarao K, Frazer H, Yang Q Ieee. A Lesion Shape and Margin Characterization Method in Dynamic Contrast Enchanced Magnetic Resonance Imaging of Breast. 2012 9th Ieee International Symposium on Biomedical Imaging (Isbi) 2012:1783–6. [Google Scholar]
- 18.Thomsen M, Poulsen M, Bech M, et al. Visualization of subcutaneous insulin injections by x-ray computed tomography. Physics in Medicine and Biology. 2012;57:7191–203. doi: 10.1088/0031-9155/57/21/7191. [DOI] [PubMed] [Google Scholar]
- 19.Tan M, Deklerck R, Jansen B, Bister M, Cornelis J. A novel computer-aided lung nodule detection system for CT images. Med Phys. 2011;38:5630–45. doi: 10.1118/1.3633941. [DOI] [PubMed] [Google Scholar]


