Abstract
Background
Altered vascular structure or function in several diseases may impair renal perfusion. Multi-detector computed tomography (MDCT) is a non-invasive tool to assess single-kidney perfusion and function based on dynamic changes in tissue attenuation during contrast media transit. However, changes in basal tissue attenuation might hamper these assessments, despite background subtraction. Evaluation of iodine concentration using the dual-energy (DECT) MDCT mode allows excluding effects of basal values on dynamic changes in tissue attenuation. We tested whether decreased basal kidney attenuation secondary to intrarenal fat deposition in swine obesity interferes with assessment of renal perfusion using MDCT.
Methods
Domestic pigs were fed a standard (lean) or a high-cholesterol/carbohydrate (obese) diet (n=5 each) for 16 weeks, and both kidneys were then imaged using MDCT/DECT after iodinated contrast injection. DECT images were post-processed to generate iodine and virtual-non-contrast (VNC) datasets, and the MDCT kidney/aorta CT number (following background subtraction) and DECT iodine ratios calculated during the peak vascular phase as surrogates of renal perfusion. Intrarenal fat was subsequently assessed with Oil-Red-O staining.
Results
VNC maps in obese pigs revealed decreased basal cortical attenuation, and histology confirmed increased renal tissue fat deposition. Nevertheless, the kidney/aorta attenuation and iodine ratios remained similar, and unchanged compared to lean pigs.
Conclusions
Despite decreased basal attenuation secondary to renal adiposity, background subtraction allows adequate assessment of kidney perfusion in obese pigs using MDCT. These observations support the feasibility of renal perfusion assessment in obese subjects using MDCT.
Keywords: Iodine maps, Dual-Energy Computed Tomography, Renal perfusion, Obesity, Intrarenal fat
1. Introduction
Multi-detector computed-tomography (MDCT) is a reliable and reproducible non-invasive tool for estimation of single-kidney hemodynamics and function1. While para-aminohippurate and iothalamate clearance methods quantify renal blood flow (RBF) and glomerular filtration rate (GFR), respectively, of total renal mass (both kidneys), MDCT can quantify them in the single-kidney, which is useful in patients with unilateral or asymmetrical disease2.
Thirty percent of Americans suffer from obesity3 and its implications4, including intrarenal fat deposition and kidney disease5-7. Accurate non-invasive assessments of kidney function in obese individuals is, therefore, potentially useful. Quantification of renal function using CT relies on time-attenuation curves (TAC) depicting renal transit of iodinated contrast agents. However, because the CT attenuation of fat is within a range of highly negative values, substantial fat deposition may decrease the average opacity in renal regions of interest (ROI), resulting in underestimation of parenchymal attenuation.
To avoid such interference, these background values are commonly subtracted to offset baseline values and compute the rise in CT numbers secondary to contrast media transit. However, background subtraction has several limitations, including susceptibility to imaging artifacts like motion that increase variability of CT numbers (Hounsfield Units; HU), insufficient representative background data-points to average, and subjective selection of these points. Whether background subtraction successfully accounts for a fall in renal baseline attenuation due to fat deposition is incompletely understood. We hypothesized that renal fat deposition would not interfere with assessment of single-kidney perfusion and function using MDCT.
2. Materials and Methods
The study was approved by the Institutional Animal Care and Use Committee. Domestic pigs were randomized into two groups (n=5 each): lean pigs fed a standard chow, and obese pigs a high-cholesterol/carbohydrate diet8.
After 16 weeks of diet, MDCT (128-slice SOMATOM Definition Flash, Siemens, Germany) scanning performed to derive standard TAC for renal function with DECT parameters: detector collimation 64×0.6mm, 0 pitch, A and B tubes at 100kV, 240mAs and 140kV(Sn),185mAs, respectively, and D30f kernel. An iopamidol bolus (0.5mL/Kg/2sec) was injected into a catheter placed in the right atrium after a short delay. Three adjacent 5-mm slices were collected at each of the 140 successive time-points1.
DECT images were then acquired to generate iodine and virtual-non-contrast (VNC) datasets from helical scans, using similar acquisition parameters, except for a detector collimation 32×0.6mm and 1.2 pitch. Helical scans were acquired at the vascular phase during peak contrast enhancement following an additional injection of iopamidol (35cc; 5cc/sec) with a slice thickness of 0.6-mm and 5-mm, iodine/VNC maps and volume quantification, respecitvely1.
Total cholesterol was measured by standard procedures9, and blood pressure as described 10.
Animals were euthanized with pentobarbital (100mg/kg IV, Vortech)11 and kidneys harvested. Intrarenal lipid deposition was assessed in sections stained with Oil-Red-O (Sigma-Aldrich) and analyzed using ZEN2012 (Carl ZEISS, Germany)12.
For helical studies, the low- and high-energy images for each scan were averaged to generate mixed images using a 50% linear blend. Low and high-energy DECT image data were post-processed using a Siemens workstation with Syngo.via using ‘Liver-VNC’ application (Siemens Healthcare), with subsequent output including both VNC and iodine maps. For iodine maps, the value for each pixel corresponded to the concentration of iodine (mg/ml). VNC maps were used to measure and compare the baseline CT number between groups.
ROIs were drawn on mixed images (iodine contrast, soft tissue, fat), iodine alone maps (isolated iodine concentrations), and VNC maps (soft tissue, fat) in the cortex, medulla, and aorta at the same tomographic levels as perfusion slices, close to the kidney hilum. Iodine concentrations (mg/ml) and CT numbers (HU) were recorded in each ROI in 3-4 images of the kidney showing clear delineation between the medulla and cortex, and then subsequently averaged. Because iodine maps (and, hence, concentration) cannot be easily derived from perfusion images for generation of iodine TAC, we used the ratio (kidney tissue/aorta) of the CT numbers and iodine concentrations to assess functional changes of either iodine concentrations (ml/mg) or CT numbers (iodine contrast, soft tissue, and fat). Previous studies have used the ratio between the peak-height of the tissue TAC to the area under the input-function (e.g., aorta) TAC to calculate single-kidney perfusion13. Comparably, we used the ratio between the cortical or medullary and aorta CT number and iodine concentration as a rough index of renal perfusion. The ratios in helical mixed images are quantified from CTROI and CTAorta, the CT number in the kidney and aorta, respectively, CTRatio represents their ratio.
Similarly in helical iodine maps, IR0I and IAorta are iodine concentration (ml/mg) in the kidney and the aorta, respectively, and IRatio represents the iodine ratio between them.
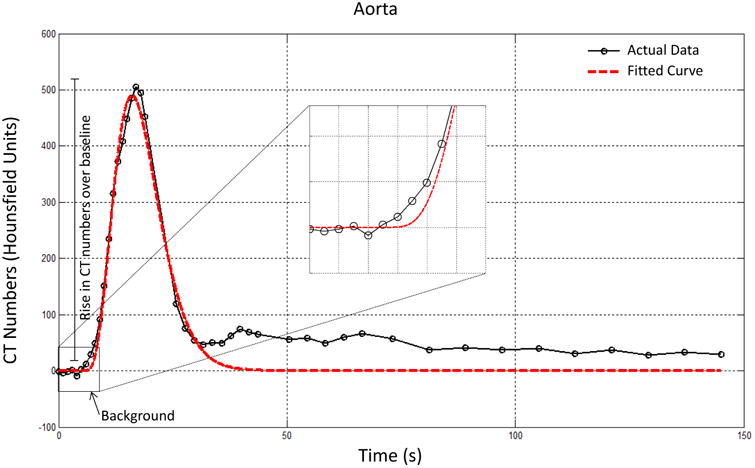
Kidney volumes were evaluate using Analyze™ software (Biomedical Imaging Resource; Mayo Clinic)2 and renal function from CT-generated TACs fitted with a Γ-variate model (Matlab, MathWorks, R2013B)1, 10. For background subtraction, tissue attenuation observed on three images immediately preceding the contrast bolus arrival was averaged and set to zero (Figure 1). Then renal function was assessed from TAC using the rise in CT numbers (HU) from the zeroed baseline2, 14.
Figure 1.

TAC of aorta showing the background data-points collected, averaged, and zeroed in order to assess a rise in CT number over baseline. Raw data: black; Γ-variate model fitting: red.
Mean values and standard deviations express results, and two-tailed unpaired t-tests (JMP-10.0, SAS) compare between lean and obese pigs. P≥0.05 was considered statistically significant.
3. Results
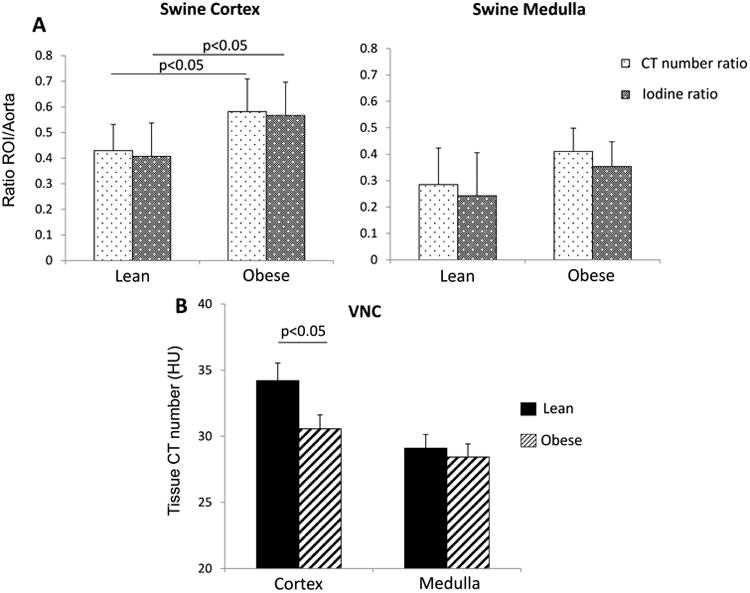
Sixteen weeks after initiation of diet, body weight, mean blood pressure, and lipid levels were higher in obese compared to lean pigs (Table 1), as were CTRatio and IRatio , consistent with cortical hyper-filtration that characterizes obesity. There was no difference between cortical or medullary IRatio and CTRatio within either group (p>0.05, Figure 3A). In VNC maps, we observed significantly lower cortical CT numbers in the obese group (Figure 3B), but not in the medulla.
Table 1.
Systemic characteristics and renal function at 16 weeks.
| Parameter | Lean | Obese |
|---|---|---|
| N(kidneys) | 5(10) | 5(10) |
| Body weight(Kg) | 72.8±10.8 | 92.1 ±2.2* |
| Mean blood pressure(mmHg) | 100.4±10.7 | 126.7±7.8* |
| Total cholesterol(mg/dl) | 83.7±6.8 | 434.6±79.1* |
| Total Renal Volume(cc) | 137.8±18.6 | 222.2±20.8* |
| Cortical Volume(cc) | 108.1±17.9 | 181.2±22.9* |
| Medullary Volume(cc) | 29.6±2.5 | 41.0±4.2* |
| Cortical Perfusion(ml/min/cc) | 4.0±0.7 | 4.1 ±0.5 |
| Medullary Perfusion(ml/min/cc) | 2.9±0.9 | 2.6±1.5 |
| RBF(ml/min) | 495.2±50.3 | 746.9±65.3* |
| MDCT-GFR(ml/min) | 75.8±11.1 | 144.5±17.0* |
p≤0.05 vs. Lean.
RBF: renal blood flow, GFR: glomerular filtration rate, MDCT: Multi-detector computed-tomography
Figure 3.

A. CT number (HU, light dotted) and iodine (mg/ml, dark dotted) kidney/aorta ratios were similarly elevated in the renal cortex and medulla of obese pigs. B. CT number (HU) values in VNC show lower cortical attenuation in obese.
Single-kidney volumes were increased in obese pigs, whereas their perfusion measured from TAC did not differ between the groups. Both GFR and RBF were higher in obese pigs, suggesting hyper-filtration (Table 1).
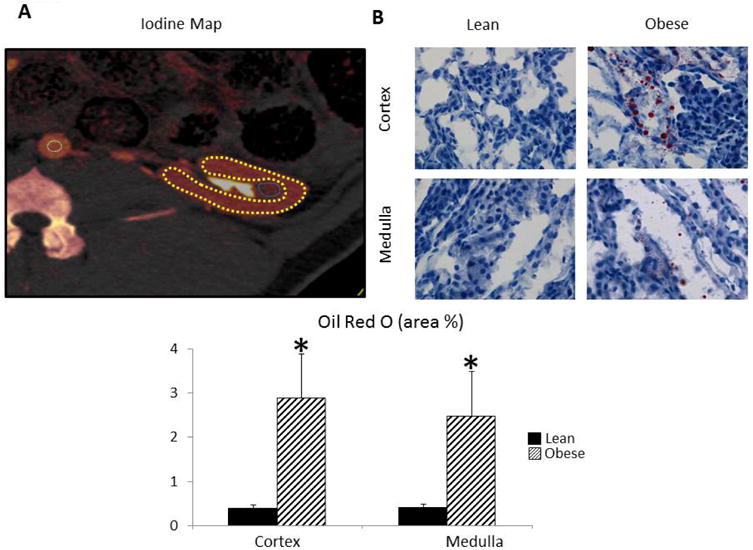
Finally, Oil-Red-O values confirmed higher fat deposition in obese pig-kidneys (Figure 2C).
Figure 2.

A: Iodine map depicting ROI in the aorta (white), cortex (yellow), and medulla (blue). B: Oil-Red-O staining indicating deposited fat (red) in obese pig kidneys.
In summary, we found that changes in CTRatio (after background subtraction) and IRatio (excluding basal attenuation) were comparable in lean and obese swine, suggesting that intrarenal adiposity does not interfere with quantification of single-kidney perfusion and function using MDCT-derived TAC. Therefore, background subtraction used for CT renal function assessment is adequate for eliminating the potentially confounding attenuation of fat. These observations may be relevant for the use of TAC for MDCT perfusion assessments in other organs as well.
Acknowledgments
Funding: This study was partly supported by National Institutes of Health Grants Numbers DK104273, DK100081, HL123160, and DK102325.
Footnotes
Conflict of interest: Dr. McCollough: Grant recipient, Siemens Healthcare
Publisher's Disclaimer: This is a PDF file of an unedited manuscript that has been accepted for publication. As a service to our customers we are providing this early version of the manuscript. The manuscript will undergo copyediting, typesetting, and review of the resulting proof before it is published in its final citable form. Please note that during the production process errors may be discovered which could affect the content, and all legal disclaimers that apply to the journal pertain.
References
- 1.Daghini E, Primak AN, Chade AR, Krier JD, Zhu XY, Ritman EL, McCollough CH, Lerman LO. Assessment of renal hemodynamics and function in pigs with 64-section multidetector CT: comparison with electron-beam CT. Radiology. 2007;243:405–12. doi: 10.1148/radiol.2432060655. [DOI] [PubMed] [Google Scholar]
- 2.Kwon SH, Saad A, Herrmann SM, Textor SC, Lerman LO. Determination of Single-Kidney Glomerular Filtration Rate in Human Subjects by Using CT. Radiology. 2015;276:490–8. doi: 10.1148/radiol.2015141892. [DOI] [PMC free article] [PubMed] [Google Scholar]
- 3.Ogden CL, Carroll MD, Kit BK, Flegal KM. Prevalence of childhood and adult obesity in the United States, 2011-2012. JAMA. 2014;311:806–14. doi: 10.1001/jama.2014.732. [DOI] [PMC free article] [PubMed] [Google Scholar]
- 4.Hsu CY, McCulloch CE, Iribarren C, Darbinian J, Go AS. Body mass index and risk for end-stage renal disease. Ann Intern Med. 2006;144:21–8. doi: 10.7326/0003-4819-144-1-200601030-00006. [DOI] [PubMed] [Google Scholar]
- 5.Jiang T, Wang Z, Proctor G, Moskowitz S, Liebman SE, Rogers T, Lucia MS, Li J, Levi M. Diet-induced obesity in C57BL/6J mice causes increased renal lipid accumulation and glomerulosclerosis via a sterol regulatory element-binding protein-1c-dependent pathway. J Biol Chem. 2005;280:32317–25. doi: 10.1074/jbc.M500801200. [DOI] [PubMed] [Google Scholar]
- 6.Kume S, Uzu T, Araki S, Sugimoto T, Isshiki K, Chin-Kanasaki M, Sakaguchi M, Kubota N, Terauchi Y, Kadowaki T, Haneda M, Kashiwagi A, Koya D. Role of altered renal lipid metabolism in the development of renal injury induced by a high-fat diet. J Am Soc Nephrol. 2007;18:2715–23. doi: 10.1681/ASN.2007010089. [DOI] [PubMed] [Google Scholar]
- 7.Keane WF, Kasiske BL, O'Donnell MP, Kim Y. The role of altered lipid metabolism in the progression of renal disease: experimental evidence. Am J Kidney Dis. 1991;17:38–42. [PubMed] [Google Scholar]
- 8.Eirin A, Woollard JR, Ferguson CM, Jordan KL, Tang H, Textor SC, Lerman A, Lerman LO. The metabolic syndrome induces early changes in the swine renal medullary mitochondria. Transl Res. 2017;184:45–56 e9. doi: 10.1016/j.trsl.2017.03.002. [DOI] [PMC free article] [PubMed] [Google Scholar]
- 9.Eirin A, Zhu XY, Urbieta-Caceres VH, Grande JP, Lerman A, Textor SC, Lerman LO. Persistent kidney dysfunction in swine renal artery stenosis correlates with outer cortical microvascular remodeling. Am J Physiol Renal Physiol. 2011;300:F1394–401. doi: 10.1152/ajprenal.00697.2010. [DOI] [PMC free article] [PubMed] [Google Scholar]
- 10.Krier JD, Ritman EL, Bajzer Z, Romero JC, Lerman A, Lerman LO. Noninvasive measurement of concurrent single-kidney perfusion, glomerular filtration, and tubular function. Am J Physiol Renal Physiol. 2001;281:F630–8. doi: 10.1152/ajprenal.2001.281.4.F630. [DOI] [PubMed] [Google Scholar]
- 11.Eirin A, Ebrahimi B, Zhang X, Zhu XY, Woollard JR, He Q, Textor SC, Lerman A, Lerman LO. Mitochondrial protection restores renal function in swine atherosclerotic renovascular disease. Cardiovasc Res. 2014;103:461–72. doi: 10.1093/cvr/cvu157. [DOI] [PMC free article] [PubMed] [Google Scholar]
- 12.Li Z, Woollard JR, Wang S, Korsmo MJ, Ebrahimi B, Grande JP, Textor SC, Lerman A, Lerman LO. Increased glomerular filtration rate in early metabolic syndrome is associated with renal adiposity and microvascular proliferation. Am J Physiol Renal Physiol. 2011;301:F1078–87. doi: 10.1152/ajprenal.00333.2011. [DOI] [PMC free article] [PubMed] [Google Scholar]
- 13.Lerman LO, Bell MR, Lahera V, Rumberger JA, Sheedy PF, 2nd, Sanchez Fueyo A, Romero JC. Quantification of global and regional renal blood flow with electron beam computed tomography. Am J Hypertens. 1994;7:829–37. doi: 10.1093/ajh/7.9.829. [DOI] [PubMed] [Google Scholar]
- 14.Daghini E, Juillard L, Haas JA, Krier JD, Romero JC, Lerman LO. Comparison of mathematic models for assessment of glomerular filtration rate with electron-beam CT in pigs. Radiology. 2007;242:417–24. doi: 10.1148/radiol.2422052144. [DOI] [PubMed] [Google Scholar]


