

Abstract
Background
HIV-infected individuals are at increased risk for both sarcopenia and cardiovascular disease. Whether an association between low muscle mass and subclinical coronary artery disease (CAD) exists, and if it is modified by HIV serostatus, are unknown.
Methods
We performed cross-sectional analysis of 513 male MACS participants (72% HIV-infected) who underwent mid-thigh computed tomography (CT) and non-contrast cardiac CT for coronary artery calcium (CAC) during 2010-2013. Of these, 379 also underwent coronary CT angiography for non-calcified coronary plaque (NCP) and obstructive coronary stenosis ≥50%. Multivariable-adjusted Poisson regression was used to estimate prevalence risk ratios of associations between low muscle mass (<20th percentile of the HIV-uninfected individuals in the sample) and CAC, NCP and obstructive stenosis.
Results
The prevalence of low thigh muscle mass was similar by HIV serostatus (20%). There was no association of low muscle mass with CAC or NCP. However, low thigh muscle mass was significantly associated with a 2.5-fold higher prevalence of obstructive coronary stenosis, after adjustment for demographics and traditional CAD risk factors [PR 2.46 (95% CI 1.51, 4.01)]. This association remained significant after adjustment for adiposity, inflammation, and physical activity. There was no significant interaction by HIV serostatus (p-interaction=0.90).
Conclusions
In this exploratory analysis, low thigh muscle mass was significantly associated with subclinical obstructive coronary stenosis. Additional studies involving larger sample sizes and prospective analyses are needed to confirm the potential utility of measuring mid-thigh muscle mass for identifying individuals at increased risk for obstructive CAD who might benefit from more aggressive risk factor management.
Keywords: Muscle mass, sarcopenia, HIV-infection, coronary atherosclerosis, coronary artery stenosis
1. Introduction
With advances in treatment for HIV infection and subsequent declines in AIDS-related mortality,1 cardiovascular disease (CVD) has emerged as a leading cause of death among HIV-infected individuals. HIV-infected individuals have higher rates of myocardial infarction2, 3 and increased prevalence of subclinical coronary atherosclerosis compared to HIV-uninfected individuals with similar risk factor profiles.4, 5 The pathogenesis of coronary artery disease (CAD) in HIV-infected individuals is complex and may be related to both traditional and non-traditional CVD risk factors.
Muscle wasting is a potentially modifiable risk factor for CAD among HIV-infected individuals that has not been well-studied.6 HIV-infection, particularly in persons with a history of advanced HIV disease, is associated with lean muscle mass loss7 and sarcopenia.8 In the general population, sarcopenia has been associated with insulin resistance and systemic inflammation, known risk factors for atherogenesis.9, 10 Sarcopenia has also been linked to measures of subclinical atherosclerosis including carotid intimal medial thickness,11 arterial stiffness,12 and coronary artery calcium (CAC).13 Whether low muscle mass is also associated with non-calcified coronary plaque, which is more prevalent in HIV-infected compared to non-infected individuals,4, 5 as well as with the severity of obstructive coronary artery stenosis, is unknown. Furthermore, whether the association of low muscle mass with subclinical coronary atherosclerosis is affected by HIV serostatus has not been assessed.
The mid-thigh muscle mass cross-sectional area ascertained by computed tomography (CT) has proven to be a useful index of body composition and sarcopenia.14 Prior work from the Multicenter AIDS Cohort Study (MACS) found that thigh muscle cross-sectional area was significantly, though weakly, correlated with grip strength, and that HIV-infected men had lower muscle quality and more pronounced decline in thigh muscle density with increasing age compared to HIV-uninfected men.15 Low thigh muscle mass by CT has also been associated with increased risk of hip fractures in another cohort.16 A single slice mid-thigh CT is noninvasive and easily obtained among individuals undergoing CT imaging for other indications, and may offer additional prognostic information.
Our study sought to investigate three questions: (1) whether low thigh muscle mass is associated with subclinical coronary atherosclerosis as measured by both CAC and non-calcified coronary plaque; (2) whether low thigh muscle mass is associated with the severity of coronary stenosis; and (3) whether such associations, if present, differ by HIV serostatus. We hypothesized that low thigh muscle mass area is independently associated with CAC, non-calcified plaque, and severity of stenosis, independent of traditional CVD risk factors. We also evaluated whether such associations are stronger among HIV-infected compared to HIV-uninfected individuals, and whether associations are additionally independent of adiposity, systemic inflammation, and physical activity – factors which may mediate any relationships found.
2. Methods
2.1 Population
MACS is an ongoing multi-center prospective cohort study of the natural and treated histories of HIV-infection in men who have sex with men. There were 7,087 HIV-infected and HIV-uninfected participants enrolled across 4 time periods: 1984-85 (N=4,954), 1987-90 (N=668), 2001-03 (N=1,350) and 2010+ (N=115) at 4 sites: Baltimore, Maryland/ Washington, DC; Chicago, Illinois; Pittsburgh, Pennsylvania; and Los Angeles, California.17 Research visits occur every 6 months and include questionnaires, physical examination, blood testing (including long-term blood storage), and urine analysis. Detailed description of the MACS has been previously published.17
Of >7,000 men originally enrolled in MACS, 1006 were recruited between 2010-2013 into a CVD sub-study (MACS-CVD2). Inclusion/exclusion criteria for the CVD substudy have been published.4 Briefly, MACS participants were included if they were aged 40 to 70 years, weighed less than 136 kg, and had no history of cardiac surgery or percutaneous coronary intervention.4 Eligible men underwent non-contrast cardiac CT scanning to determine CAC score. Among participants who completed the non-contrast cardiac CT, a subset (n=759) also underwent contrast coronary CTA to measure total plaque burden, plaque composition and coronary stenosis. Exclusion criteria for CTA were contrast allergy, atrial fibrillation, or chronic kidney disease (estimated glomerular filtration rate (eGFR) <60 mL/min/1.73m2) within 30 days of imaging.
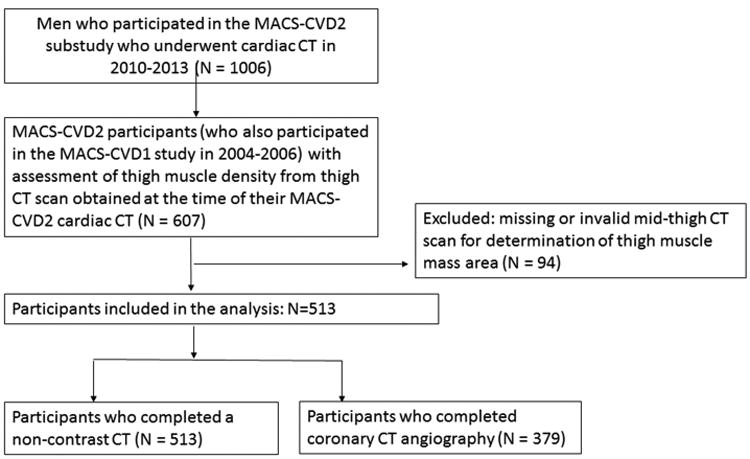
Of the 1006 MACS-CVD2 participants who were eligible for non-contrast cardiac CT scanning, 607 underwent measurement of muscle density from a mid-thigh CT scan obtained at the time of their MACS-CVD2 cardiac CT as part of another ancillary study evaluating measures of body composition.15 These participants were selected because they had participated in an earlier MACS-CVD1 ancillary study in 2004-2006. Ninety-four participants had missing or invalid mid-thigh CT scans for the measurement of muscle density. The current analysis was conducted on 513 men with both thigh muscle mass area and non-contrast chest CT data for CAC analysis, and on 379 men with thigh muscle mass area and CTA data for analyses of non-calcified plaque and severity of coronary stenosis (Figure 1).
Figure 1. Inclusion and exclusion of study participants.
The Institutional Review Boards of all participating sites approved the MACS and MACS-CVC2 studies, and all participants signed informed consent.
2.2 Measurement of Muscle Mass
‘For this analysis, low muscle mass measured by CT was the independent variable of interest. Thigh CT images were analyzed by trained, experienced readers at the core CT reading center (Los Angeles Biomedical Research Institute at Harbor-UCLA) who were blinded to participant characteristics and HIV serostatus. Details of the CT scanning equipment has been previously reported;4, 18 three centers used a 64-slice multidector CT at 3 sites and one center used a 320-row multidetector CT (Supplemental Methods).
The thigh CT scanning protocol is described in the Supplemental Methods and the methods for thigh muscle mass measurement have been published.15 Briefly, mid-thigh CT scans were obtained with a 5-10 mm cross-sectional image for each subject at the midpoint between the anterior superior iliac crest and the patella. The right leg was typically scanned per protocol, unless unavailable, in which case the left leg was scanned instead. Manual tracings were performed to delineate thigh subcutaneous fat and muscle (Figure 2). Muscle density in Hounsfield Units (HU) was measured within the region bound by the fascia lata (outermost fascia) of the thigh muscle. In image analysis, areas (cm2) of thigh skeletal muscle and subcutaneous adipose tissue were measured by selecting the following regions of interest, defined by the following attenuation values described by Goodpaster et al19 : -35 to -190 HU for adipose tissue, and 0 to100 HU for muscle; mean muscle attenuation was determined from all pixels within this range. Although reproducibility data was not available for our cohort, prior work by Goodpaster found the test/re-test coefficient of variance for assessment of skeletal muscle attenuation by mid-thigh CT was 0.51%, suggesting low variability.20
Figure 2.
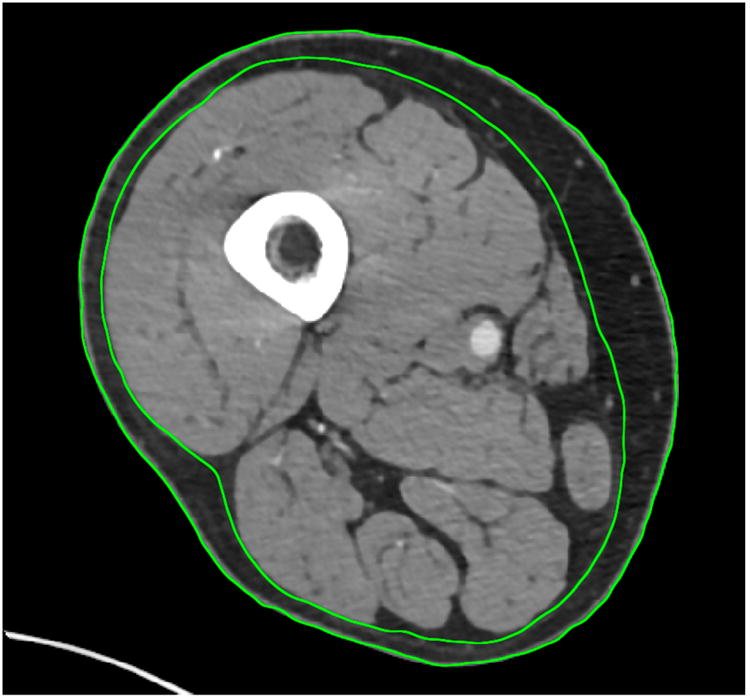
Mid-thigh CT slice from a MACS participant with HIV-infection. Manual tracings delineate thigh subcutaneous fat and muscle. The inner circle represents the area of interest, the thigh muscle bundle.
Muscle weakness (as part of the frailty definition) has been defined in the MACS as dynamometer-measured grip strength <20th percentile of HIV-uninfected men.21, 22 To mirror this definition, participants with total areas of thigh muscle mass <20th percentile of the HIV-uninfected men in this sample were also classified as having low muscle mass, corresponding to <124.6 cm2. We also examined thigh muscle mass as a continuous variable per 1 standard deviation (SD) lower value.
2.3 Cardiac CT and assessment of subclinical coronary atherosclerosis
The dependent outcomes of interest included: (1) presence of any CAC (Agatston score >0), (2) presence of significant CAC (Agatston score ≥100) (3) presence of any coronary plaque on CT angiography (total plaque score (TPS) >0), (4) presence of any non-calcified plaque (non-calcified plaque score (NCPS) >0), and (6) moderate to severe coronary artery stenosis (≥50%).23
Cardiac CT scans were obtained following procedures as previously described.4 Briefly, participants received a beta-blocker or calcium channel blocker if needed for heart rate control just before the time of scanning, followed by sublingual nitroglycerin before administration of IV contrast unless contraindicated. Coronary CTA was performed with electrocardiogram-triggered protocols and median radiation dose of 1.9 mSv (interquartile range, 1.7-2.7 mSv). The cardiac CT images were analyzed at the core CT reading center (Los Angeles Biomedical Research Institute at Harbor-UCLA) by trained, experienced readers blinded to participant clinical information.
CAC scores obtained from non-contrast CTs were calculated using the Agatston method. Coronary CTA images were examined to characterize coronary plaque burden (presence, size, and composition of plaque) and degree of coronary stenosis in all segments following the modified 15-segment model of the American Heart Association.24 Coronary stenosis ≥50% were considered significant.4
Total plaque score was calculated as the sum of individual plaque size scores across all coronary segments that showed any plaque, with a maximum score of 45.4 Composition of plaque for each coronary segment was categorized as noncalcified or calcified. Noncalcified plaque was defined as any discernable structure clearly assignable to the vessel wall with a CT density less than the contrast-enhanced coronary lumen but greater than the surrounding connective in at least 2 independent planes. Calcified plaque was defined as any structure with CT attenuation >130 HU visualized as distinct from the intravascular lumen in at least 2 independent planes. The noncalcified plaque score (NCPS) was calculated as the sum of the individual NCPS across all coronary segments.
2.4 Covariates
Demographic data including race (self-identified) were recorded at enrollment. We categorized race as White non-Hispanic, Black non-Hispanic, and other (which included Hispanics, American Indian or Alaskan Native, Asian or Pacific Islander, and other). As part of routine MACS visits, study participants were seen every 6 months, and data were collected regarding medication use, CVD risk factors, and HIV clinical variables, by questionnaires, physical examination, and blood tests. For this analysis, we used data collected at the MACS visit closest to the CT date.
Blood pressure was measured using standardized procedures, with hypertension defined as systolic blood pressure over 140 mmHg, diastolic blood pressure over 90 mmHg, or self-reported use of medication for hypertension. Body mass index (BMI) was categorized as <18, 18-<25, 25-<30, ≥30 kg/m2. Smoking status was self-reported at each visit as never, former, or current smoker. Physical activity was self-reported using the International Physical Activity Questionnaire25 which captures three levels of activity (low, medium, or high activity). Glucose, total cholesterol, and high-density lipoprotein cholesterol (HDL-C), levels were measured from fasting blood samples. Serum creatinine level was measured at each MACS visit and within 30 days prior to CT scanning for participants who had contrast injection; eGFR was determined by the Modification of Diet in Renal Disease equation.26
Serum levels of inflammatory biomarkers were measured from blood samples drawn at the time of the CT visit and assayed at the University of Vermont Laboratory for Clinical Biochemical Research in Burlington, Vermont as described.23, 27 For our analyses, we chose a priori to evaluate levels of high-sensitivity C-reactive protein (hsCRP) and interleukin 6 (IL-6) because in the general population levels of these markers are associated with subclinical coronary atherosclerosis.28 We also chose to evaluate levels of monocyte activation markers soluble CD14 (sCD14), soluble CD163 (sCD163), and chemokine (C-C motif) ligand 2 (CCL2) because they have been shown to be elevated in antiretroviral therapy (ART) treated HIV-infected men and to be associated with atherosclerosis.23
Hepatitis C virus (HCV) infection was defined as either a positive enzyme immunosorbent assay (EIA) for HCV antibody in plasma or serum, or detection of HCV RNA in plasma using a quantitative polymerase chain reaction assay (Roche Molecular Systems ultrasensitive assay with a limit detection of 50 copies/mL). Men who were EIA-positive with undetectable HCV RNA for at least 3 years were considered HCV-uninfected. HIV disease characteristics evaluated included plasma HIV RNA levels, CD4+ T-lymphocyte cell counts (CD4) measured by flow cytometry, history of AIDS-defining illness, and use and duration of ART.
2.5 Statistical Analysis
For participants with missing key covariates, multiple imputation was used to impute for missing data: systolic blood pressure (n=2); use of antihypertensive medications (n=6); use of diabetes medications (n=9); fasting glucose (n=8); use of lipid-lowering medications (n=15); total and HDL cholesterol levels (n=2); body mass index (n=4); hsCRP levels (n=10); IL-6 (n=10); HCV status (n=8); sCD163 levels (n=31); sCD14 levels (n=42); CCL2 levels (n=8); and physical activity (n=101). The distributions of demographic and clinical variables by muscle mass status (i.e. <20th percentile or ≥20th percentile) by HIV-serostatus were reported as counts (proportions) for categorical variables, means (standard deviations) for normally distributed variables, or median (interquartile interval) for skewed variables. Comparisons were made using Student's t-test, Wilcoxon rank sum test or chi-square test as appropriate.
Since the prevalence of measures of subclinical coronary atherosclerosis were greater than 10%, a modified Poisson regression analysis with robust variance was used to estimate the prevalence risk ratios (PR) with 95% confidence intervals (CI) of associations between low muscle mass area and each subclinical coronary atherosclerosis measure in separate models.
Multivariable-adjusted models were performed as follows. Model 1 adjusted for demographic factors including age, race, CT scanning center, study cohort (pre-versus post-2001), and HIV-serostatus. Model 2, our primary model, additionally adjusted for established CVD risk factors including systolic blood pressure, smoking status, fasting glucose level, total and HDL cholesterol, use of lipid lowering, antihypertensive, and diabetes medications, and HCV-infection status. Three additional models were performed to explore potential mechanisms potentially underlying associations seen in our primary model. Model 3 additionally adjusted for categories of BMI. Since adiposity and low muscle mass can co-exist (i.e., sarcopenic obesity) and confer even greater CVD risk when present together,29 Model 3 determined if BMI attenuated any associations found between low muscle mass and subclinical coronary atherosclerosis. Model 4 adjusted for Model 2 covariates plus levels inflammatory markers (hsCRP, log-transformed IL-6, sCD163, sCD14 and log-transformed CCL2). Inflammation may mediate associations between sarcopenia and CAD;9 therefore, we wanted to determine if effects were attenuated after accounting for levels of inflammatory markers. Finally, to evaluate whether low physical activity mediates associations between sarcopenia and coronary plaque, Model 5 adjusted for Model 2 covariates plus physical activity categories (low, medium high). Finally, among HIV-infected men only, we evaluated a supplementary model (Model 6) that adjusted for Model 2 covariates plus HIV-related factors including CD4 cell count, presence of detectable HIV RNA >200 copies, history of AIDS, use of ART, and duration of ART.
For our main Model (Model 2), Wald tests were used to formally test for two-way multiplicative interactions of thigh muscle mass status with HIV-serostatus in relation to subclinical coronary atherosclerosis measures. All statistical analyses were performed using Stata 12 (StataCorp Lp, College Station, TX). A p-value of <0.05 was considered to be statistically significant.
3. Results
The characteristics of study participants (n=513) by thigh muscle mass area, stratified by HIV serostatus are shown in Table 1. The study population included 368 (72%) HIV-infected men and 145 (28%) HIV-uninfected men. Prevalence of low thigh muscle mass area (<20th percentile of HIV-uninfected men) was similar (20%) regardless of HIV serostatus. Both HIV-infected and HIV-uninfected men with low thigh muscle mass were significantly more likely have lower BMI. HIV-infected men with low thigh muscle mass were significantly more likely to have a history of AIDS and had a lower mean CD4+T cell count at the time of their scan.
Table 1. Characteristics* of 513 MACS Participants by Muscle Mass Status, Stratified by HIV Serostatus.
| HIV-uninfected (N=145) | HIV-infected (n=368) | |||||
|---|---|---|---|---|---|---|
| Muscle Mass† | ≥ 20th percentile | < 20th percentile (Low) | p-value | ≥ 20th percentile | < 20th percentile (Low) | p-value |
| N | 116 | 29 | 293 | 75 | ||
| Age, years | 56.4 ± 6.3 | 56.8 ± 7.0 | 0.78 | 53.4 ± 5.8 | 55.3 ± 5.8 | 0.017 |
| Race | 0.60 | 0.62 | ||||
| Non-Hispanic white | 71 (61.2) | 20 (69.0) | 158 (53.9) | 45 (60.0) | ||
| Non-Hispanic black | 35 (30.2) | 6 (20.7) | 102 (34.8) | 22 (29.3) | ||
| Other | 10 (8.6) | 3 (10.3) | 33 (11.3) | 8 (10.7) | ||
| BMI, kg/m2 | 27.9 ± 4.9 | 24.3 ± 3.6 | <0.001 | 27.1 ± 4.4 | 22.5 ± 3.3 | <0.001 |
| Smoking status | 0.96 | 0.13 | ||||
| Never | 30 (26.1) | 7 (24.1) | 77 (26.6) | 19 (25.7) | ||
| Former | 60 (52.2) | 16 (55.2) | 136 (46.9) | 27 (36.5) | ||
| Current | 25 (21.7) | 6 (20.7) | 77 (26.6) | 28 (37.8) | ||
| AIDS | NA | NA | 38 (13.0) | 20 (26.7) | 0.004 | |
| CD4 positive cells | NA | NA | 653 ± 297 | 551 ± 230 | 0.006 | |
| HIV RNA ≥ 200 copies/mL | NA | NA | 29 (10.0) | 10 (13.3) | 0.41 | |
| HIV RNA ≥ 50 copies/mL | 46 (15.9) | 15 (20.0) | 0.39 | |||
| Use of HAART | NA | NA | 283 (96.6) | 73 (97.3) | 0.75 | |
| Duration of HAART, years | NA | NA | 16.0 ± 6.3 | 14.7 ± 5.8 | 0.13 | |
| HCV positive status | 6 (5.3) | 2 (6.9) | 0.73 | 31 (10.7) | 15 (20.5) | 0.02 |
| Systolic blood pressure, mmHg | 129 ± 16 | 123 ± 12 | 0.043 | 128 ± 15 | 126 ± 18 | 0.26 |
| Hypertension medication use | 38 (33.3) | 11 (37.9) | 0.64 | 108 (37.2) | 26 (35.1) | 0.74 |
| Fasting glucose, mg/dl‡ | 103± 21 | 107 ± 67 | 0.62 | 105 ± 25 | 107 ± 40 | 0.66 |
| Diabetes medication use | 7 (6.1) | 5 (17.2) | 0.052 | 30 (10.4) | 10 (14.1) | 0.37 |
| Total cholesterol, mg/dl‡ | 195 ± 33 | 184 ± 26 | 0.10 | 188 ± 39 | 195 ± 54 | 0.22 |
| HDL cholesterol, mg/dl‡ | 54 ± 17 | 57 ± 15 | 0.35 | 47 ± 14 | 53 ± 19 | 0.002 |
| Lipid lowering medication use | 42 (36.8) | 9 (31.0) | 0.56 | 105 (36.8) | 29 (41.4) | 0.48 |
| Physical activity status | 0.72 | 0.64 | ||||
| Low | 25 (25.5) | 9 (33.3) | 63 (27.0) | 18 (33.3) | ||
| Medium | 28 (28.6) | 7 (25.9) | 69 (29.6) | 14 (25.9) | ||
| High | 45 (45.9) | 11 (40.7) | 101 (43.3) | 22 (40.7) | ||
Data are presented as Mean ± Standard Deviation or N (%).
<20th percentile cutpoint was determined by the thigh muscle cross-sectional area distribution among HIV-uninfected men in this sample and corresponds to <124.6 cm2
To convert glucose from mg/dl to mmol/L, divide by 18. To convert total and HDL-C cholesterol from mg/dl to mmol/L, divide by 38.67.
Abbreviations: MACS=Multicenter AIDS Cohort Study; HIV = human immunodeficiency virus; BMI = body mass index; AIDS = acquire immune deficiency syndrome; RNA= ribonucleic acid; HAART = highly active antiretroviral therapy; HCV= hepatitis C virus; HDL= high density lipoprotein
HIV-infected men with low thigh muscle mass also had significantly higher blood levels of IL-6, sCD163 and sCD14 compared with HIV-infected men with greater thigh muscle mass (Table 2). The unadjusted distribution of the subclinical coronary atherosclerosis measures by muscle mass groups is shown in Table 3. The presence of CAC on non-contrast CT and non-calcified plaque on CTA did not significantly differ by muscle mass status regardless of HIV serostatus. However, HIV-infected men with low thigh muscle mass tended to have more coronary artery stenosis ≥50% (Table 3).
Table 2. Distribution of Inflammatory Markers by Muscle Mass, Stratified by HIV Serostatus.
| HIV-uninfected | HIV-infected | |||||
|---|---|---|---|---|---|---|
| Muscle Mass* | ≥20th percentile | <20th percentile (Low) | p-value | ≥20th percentile | <20th percentile (Low) | p-value |
| N | 116 | 29 | 293 | 75 | ||
| hsCRP, ug/ml† | 0.9 (0.5 - 1.6) | 1.2 (0.6 - 2.6) | 0.36 | 0.7 (0.3 - 1.7) | 1.3 (0.7 - 3.9) | 0.41 |
| IL-6, pg/ml† | 1.3 (0.9 - 2.5) | 1.5 (0.9 - 2.4) | 0.90 | 1.4 (1.0 - 1.7) | 1.8 (1.2 - 3.0) | 0.004 |
| sCD163, ng/ml‡ | 553 ± 178 | 647 ± 195 | 0.02 | 700 ± 250 | 771 ± 269 | 0.04 |
| sCD14, ng/ml‡ | 1295 ± 338 | 1337 ± 304 | 0.56 | 1658 ± 432 | 1899 ± 605 | <0.001 |
| CCL2 level, pg/mL† | 248 (200 - 309) | 279 (222 - 354) | 0.21 | 286 (233 - 328) | 283 (228 - 364) | 0.37 |
<20th percentile cutpoint was determined by the thigh muscle cross-sectional area distribution among HIV-uninfected men in this sample and corresponds to <124.6 cm2.
Median (Interquartile Interval)
Mean ± Standard Deviation
Abbreviations: human immunodeficiency virus (HIV); high-sensitivity C-reactive protein (hsCRP), interleukin 6 (IL-6); soluble CD14 (sCD14); soluble CD163 (sCD163); chemokine (C-C motif) ligand 2 (CCL2)
Table 3. The Distribution* of Subclinical Coronary Atherosclerosis by Muscle Mass Groups, Stratified by HIV Serostatus.
| HIV-uninfected | HIV-infected | |||||
|---|---|---|---|---|---|---|
| Muscle Mass† | ≥20th percentile | <20th percentile (Low) | p-value | ≥20th percentile | <20th percentile (Low) | p-value |
| N | 116 | 29 | 293 | 75 | ||
| CAC score>0 | 54 (46.6) | 15 (51.7) | 0.62 | 152 (51.9) | 47 (62.7) | 0.09 |
| CAC score ≥100 | 23 (19.8) | 7 (24.1) | 0.61 | 69 (23.5) | 17 (22.7) | 0.87 |
| Any coronary plaque (TPS> 0) | 76 (81.7) | 19 (79.2) | 0.78 | 181 (83.0) | 36 (81.8) | 0.85 |
| Any non-calcified plaque (NCPS>0) | 61 (65.6) | 15 (62.5) | 0.78 | 160 (73.4) | 29 (65.9) | 0.31 |
| Coronary Stenosis≥50% | 10 (10.8) | 6 (25.0) | 0.07 | 33 (15.1) | 12 (27.3) | 0.05 |
| Total plaque score (TPS)¶ | 3.0 (2.0 - 6.5) | 4.0 (2.0 - 6.0) | 0.25 | 5.0 (2.0 - 8.0) | 5.0 (2.0 - 7.0) | 0.38 |
| Non-calcified plaque score (NCPS)¶ | 2.0 (1.0 - 3.0) | 2.0 (1.0 - 4.0) | 0.43 | 2.0 (1.0 - 5.0) | 3.0 (2.0 - 4.0) | 0.17 |
Data presented as N (%), unless noted
<20th percentile cutpoint was determined by the thigh muscle cross-sectional area distribution among HIV-uninfected men in this sample and corresponds to <124.6 cm2.
Median (Interquartile Range) among those with scores >0.
Abbreviations: human immunodeficiency virus (HIV); coronary artery calcium (CAC); total plaque score (TPS); non-calcified plaque score (NCPS)
Of 513 men who underwent thigh muscle mass assessment and non-contrast cardiac CT, no significant associations were found between low muscle mass and prevalent CAC (CAC>0) or prevalent significant CAC (CAC≥100) in any of the multivariable-adjusted models (Table 4). Among 379 men with muscle mass and coronary CTA data, low muscle mass was not significantly associated with the presence of any plaque (TPS >0) and non-calcified plaque (NCPS >0) (Table 4).
Table 4. Adjusted Prevalence Risk Ratios (95% CI) for Subclinical Coronary Atherosclerosis by Muscle Mass Status.
| CAC>0 | CAC≥100 | Coronary stenosis (≥50%) | Any plaque (TPS>0) | Non-calcified plaque (NCPS>0) | |
|---|---|---|---|---|---|
| Low muscle mass* < 20th percentile compared with ≥20th percentile (Ref) | |||||
| N | 268 / 513 | 116 / 513 | 61 / 379 | 312 / 379 | 265 / 379 |
| Model 1† | 1.10 (0.92, 1.33) | 0.92 (0.62, 1.38) | 1.93 (1.16, 3.21) | 0.96 (0.85, 1.09) | 0.91 (0.76, 1.10) |
| Model 2‡ | 1.07 (0.90, 1.29) | 0.81 (0.55, 1.21) | 2.46 (1.51, 4.01) | 0.96 (0.85, 1.09) | 0.93 (0.77, 1.13) |
| Model 3§ | 1.07 (0.88, 1.30) | 0.79 (0.51, 1.21) | 2.04 (1.16, 3.59) | 0.96 (0.84, 1.10) | 0.94 (0.76, 1.16) |
| Model 4‖ | 1.05 (0.87, 1.26) | 0.75 (0.50, 1.14) | 2.33 (1.41, 3.85) | 0.95 (0.84, 1.07) | 0.91 (0.74, 1.11) |
| Model 5¶ | 1.07 (0.90, 1.29) | 0.82 (0.55, 1.22) | 2.48 (1.50, 4.12) | 0.95 (0.84, 1.08) | 0.92 (0.76, 1.12) |
| p-interaction by HIV status# | 0.78 | 0.42 | 0.90 | 0.89 | 0.70 |
| Muscle mass 1 SD lower (cm2) | |||||
| Model 1† | 1.00 (0.92, 1.10) | 1.06 (0.89, 1.27) | 1.19 (0.91, 1.56) | 0.98 (0.93, 1.03) | 0.93 (0.87, 0.99) |
| Model 2‡ | 0.98 (0.89, 1.08) | 0.98 (0.82, 1.17) | 1.30 (1.01, 1.68) | 0.98 (0.93, 1.03) | 0.94 (0.87, 1.01) |
| Model 3§ | 0.97 (0.87, 1.09) | 0.97 (0.78, 1.20) | 1.09 (0.79, 1.50) | 0.98 (0.92, 1.04) | 0.93 (0.85, 1.02) |
| Model 4‖ | 0.97 (0.88, 1.08) | 0.96 (0.80, 1.16) | 1.24 (0.95, 1.61) | 0.98 (0.92, 1.03) | 0.92 (0.86, 1.00) |
| Model 5¶ | 0.98 (0.89, 1.08) | 0.98 (0.82, 1.17) | 1.31 (1.01, 1.69) | 0.97 (0.92, 1.03) | 0.93 (0.87, 1.00) |
<20th percentile cutpoint was determined by the thigh muscle cross-sectional area distribution among HIV-uninfected men in this sample and corresponds to <124.6 cm2.
Model 1: demographic factors: age, race, scanning center, pre/post 2001 cohort and HIV status.
Model 2: model 1 + established cardiovascular risk factors (systolic blood pressure, use of hypertension medications, use of diabetes medications, fasting glucose, total and HDL cholesterol, use of lipid lowering medications, smoking, and Hepatitis C virus infection status.
Model 3: model 2 + body mass index categories (<18, 18-<25, 25-<30, ≥30 kg/m2)
Model 4: model 2 + log-transformed C-reactive protein, log-transformed IL-6, sCD163, sCD14 and log-transformed CCL2
Model 5: model 2 + physical activity (low, medium, high)
Interaction by HIV serostatus, and p-value for linear trend used Model 2.
Abbreviations: human immunodeficiency virus (HIV); coronary artery calcium (CAC); total plaque score (TPS); non-calcified plaque score (NCPS); standard deviation (SD);
However, low muscle mass was significantly associated with an approximately 2.5-fold increased prevalence of obstructive coronary stenosis ≥50% seen on CTA, after adjustment for demographic factors and traditional CVD risk factors [2.46 (95% CI: 1.51, 4.01)] (Table 4, Model 2). This association remained significant and of similar strength in models that further adjusted for potential mediators of this association, including BMI, inflammatory markers, and physical activity. However, no significant interaction by HIV serostatus was observed (p for interaction=0.90). Given a priori interest in differences by HIV serostatus, results of associations between muscle mass and obstructive coronary stenosis stratified by HIV serostatus are shown in Supplemental Table A; However, in the absence of any significant interaction by HIV serostatus, these findings should be considered exploratory. The association of low muscle mass with obstructive CAD remained statistically significant in HIV-infected men even after adjusting for ART and HIV-disease related factors (Supplemental Table A, Model 6). Findings were also generally similar when muscle mass was considered as a continuous variable. Lower muscle mass (per 1 standard deviation lower) was associated with 30% increased risk of obstructive coronary stenosis [1.30 (1.01, 1.68), Table 4, Model 2].
4. Discussion
In this well-characterized, predominantly HIV-infected, population, we found that prevalence of low thigh muscle mass area (<20th percentile) ascertained through a single cross-sectional mid-thigh CT was similar among HIV-infected and HIV-uninfected men. We found no association between low thigh muscle mass and presence of CAC and other types of coronary plaque on CTA. However, a novel observation was that low thigh muscle mass area was associated with a 2.5-fold higher prevalence of moderate to severe subclinical coronary stenosis (≥50%) after adjustment for demographic and traditional CVD risk factors, which remained significant after further adjustments for BMI, inflammatory markers, and physical activity. These findings are clinically relevant since coronary stenosis ≥50% is associated with a 10-fold higher risk for cardiovascular events as well as a 6-fold higher risk for death, myocardial infarction, and unstable angina, independent of CAC.30 Obstructive CAD, even when asymptomatic, is a marker of high CVD risk, implying potential benefit from more intensive preventive efforts (i.e. lifestyle intervention and pharmacotherapies).
To our knowledge, this is the first study to evaluate associations between CT-assessed low muscle mass and subclinical coronary atherosclerosis assessed by both CTA and non-contrast cardiac CT, and to evaluate the effect of HIV serostatus on these associations. Although some studies have evaluated the association of low skeletal muscle mass with subclinical atherosclerosis in other vascular beds (e.g. carotid intimal medial thickness, ankle brachial index),11, 12, 31 few have evaluated subclinical coronary atherosclerosis assessed by cardiac CT,13 a more powerful prognostic indicator of future CAD and CVD risk.32, 33
It is unclear whether low muscle mass leads to obstructive coronary stenosis in a causal fashion, though potential biologic mechanisms that could account for such a causal relationship include insulin resistance, inflammation,9 or reduced physical activity.34 Of note, our results remained significant after further adjustment for physical activity and levels of inflammatory biomarkers, suggesting that these potential mediators did not explain the associations seen. Prospective studies are needed to investigate associations between changes in skeletal muscle mass with progression of coronary artery stenosis over time.
It is uncertain why low thigh muscle mass was not associated with the prevalence of CAC and other types of coronary plaques. A prior study reported that low skeletal muscle mass index was inversely associated with CAC prevalence in the general population.13 Since both sarcopenia and obstructive CAD take time to develop, low muscle mass may be more strongly associated with advanced subclinical CAD than with just the presence of any subclinical coronary atherosclerosis. Perhaps other traditional and non-traditional factors associated with CAD in this population might contribute more strongly to early subclinical CAD and thus might overshadow the contribution from low muscle mass.
We found that HIV-infected men had the same prevalence of low thigh muscle mass area compared to HIV-uninfected men. However, Natsag et al. found that muscle quality was lower among HIV-infected men enrolled in MACS due to greater fatty infiltration despite similar cross-sectional areas.15 We also found that low muscle mass was similarly associated with subclinical obstructive CAD among both HIV-infected and HIV-uninfected men. However given our small sample size and low prevalence of obstructive CAD, we are unable to conclusively exclude the possibility of a difference.
Our study specifically focused on CT-measures of muscle mass. Muscle mass is weakly correlated with muscle strength in MACS,15 and muscle weakness is an component of frailty,35 which in turn is an important prognostic marker of CVD and mortality among older adults and adults with HIV-infection.36-38 Defining frailty by the Fried phenotype,35 MACS found that HIV-infected men aged 50-69 were significantly more likely to be frail compared to similarly-aged HIV-uninfected men,21, 22 and frail HIV-infected men had higher levels of inflammatory markers and immune activation compared to nonfrail HIV-infected men.39 Frailty by the Fried definition was associated with subclinical coronary atherosclerosis in MACS, but only among HIV-uninfected men.22
Despite the well-established association of low muscle mass with other major adverse health outcomes, a “gold standard” for its measurement and definition is still lacking largely because there exist no clear thresholds that distinguish normal from abnormal values.14, 40, 41 Thus, a broad-spectrum of approaches including imaging, functional and biological is currently available for the assessment of muscle mass and functionality in both clinical and research settings.14, 40, 41 Among these methods, the Dual energy X-ray Absorptiometry (DXA) is the most popular for several reasons.14, 40 First, it was used for the initial definition of sarcopenia by Baumgartner et al.42 Second, DXA is relatively inexpensive, sufficiently precise, and has low radiation exposure.14, 40 Nonetheless, DXA presents many limitations.14, 40 For instance, it does not accurately differentiate between water and bone-free lean tissue and can overestimate muscle mass in persons with extracellular fluid overload.43 It also overestimates thigh muscle mass in overweight individuals.44 Therefore, the International Working Group on Sarcopenia considers CT or MRI as the current ‘gold standard’ for measurement of body composition.14 CT is highly reliable and accurate for the measurement of both muscle mass and density14 and cheaper than MRI.14 However, despite its minimal radiation risk,45 CT has a higher radiation exposure compared to both MRI and DXA.14
If results of the present study are confirmed in other populations, this might have potential clinical implications for preventive cardiology. Many older adults might undergo CT imaging for other indications, and potentially, the addition of a single non-contrast mid-thigh CT slice to assess muscle mass could help identify those at higher risk for advanced subclinical coronary atherosclerosis who may benefit from more aggressive risk factor management and preventative therapies.
4.1 Strengths and Limitations
A major strength of this study is the detailed assessment of subclinical coronary atherosclerosis and plaque composition using CTA in addition to non-contrast coronary CT scans in a well-characterized cohort. Nonetheless, this analysis has some limitations: First, MACS is a cohort of men who have sex with men recruited before 2003, and thus results may not be generalizable to women, who have different distributions of body fat than men,46 or to people who acquired HIV through other behavior or more recently. Second, the cross-sectional design of this study precludes determination of temporal relationships and causality. Residual confounding and reverse causation may explain the associations seen, although we adjusted for numerous demographic and clinical factors, and the men were free of clinical CAD at the time of CT scanning. Third, we performed testing of thigh muscle mass with multiple coronary atherosclerosis markers of interest. It is possible that the association we found may be due to chance, although the association with obstructive coronary stenosis was robust across all models tested and was present among individuals with and without HIV-infection. Fourth, there is no consensus on the definition of low muscle mass by thigh CT and we used a cut-point of <20th percentile of our HIV-uninfected sample to be similar to the muscle weakness definition used in the same cohort.21 Thus, this cut-point is somewhat arbitrary and should be considered exploratory; however the associations with obstructive CAD were similar when low muscle mass was treated as a continuous measure (per 1 SD lower).
Conclusion
In summary, low muscle mass was found to be associated with subclinical obstructive coronary stenosis ≥50% but not with presence or extent of specific coronary plaque types, independent of demographics and multiple traditional CVD risk factors. Low mid-thigh muscle mass ascertained through a single non-contrast CT slice may be a marker of more advanced subclinical CAD. Further studies involving larger sample sizes and longitudinal follow up are needed to evaluate the prognostic value of mid-thigh muscle CT assessment in identifying individuals with advanced subclinical CAD who could benefit from more aggressive risk factor management.
Supplementary Material
Acknowledgments
The authors thank the staff and participants of the MACS for their important contributions.
Funding sources: This study is funded by the National Heart, Lung and Blood Institute (grant R01 HL095129 to Dr. Post). The MACS is funded by the National Institute of Allergy and Infectious Diseases (NIAID), with additional supplemental funding from the National Cancer Institute (NCI), the National Institute on Drug Abuse (NIDA), the National Institute of Mental Health (NIMH), and the National Heart, Lung and Blood Institute (NBLBI) as follows: UO1-AI-35042, UL1-RR025005, UM1-AI-35043, UO1-AI-35039, UO1-AI-35040, UO1-AI-35041. Mr. Korada was supported for this work by the American Federation for Aging Research Medical Student Training in Aging Research (NIA – MSTAR) program. Drs. Michos and Zhao are supported by the Blumenthal Scholars Program in Preventive Cardiology. Dr. Brown is supported in part by the National Institute for Allergy and Infectious Diseases (K24 AI120834).
Footnotes
Disclosures: The authors report no conflicts of interest related to this work. Unrelated to this work, TTB has served as a consultant to Gilead Sciences, Abbvie, Merck, Theratechnologies, and EMD-Serono; LPJ has served as a consultant to Bristol Myers-Squibb; EDM received an honorarium from Siemens Healthcare Diagnostics for blinded event adjudication in a trial; FJP has served as a consultant and/or received honoraria from Gilead Sciences, Janssen Pharmaceuticals, Merck and Co, and Bristol Myers Squibb.
Author Contributions: Drs. Michos, Tibuakuu, and Saxena designed the study. Dr. Tibuakuu wrote the initial draft of the manuscript. Dr. Zhao performed the statistical analyses and provided critical revisions to the paper. Dr. Post obtained the NIH-funding for the MACS-CVD ancillary study, was involved in the CT data collection, and provided critical revisions to the paper. Dr. Budoff interpreted the cardiac CT scans for the study (CT Core Lab) and provided critical revisions to the paper. Drs. Brown, Jacobson, Guallar, Palella, Witt, Koletar, Margolick, and Mr. Korada provided critical revisions to the paper. Dr. Michos, Tibuakuu, and Zhao take full responsibility for its content. All authors reviewed the final draft and approve of its submission. The manuscript was also approved by the MACS Executive Committee.
Publisher's Disclaimer: This is a PDF file of an unedited manuscript that has been accepted for publication. As a service to our customers we are providing this early version of the manuscript. The manuscript will undergo copyediting, typesetting, and review of the resulting proof before it is published in its final citable form. Please note that during the production process errors may be discovered which could affect the content, and all legal disclaimers that apply to the journal pertain.
References
- 1.Wada N, Jacobson LP, Cohen M, French A, Phair J, Munoz A. Cause-specific life expectancies after 35 years of age for human immunodeficiency syndrome-infected and human immunodeficiency syndrome-negative individuals followed simultaneously in long-term cohort studies, 1984-2008. Am J Epidemiol. 2013;177:116–25. doi: 10.1093/aje/kws321. [DOI] [PMC free article] [PubMed] [Google Scholar]
- 2.Triant VA, Lee H, Hadigan C, Grinspoon SK. Increased acute myocardial infarction rates and cardiovascular risk factors among patients with human immunodeficiency virus disease. J Clin Endocrinol Metab. 2007;92:2506–12. doi: 10.1210/jc.2006-2190. [DOI] [PMC free article] [PubMed] [Google Scholar]
- 3.Freiberg MS, Chang CC, Kuller LH, Skanderson M, Lowy E, Kraemer KL, Butt AA, Bidwell Goetz M, Leaf D, Oursler KA, Rimland D, Rodriguez Barradas M, Brown S, Gibert C, McGinnis K, Crothers K, Sico J, Crane H, Warner A, Gottlieb S, Gottdiener J, Tracy RP, Budoff M, Watson C, Armah KA, Doebler D, Bryant K, Justice AC. HIV infection and the risk of acute myocardial infarction. JAMA Intern Med. 2013;173:614–22. doi: 10.1001/jamainternmed.2013.3728. [DOI] [PMC free article] [PubMed] [Google Scholar]
- 4.Post WS, Budoff M, Kingsley L, Palella FJ, Jr, Witt MD, Li X, George RT, Brown TT, Jacobson LP. Associations between HIV infection and subclinical coronary atherosclerosis. Ann Intern Med. 2014;160:458–67. doi: 10.7326/M13-1754. [DOI] [PMC free article] [PubMed] [Google Scholar]
- 5.Lo J, Abbara S, Shturman L, Soni A, Wei J, Rocha-Filho JA, Nasir K, Grinspoon SK. Increased prevalence of subclinical coronary atherosclerosis detected by coronary computed tomography angiography in HIV-infected men. AIDS. 2010;24:243–53. doi: 10.1097/QAD.0b013e328333ea9e. [DOI] [PMC free article] [PubMed] [Google Scholar]
- 6.Hanson ED, Srivatsan SR, Agrawal S, Menon KS, Delmonico MJ, Wang MQ, Hurley BF. Effects of strength training on physical function: influence of power, strength, and body composition. J Strength Cond Res. 2009;23:2627–37. doi: 10.1519/JSC.0b013e3181b2297b. [DOI] [PMC free article] [PubMed] [Google Scholar]
- 7.Grant PM, Kitch D, McComsey GA, Collier AC, Bartali B, Koletar SL, Erlandson KM, Lake JE, Yin MT, Melbourne K, Ha B, Brown TT. Long-term body composition changes in antiretroviral-treated HIV-infected individuals. AIDS. 2016;30:2805–2813. doi: 10.1097/QAD.0000000000001248. [DOI] [PMC free article] [PubMed] [Google Scholar]
- 8.Pinto Neto LF, Sales MC, Scaramussa ES, da Paz CJ, Morelato RL. J Infect Dis. 20. Vol. 2016. Brazil: Elsevier Editora Ltda; 2015. Human immunodeficiency virus infection and its association with sarcopenia Braz; pp. 99–102. [DOI] [PMC free article] [PubMed] [Google Scholar]
- 9.Kim TN, Choi KM. The implications of sarcopenia and sarcopenic obesity on cardiometabolic disease. J Cell Biochem. 2015;116:1171–8. doi: 10.1002/jcb.25077. [DOI] [PubMed] [Google Scholar]
- 10.Marzetti E, Calvani R, Cesari M, Buford TW, Lorenzi M, Behnke BJ, Leeuwenburgh C. Mitochondrial dysfunction and sarcopenia of aging: from signaling pathways to clinical trials. Int J Biochem Cell Biol. 2013;45:2288–301. doi: 10.1016/j.biocel.2013.06.024. [DOI] [PMC free article] [PubMed] [Google Scholar]
- 11.den Ouden ME, Schuurmans MJ, Arts IE, Grobbee DE, Bots ML, van den Beld AW, Lamberts SW, van der Schouw YT. Atherosclerosis and physical functioning in older men, a longitudinal study. J Nutr Health Aging. 2013;17:97–104. doi: 10.1007/s12603-012-0424-2. [DOI] [PubMed] [Google Scholar]
- 12.Ochi M, Kohara K, Tabara Y, Kido T, Uetani E, Ochi N, Igase M, Miki T. Arterial stiffness is associated with low thigh muscle mass in middle-aged to elderly men. Atherosclerosis. 2010;212:327–32. doi: 10.1016/j.atherosclerosis.2010.05.026. [DOI] [PubMed] [Google Scholar]
- 13.Ko BJ, Chang Y, Jung HS, Yun KE, Kim CW, Park HS, Chung EC, Shin H, Ryu S. Relationship Between Low Relative Muscle Mass and Coronary Artery Calcification in Healthy Adults. Arterioscler Thromb Vasc Biol. 2016;36:1016–21. doi: 10.1161/ATVBAHA.116.307156. [DOI] [PubMed] [Google Scholar]
- 14.Cesari M, Fielding RA, Pahor M, Goodpaster B, Hellerstein M, van Kan GA, Anker SD, Rutkove S, Vrijbloed JW, Isaac M, Rolland Y, M'Rini C, Aubertin-Leheudre M, Cedarbaum JM, Zamboni M, Sieber CC, Laurent D, Evans WJ, Roubenoff R, Morley JE, Vellas B International Working Group on S. Biomarkers of sarcopenia in clinical trials-recommendations from the International Working Group on Sarcopenia. J Cachexia Sarcopenia Muscle. 2012;3:181–90. doi: 10.1007/s13539-012-0078-2. [DOI] [PMC free article] [PubMed] [Google Scholar]
- 15.Natsag J, Erlandson KM, Sellmeyer DE, Haberlen SA, Margolick J, Jacobson LP, Palella FJ, Jr, Koletar SL, Lake JE, Post WS, Brown TT. HIV Infection Is Associated with Increased Fatty Infiltration of the Thigh Muscle with Aging Independent of Fat Distribution. PLoS One. 2017;12:e0169184. doi: 10.1371/journal.pone.0169184. [DOI] [PMC free article] [PubMed] [Google Scholar]
- 16.Lang T, Cauley JA, Tylavsky F, Bauer D, Cummings S, Harris TB, Health ABCS. Computed tomographic measurements of thigh muscle cross-sectional area and attenuation coefficient predict hip fracture: the health, aging, and body composition study. J Bone Miner Res. 2010;25:513–9. doi: 10.1359/jbmr.090807. [DOI] [PMC free article] [PubMed] [Google Scholar]
- 17.Kaslow RA, Ostrow DG, Detels R, Phair JP, Polk BF, Rinaldo CR., Jr The Multicenter AIDS Cohort Study: rationale, organization, and selected characteristics of the participants. Am J Epidemiol. 1987;126:310–8. doi: 10.1093/aje/126.2.310. [DOI] [PubMed] [Google Scholar]
- 18.Hacioglu Y, Gupta M, Choi TY, George RT, Deible CR, Jacobson LP, Witt MD, Palella FJ, Post WS, Budoff MJ. Use of cardiac CT angiography imaging in an epidemiology study - the Methodology of the Multicenter AIDS Cohort Study cardiovascular disease substudy. Anadolu Kardiyol Derg. 2013;13:207–14. doi: 10.5152/akd.2013.065. [DOI] [PMC free article] [PubMed] [Google Scholar]
- 19.Goodpaster BH, Thaete FL, Simoneau JA, Kelley DE. Subcutaneous abdominal fat and thigh muscle composition predict insulin sensitivity independently of visceral fat. Diabetes. 1997;46:1579–85. doi: 10.2337/diacare.46.10.1579. [DOI] [PubMed] [Google Scholar]
- 20.Goodpaster BH, Kelley DE, Thaete FL, He J, Ross R. Skeletal muscle attenuation determined by computed tomography is associated with skeletal muscle lipid content. J Appl Physiol (1985) 2000;89:104–10. doi: 10.1152/jappl.2000.89.1.104. [DOI] [PubMed] [Google Scholar]
- 21.Althoff KN, Jacobson LP, Cranston RD, Detels R, Phair JP, Li X, Margolick JB, Multicenter ACS. Age, comorbidities, and AIDS predict a frailty phenotype in men who have sex with men. J Gerontol A Biol Sci Med Sci. 2014;69:189–98. doi: 10.1093/gerona/glt148. [DOI] [PMC free article] [PubMed] [Google Scholar]
- 22.Korada SKC, Zhao D, Tibuakuu M, Brown TT, Jacobson LP, Guallar E, Bolan RK, Palella FJ, Margolick JB, Martinson JJ, Budoff MJ, Post WS, Michos ED. Frailty and subclinical coronary atherosclerosis: The Multicenter AIDS Cohort Study (MACS) Atherosclerosis. 2017;266:240–247. doi: 10.1016/j.atherosclerosis.2017.08.026. [DOI] [PMC free article] [PubMed] [Google Scholar]
- 23.McKibben RA, Margolick JB, Grinspoon S, Li X, Palella FJ, Jr, Kingsley LA, Witt MD, George RT, Jacobson LP, Budoff M, Tracy RP, Brown TT, Post WS. Elevated levels of monocyte activation markers are associated with subclinical atherosclerosis in men with and those without HIV infection. J Infect Dis. 2015;211:1219–28. doi: 10.1093/infdis/jiu594. [DOI] [PMC free article] [PubMed] [Google Scholar]
- 24.Austen WG, Edwards JE, Frye RL, Gensini GG, Gott VL, Griffith LS, McGoon DC, Murphy ML, Roe BB. A reporting system on patients evaluated for coronary artery disease. Report of the Ad Hoc Committee for Grading of Coronary Artery Disease, Council on Cardiovascular Surgery, American Heart Association. Circulation. 1975;51:5–40. doi: 10.1161/01.cir.51.4.5. [DOI] [PubMed] [Google Scholar]
- 25.Craig CL, Marshall AL, Sjostrom M, Bauman AE, Booth ML, Ainsworth BE, Pratt M, Ekelund U, Yngve A, Sallis JF, Oja P. International physical activity questionnaire: 12-country reliability and validity. Med Sci Sports Exerc. 2003;35:1381–95. doi: 10.1249/01.MSS.0000078924.61453.FB. [DOI] [PubMed] [Google Scholar]
- 26.Levey AS, Bosch JP, Lewis JB, Greene T, Rogers N, Roth D. A more accurate method to estimate glomerular filtration rate from serum creatinine: a new prediction equation. Modification of Diet in Renal Disease Study Group. Ann Intern Med. 1999;130:461–70. doi: 10.7326/0003-4819-130-6-199903160-00002. [DOI] [PubMed] [Google Scholar]
- 27.Bahrami H, Budoff M, Haberlen SA, Rezaeian P, Ketlogetswe K, Tracy R, Palella F, Witt MD, McConnell MV, Kingsley L, Post WS. J Am Heart Assoc. 5. Vol. 2016. England: The Authors Published on behalf of the American Heart Association Inc., by Wiley Blackwell; 2016. Inflammatory Markers Associated With Subclinical Coronary Artery Disease: The Multicenter AIDS Cohort Study. [DOI] [PMC free article] [PubMed] [Google Scholar]
- 28.Jenny NS, Brown ER, Detrano R, Folsom AR, Saad MF, Shea S, Szklo M, Herrington DM, Jacobs DR., Jr Associations of inflammatory markers with coronary artery calcification: results from the Multi-Ethnic Study of Atherosclerosis. Atherosclerosis. 2010;209:226–9. doi: 10.1016/j.atherosclerosis.2009.08.037. [DOI] [PMC free article] [PubMed] [Google Scholar]
- 29.Atkins JL, Whincup PH, Morris RW, Lennon LT, Papacosta O, Wannamethee SG. Sarcopenic obesity and risk of cardiovascular disease and mortality: a population-based cohort study of older men. J Am Geriatr Soc. 2014;62:253–60. doi: 10.1111/jgs.12652. [DOI] [PMC free article] [PubMed] [Google Scholar]
- 30.Bamberg F, Sommer WH, Hoffmann V, Achenbach S, Nikolaou K, Conen D, Reiser MF, Hoffmann U, Becker CR. Meta-analysis and systematic review of the long-term predictive value of assessment of coronary atherosclerosis by contrast-enhanced coronary computed tomography angiography. J Am Coll Cardiol. 2011;57:2426–36. doi: 10.1016/j.jacc.2010.12.043. [DOI] [PubMed] [Google Scholar]
- 31.Kato A, Ishida J, Endo Y, Takita T, Furuhashi M, Maruyama Y, Odamaki M. Association of abdominal visceral adiposity and thigh sarcopenia with changes of arteriosclerosis in haemodialysis patients. Nephrol Dial Transplant. 2011;26:1967–76. doi: 10.1093/ndt/gfq652. [DOI] [PubMed] [Google Scholar]
- 32.Yeboah J, McClelland RL, Polonsky TS, Burke GL, Sibley CT, O'Leary D, Carr JJ, Goff DC, Greenland P, Herrington DM. Comparison of novel risk markers for improvement in cardiovascular risk assessment in intermediate-risk individuals. JAMA. 2012;308:788–95. doi: 10.1001/jama.2012.9624. [DOI] [PMC free article] [PubMed] [Google Scholar]
- 33.Gepner AD, Young R, Delaney JA, Budoff MJ, Polak JF, Blaha MJ, Post WS, Michos ED, Kaufman J, Stein JH. Comparison of Carotid Plaque Score and Coronary Artery Calcium Score for Predicting Cardiovascular Disease Events: The Multi-Ethnic Study of Atherosclerosis. J Am Heart Assoc. 2017;6 doi: 10.1161/JAHA.116.005179. [DOI] [PMC free article] [PubMed] [Google Scholar]
- 34.Lavie CJ, Arena R, Swift DL, Johannsen NM, Sui X, Lee DC, Earnest CP, Church TS, O'Keefe JH, Milani RV, Blair SN. Exercise and the cardiovascular system: clinical science and cardiovascular outcomes. Circ Res. 2015;117:207–19. doi: 10.1161/CIRCRESAHA.117.305205. [DOI] [PMC free article] [PubMed] [Google Scholar]
- 35.Fried LP, Tangen CM, Walston J, Newman AB, Hirsch C, Gottdiener J, Seeman T, Tracy R, Kop WJ, Burke G, McBurnie MA Cardiovascular Health Study Collaborative Research G. Frailty in older adults: evidence for a phenotype. J Gerontol A Biol Sci Med Sci. 2001;56:M146–56. doi: 10.1093/gerona/56.3.m146. [DOI] [PubMed] [Google Scholar]
- 36.Kulmala J, Nykanen I, Hartikainen S. Frailty as a predictor of all-cause mortality in older men and women. Geriatr Gerontol Int. 2014;14:899–905. doi: 10.1111/ggi.12190. [DOI] [PubMed] [Google Scholar]
- 37.Guaraldi G, Brothers TD, Zona S, Stentarelli C, Carli F, Malagoli A, Santoro A, Menozzi M, Mussi C, Mussini C, Kirkland S, Falutz J, Rockwood K. A frailty index predicts survival and incident multimorbidity independent of markers of HIV disease severity. AIDS. 2015;29:1633–41. doi: 10.1097/QAD.0000000000000753. [DOI] [PubMed] [Google Scholar]
- 38.Desquilbet L, Jacobson LP, Fried LP, Phair JP, Jamieson BD, Holloway M, Margolick JB. A frailty-related phenotype before HAART initiation as an independent risk factor for AIDS or death after HAART among HIV-infected men. J Gerontol A Biol Sci Med Sci. 2011;66:1030–8. doi: 10.1093/gerona/glr097. [DOI] [PMC free article] [PubMed] [Google Scholar]
- 39.Margolick JB, Bream JH, Martinez-Maza O, Lopez J, Li X, Phair JP, Koletar SL, Jacobson LP. Frailty and Circulating Markers of Inflammation in HIV+ and HIV- Men in the Multicenter AIDS Cohort Study. J Acquir Immune Defic Syndr. 2017;74:407–417. doi: 10.1097/QAI.0000000000001261. [DOI] [PMC free article] [PubMed] [Google Scholar]
- 40.Tosato M, Marzetti E, Cesari M, Savera G, Miller RR, Bernabei R, Landi F, Calvani R. Aging Clin Exp Res. 29. Vol. 2017. Germany: Measurement of muscle mass in sarcopenia: from imaging to biochemical markers; pp. 19–27. [DOI] [PubMed] [Google Scholar]
- 41.Marzetti E. Editorial: Imaging, Functional and Biological Markers for Sarcopenia: The Pursuit of the Golden Ratio. J Frailty Aging. 2012;1:97–8. doi: 10.14283/jfa.2012.15. [DOI] [PubMed] [Google Scholar]
- 42.Baumgartner RN, Koehler KM, Gallagher D, Romero L, Heymsfield SB, Ross RR, Garry PJ, Lindeman RD. Epidemiology of sarcopenia among the elderly in New Mexico. Am J Epidemiol. 1998;147:755–63. doi: 10.1093/oxfordjournals.aje.a009520. [DOI] [PubMed] [Google Scholar]
- 43.Proctor DN, O'Brien PC, Atkinson EJ, Nair KS. Comparison of techniques to estimate total body skeletal muscle mass in people of different age groups. Am J Physiol. 1999;277:E489–95. doi: 10.1152/ajpendo.1999.277.3.E489. [DOI] [PubMed] [Google Scholar]
- 44.Bredella MA, Ghomi RH, Thomas BJ, Torriani M, Brick DJ, Gerweck AV, Misra M, Klibanski A, Miller KK. Comparison of DXA and CT in the assessment of body composition in premenopausal women with obesity and anorexia nervosa. Obesity (Silver Spring) 2010;18:2227–33. doi: 10.1038/oby.2010.5. [DOI] [PMC free article] [PubMed] [Google Scholar]
- 45.Levine JA, Abboud L, Barry M, Reed JE, Sheedy PF, Jensen MD. Measuring leg muscle and fat mass in humans: comparison of CT and dual-energy X-ray absorptiometry. J Appl Physiol (1985) 2000;88:452–6. doi: 10.1152/jappl.2000.88.2.452. [DOI] [PubMed] [Google Scholar]
- 46.Goodman-Gruen D, Barrett-Connor E. Sex differences in measures of body fat and body fat distribution in the elderly. Am J Epidemiol. 1996;143:898–906. doi: 10.1093/oxfordjournals.aje.a008833. [DOI] [PubMed] [Google Scholar]
Associated Data
This section collects any data citations, data availability statements, or supplementary materials included in this article.