Abstract
Glioblastoma (GBM) is the most common, aggressive, and deadly form of adult brain cancer, and is associated with a short survival rate (median 12–15 months, 5+ year less than 5%). The complex tumor microenvironment includes matrix transitions at the tumor margin, such as gradations in hyaluronic acid (HA). In addition, metabolic stress induced by decreased oxygen content across the tumor may contribute to tumor progression. However, cross-talk between matrix composition and metabolic stress remains unclear. In this study, we fabricated an in vitro brain memetic HA-decorated gelatin hydrogel platform incorporating variable oxygen concentrations to mimic intra-tumoral hypoxia. We observed that EGFR status (wildtype vs. a constitutively active EGFRvIII mutant) of U87 GBM cells affected proliferation and metabolic activity in response to hypoxia and matrix-bound HA. The use of an invasion assay revealed that invasion was significantly enhanced in both cell types under hypoxia. Moreover, we observed compensatory secretion of soluble HA in cases of enhanced GBM cell invasion, consistent with our previous findings using other GBM cell lines. Interestingly, U87 GBM cells adapted to hypoxia by shifting toward a more anaerobic metabolic state, a mechanism that may contribute to GBM cell invasion. Collectively, these data demonstrate that the use of a three-dimensional hydrogel provides a robust method to study the impact of matrix composition and metabolic challenges on GBM cell invasion, a key factor contributing to the most common, aggressive, and deadly form of adult brain cancer.
Keywords: Glioblastoma, hypoxia, hyaluronic acid, hydrogel, invasion
Graphical abstract
1. Introduction
Glioblastoma (GBM, WHO grade IV astrocytoma) is the most common and deadly form of primary brain cancer. GBM is associated with rapid, diffuse infiltration throughout the brain and with short median survival rate (≈ 15 months) and long term (5 years or more) survival rate less than 5%.1–4 Unlike some solid tumors,5, 6 GBM rarely metastasizes outside the brain.7 Rather, GBM cells invade diffusively throughout the brain via existing structural paths such as white matter tracts and blood vessels.8–10 Moreover, unlike surgical removal of many tumors where wide margins or total resection of the surrounding tissue is possible, GBM resection (‘debulking’) requires conservative, sharply defined surgical margins. Not surprisingly, GBM tumors rapidly recur (median: 6.9 mo post debulking) at a site typically in close proximity (>90% within 2 cm) of the original resection cavity.11 Current treatment modalities, i.e. surgery followed by radiation with concomitant and adjuvant temozolomide (TMZ), have extended patient survival, though minimally (≈ 2.5 mo).1, 12, 13 Therefore, it is essential to improve our understanding of the invasive spreading of GBM cells at the tumor margins to identify novel approaches to minimize cell invasion and combat tumor recurrence.
The highly heterogeneous tumor microenvironment (TME) of GBM substantially complicates mechanistic studies of GBM cell invasion. Specifically, the brain is comprised largely of vasculature and cellular components, including neurons, glial cells, and microglia.14–16 The quantity of extracellular matrix is relatively low, with hyaluronic acid (HA) being the main glycosaminoglycan component.14 In mammals, HA is naturally and constantly produced and degraded by the two families: hyaluronan synthase and hyaluronidase, which provide a varied molecular weight distribution (High MW:>500kDa, Medium MW: 50–350 kDa, Low MW: <30 kDa) present in the brain and TME.17–20 Relative to brain tissue, GBM tumors contain high concentration of HA over a range of molecular weights as well as fibrous molecules such as collagen, fibronectin, laminins and vitronectins.14–16 The use of tissue engineering-based in vitro platforms is emerging as an approach to study processes associated with invasive spreading in GBM. Building on more conventional Boyden chamber and two-dimensional scratch/exclusion assay,21 efforts have recently turned towards three-dimensional hydrogel systems such as collagen, Matrigel, polyethylene glycol (PEG), and HA hydrogels. Kumar et al., using 2D polyacrylamide substrates and 3D HA hydrogels, showed that matrix stiffness and HA both alter GBM proliferation as well as the mode and speed of invasion.22–24 Similarly, Sirianni et al. showed invasion and proliferation patterns were significantly altered as a result of the biophysical properties of a HA-decorated gelatin hydrogel, finding increased matrix stiffness significantly decreased GBM invasion.25 Our efforts using methacrylamide-functionalized gelatin (GelMA) hydrogels, where the amount of photoimmobilized HA (0 – 15% w/w) could be adjusted independent of hydrogel modulus, showed that while increasing the amount of matrix-immobilized HA reduced invasion by U251 GBM cells, invasion was strongly linked to endogenous production of soluble HA.26
While matrix biophysical cues (e.g. composition, stiffness) alter invasion, the GBM TME is also marked by significant transitions in its metabolic environment, such as oxygen gradients across the tumor. Tumor margins contain hypoxic foci surrounded by hypercellular zones (pseudopalisades) flanked by regions of vascularized stroma (perivascular niches) believed to promote invasion27 and contribute to the poor prognosis of GBM.28 While physiological levels of oxygen in the brain (~5–7% O2; physioxia)29 are reduced compared to most tissues and conventional in vitro culture environments, levels of hypoxia often observed in primary brain tumors like GBM are < 2% O2.30 Glucose metabolism, a primary means of energy conservation in the brain, is strongly affected in GBM cells by oxygen levels.31 When cultured under hypoxia in 2D culture or Boyden chambers, GBM cells became more invasive.29, 32–34 However, these 2D approaches preclude study of the convergence of matrix biophysical and metabolic signals in the context of GBM invasion. Hence, it is critical to develop an engineered system to examine how metabolic cues together with matrix biophysical properties jointly influence the invasive phenotype of GBM.
The aim of this study was to evaluate the combined effects of metabolic constraint and matrix-bound HA on the invasive spreading of GBM cells over a period of up to 7 days within a GelMA hydrogel. A series of proteomic and genomic screens was used to investigate how the convergence of matrix and metabolic signals altered invasive phenotype of GBM cells with disparate epidermal growth factor receptor (EGFR) phenotypes. EGFR expression is overexpressed in greater than 50% of GBM patients,35, 36 with about half of those overexpressed cases bearing the constitutively activated type III mutant (EGFRvIII), which exhibits ligand-independent constitutive activation associated with enhanced proliferation, invasion, and therapeutic resistance.37–40 Here, we examined the activity of EGFR wt vs. vIII mutant GBM cells under normoxic (20% O2) or hypoxic (1% O2) conditions using a series of HA modified GelMA hydrogels previously shown to alter the malignant phenotype of U87 GBM cells.41, 42
2. Materials and Methods
2.1. Hydrogel fabrication and characterization
Methacrylated gelatin (GelMA) and methacrylated hyaluronic acid (HAMA) precursors and hydrogels were fabricated and mechanically tested as previously described.26, 43 Briefly, gelatin (Type A, 300 bloom from porcine skin, Sigma Aldrich, St. Louis, MA) was dissolved in phosphate buffered saline (PBS; Lonza, Basel, Switzerland) at 60°C and methacrylic anhydride (MA; Sigma Aldrich) was then slowly added into the gelatin-PBS solution. Reaction was allowed for one hour, then dialyzed (12–14 kDa, Fisher, Pittsburgh, PA) for one week in 40°C deionized water (DI water), followed by isolation via lyophilization. Similarly, HAMA was synthesized by addition of 10 mL MA dropwise into a 4°C HA sodium salt solution (1 g in 100 mL DI; 60 kDa; Lifecore Biomedical, Chaska, MN). The pH was adjusted to 8 via 5 N sodium hydroxide (NaOH; Sigma Aldrich), and the reaction was proceeded at 4°C overnight. The product was then purified via similar dialysis and lyophilization steps as GelMA. The degree of MA functionalization of both GelMA and HAMA was determined by 1H NMR (≈ 50% degree of functionalization, data not shown).43
Hydrogels (GelMA +/− HAMA) were prepared from lyophilized mixtures of GelMA and HAMA in PBS at a total concentration of 4 wt%. The mixture was then photopolymerized under UV light (AccuCure LED 365 nm, Intensity 7.1 mW/cm2 for 30 s) in the presence of a lithium acylphosphinate (LAP) photoinitiator (PI) as previously described (PI adjusted to maintain same elastic modulus).44 Cell containing hydrogels were made similarly but with addition of cell (4*106 cells/mL hydrogel solution) to the pre-polymer solution prior to being placed into Teflon molds (0.2 mm thick, 5 mm radius) and photopolmerized. The compressive modulus of each hydrogel variant was measured using an Instron 5943 mechanical tester (Instron, Norwood, MA). Briefly, hydrogels were tested under unconfined compression with a pre-load 0.005 N at the rate of 0.1 mm/min, with the Young’s modulus obtained from the linear region of the stress-strain curve (0–10 % strain) as previously described.43 Details regarding the elastic moduli of hydrogels as a function of hydrogel compositions are listed in Supplemental Table 1.
2.2. Culture of U87 and U87vIII cells in hydrogels in the presence or absence of hypoxia
U87 and U87 EGFRvIII mutant cells (U87vIII) were provided by Dr. Nathan Price (Institute for Systems Biology, Seattle, WA). Cells were cultured in Dulbecco’s modified eagle medium (DMEM; Carlsbad, CA) supplemented with 10% fetal bovine serum (FBS; Atlanta Biologicals, Flowery Branch, GA) and 1% penicillin/streptomycin (Lonza) at 37°C in a 5% CO2 environment and passaged upon confluence. At the start of each experiment, cells were homogeneously mixed with the pre-polymerized hydrogel solution at a density of 1 × 10⁵ cells/25 μl hydrogel then photopolymerized as described above. Cell-seeded hydrogels were incubated in cell culture medium at 37°C, 5% CO2 in low adhesion well-plates containing standard culture media with ~20% O2 (normoxia) or 1% O2 (hypoxia) in a dedicated, computer controlled hypoxia chamber (C-Chamber Hypoxia Chamber, Biospherix™, Parish, NY) within the cell culture incubator. Media were changed at days 3 and 5 for cultures extending to 7 days. Media exchange for samples in the hypoxia chamber was performed using culture media pre-conditioned in the hypoxia chamber for at least 12 hours.
2.3 Measuring cell invasion within hydrogels via a bead-based assay
Invasion of GBM cells within the hydrogel was performed using a bead assay as previously described.26 Briefly, collagen-coated dextran beads (≈200 μm in diameter; GE Life Sciences, Pittsburgh, PA) were incubated with a suspension of GBM cells (5000 beads + 2*106 cells in 5 ml media). The cell-seeded beads were then encapsulated within the hydrogel, with cell migration distance measured from the bead surface via ImageJ from time-lapse images acquired via bright field microscopy. Cell invasion was calculated as both the mean invasion distance of all cells from the surface of the bead and as the mean invasion distance of the most invasive 10% of all cells.26
2.4. Evaluating cell number and metabolic activity
The total number and metabolic activity of cells encapsulated (1*105 cells per hydrogel) within hydrogel variants and in response to hypoxic challenge was traced over the 7-day culture period. The total metabolic activity of cell-seeded hydrogels was determined using a commercial dimethylthiazol-diphenyltetrazolium bromide (MTT) assay (Molecular Probes, Waltham MA) following the manufacturer’s protocol.45 Metabolic activity was measured immediately following hydrogel encapsulation (day 0) and then subsequently at days 3, 5 and 7, with metabolic activity measured by absorbance using a microplate reader at 540 nm (Synergy HT, Biotek, Vermont, VT). Results are reported as fold change relative to day 0 (~1 hr following encapsulation). Total cell number were determined via DNA quantification46, 47 via a Hoechst 33528 dye (Invitrogen Waltham, MA) on cell containing hydrogels digested via Papain (Sigma–Aldrich). Cell number were determined via a F200 spectrophotometer (Tecan; 36 0/46 5 nm excitation/emission), with results again reported as fold change relative to day 0 (immediately following encapsulation).
2.5. RNA isolation and gene expression
Expression of targeted genes by cells encapsulated within hydrogels was determined by real-time polymerase chain reaction (RT-PCR) via methods previously validated for this hydrogel system.41, 45, 48 RNA was extracted from cell containing hydrogels via the RNeasy Plant Mini kit (Qiagen, Valencia, CA) and then reverse transcribed to cDNA in a Bio-Rad (Hercules, CA) S1000 thermal cycler with QuantiTect Reverse Transcription kit (Qiagen). RT-PCR was then performed in triplicates using QuantiTect SYBR Green PCR kit (Qiagen) with an Applied Biosystems 7900HT Fast Real-Time PCR System (Carlsbad). Primers were synthesized by Integrated DNA Technologies (Supplemental Table 2) using sequences derived from the literature. Results were described as fold change to day 0 samples (GBM cells immediately after encapsulation).
2.6. Protein isolation and Western blotting
Protein isolation and Western blotting procedures followed previously published methods.49 Briefly, proteins were extracted from cell containing hydrogels by immersing the samples in 0°C RIPA buffer for 30 minutes. Total protein concentration in the lysates was determined by BCA assay (Bio-Rad). Lysates were then mixed with 4x Laemmli Sample Buffer (Bio-Rad) and loaded (5 μg protein in 15 μl per lane for day 7 samples; 3 μg protein in 15 μl per lane for 6, 12, 24 hr samples) onto polyacrylamide gels (4%–20%; Bio-Rad). Gel electrophoresis was performed at 150 V, with proteins then transferred onto nitro-cellulose membranes using Trans-Blot SD (Bio-Rad). Membranes were blocked in 5% bovine serum albumin (BSA; Sigma) in Tris-buffered saline (TBS) or 5% non-fat dry milk (NFDM; Saco, Middleton, WI) in TBS with gentle shaking, then incubated with primary antibodies (Supplemental Table 3) at 4°C overnight. Membranes were subsequently washed by TBS, then incubated with a secondary antibody for 2 hours at room temperature. Signals were visualized using an Image Quant LAS 4010 (GE Healthcare), with band intensities quantified using ImageJ and normalized to β-actin expression and fold change relative to GelMA hydrogels (−HAMA) under normoxia.
2.7. Quantifying secretion of soluble hyaluronic acid
Total soluble hyaluronic acid (HA) produced by cell-seeded hydrogels over 7 days in culture was quantified from media samples via enzyme-linked immunosorbent assay (ELISA; R&D systems, Minneapolis, MN) following the manufacturer’s instructions. HA production was quantified over short term (6, 12, and 24 hours) and long term (days 3, 5, and 7) culture. Samples were analyzed via a microplate reader (Synergy HT, Biotek) with 450/540 nm wavelength absorbance.
2.8. Statistics
Statistical analysis was performed using one-way analysis of variance (ANOVA) followed by Tukey-HSD post-hoc tests. A minimum of n = 3 (MTT, Hoechst assay, ELISA, PCR, Western) samples were used for all assays. Statistical significance was set at p < 0.05. Error is reported as the standard error of the mean unless otherwise stated.
3. Results and Discussion
Biophysical and biochemical aspects of the GBM tumor microenvironment, such as matrix composition and oxygen gradients, provide important signals that may strongly influence GBM cell activity. Here, we examined the combined effects of matrix-immobilized HA and hypoxia on the behavior of GBM cells encapsulated within a three-dimensional hydrogel. Specifically, we investigated how U87 and U87vIII GBM cells responded to biophysical cues and metabolic constraints by using a previously described GelMA-based and selectively-immobilized HAMA hydrogel (+/− 15 w/w% HAMA) platform under controlled oxygen conditions representative of normoxia (20% O2) or hypoxia (1% O2).26, 43
3.1. Hypoxia reduces the number and metabolic activity of GBM cells in an EGFR status-dependent manner
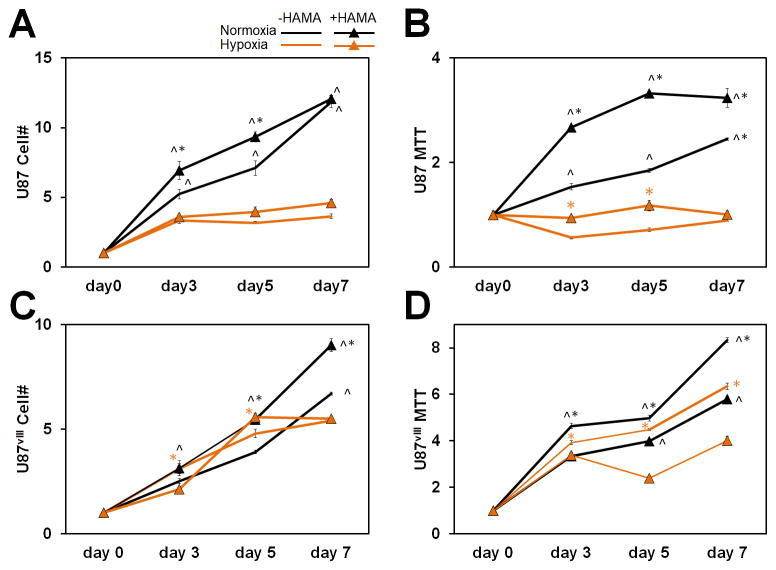
We first examined cell proliferation and overall metabolic activity of GBM cultures under different culture conditions. In general, the number of GBM cells and their total metabolic activity per hydrogel increased with culture time. The expansion of U87 and U87vIII cells was influenced by hypoxia and matrix HA content, with cell expansion generally greater in HA-decorated hydrogels. Intriguingly, hypoxia led to a significant reduction in the number of U87 cells by day 3, while U87vIII cell numbers continued to rise through day 5 before significant reductions were observed as a result in hypoxia (Figure 1A, 1C). Shifts in cell metabolic activity were largely similar. Overall, the metabolic activity of U87 cells was greater (p < 0.05) under normoxia and when cells were within HA-decorated hydrogels. Under hypoxia, the metabolic activity of U87 cells remained largely unchanged over the 7-day culture and was not affected by the presence or absence of matrix-bound HA. U87vIII GBM cells exhibited very different trends. While, in general, U87vIII also showed reduced metabolic activity under hypoxia vs. normoxia, the effects were diminished relative to U87 cells (Figure 1B, 1D). The metabolic activity of U87 and U87vIII cells also showed different responses as a result of matrix-bound HA. U87 cells showed increased or similar metabolic activity in the presence of matrix-bound HA at all times, while U87vIII cells showed significantly decreased metabolic activity in the presence of matrix-bound HA. These results indicate that EGFR status significantly impacts cell proliferation and metabolic activity in response to hypoxia and matrix-bound HA, consistent with the recent demonstration that EGFR is a crucial element in mechanosensing,23, 50 which could directly impact cell proliferation.
Figure 1.
(A) Cell number fold change and (B) metabolic activity fold change of U87 relative to day 0 (immediately measured after seeded in hydrogels). (C) Cell number fold change and (D) metabolic activity fold change of U87vIII relative to day 0. ^ significant (p < 0.05) between +/− hypoxia; * significant (p < 0.05) between +/− HAMA.
Hypoxia represents a firmly established characteristic of the tumor microenvironment capable of reprogramming GBM cell metabolism and driving tumor malignancy and aggressiveness.51 Intriguingly, proliferation decreased for both U87 and U87vIII cells under hypoxia compared to normoxia (Figure 1) in our culture platform. Thus, these data collectively demonstrate the converged effects of matrix-composition and metabolic constraint on U87 and U87vIII GBM cells.
3.2. Rapid HIF-1α stabilization in response to hypoxia
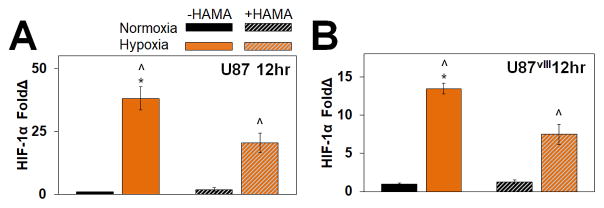
We subsequently confirmed that U87 and U87VIII respond to hypoxia via changes in expression of hypoxia-inducible factor (HIF), a transcription factor triggered under hypoxia and known to activate numerous pathways involved in proliferation, invasion and angiogenesis.33, 34, 37, 51, 52 HIF-1α expression was determined via Western blot for GBM specimens at short-term normoxic or hypoxic timepoints (6, 12 and 24 hr). HIF-1α levels increased rapidly, with significantly enhanced expression after 12 and 24 hours for U87 and U87vIII cells in both HA-decorated and HA-free GelMA hydrogels (Figure 2, Figure S1). However, upregulation of HIF-1α under hypoxia was transient, with increased expression no longer observed after 72 hr (data not shown). The rapid stabilization of HIF-1α as short as 6 hr (−HAMA samples) and 12 hr for all groups and subsequent decreased expression are consistent with the canonical paradigm of HIF-regulated response to hypoxia.53
Figure 2.
Quantified protein expression of HIF-1α of 12 hr samples for (A) U87 and (B) U87vIII GBM cells. Immunofluorescence staining of U87 cells cultured in GelMA hydrogel for 24 hours. ^ significant (p < 0.05) between +/− hypoxia; * significant (p < 0.05) between +/− HAMA.
3.3. Hypoxia promotes shifts in ERK activation and PI3K expression
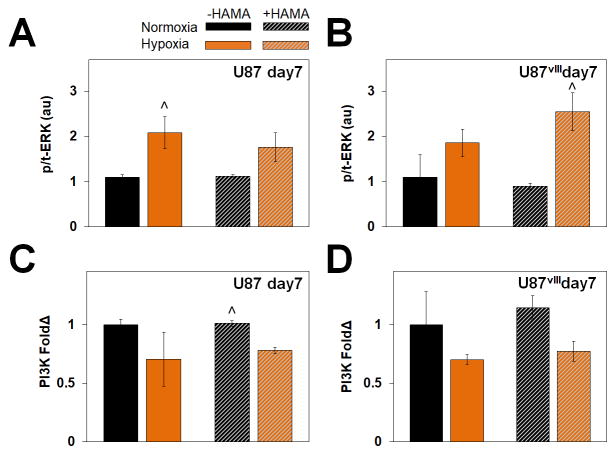
We subsequently examined two related downstream targets regulated by HIF. The mitogen-activated protein kinase (MAPK)/extracellular regulated kinase (ERK) pathway promotes GBM malignancy and invasive behavior,52, 54, 55 while phosphoinositide 3-kinase (PI3K) is associated more generally with cell proliferation and growth.56 We examined protein expression of phosphorylated to total ERK (p-/t-ERK) and PI3K after 7 days in the hydrogels via Western blot analysis, with results normalized to β-actin expression as well as to the normoxia condition in GelMA only (−HAMA) hydrogel. While ERK phosphorylation was significantly increased in response to hypoxia (Figure 3, Figure S2), PI3K expression was down regulated under hypoxia.
Figure 3.
Protein expression via (A) representative Western blots and (B) quantified results relative to −HAMA -hypoxia samples for U87 (left) and U87vIII (right). Overall, ERK showed no specific trend but phosphorylated ERK (p-ERK) expression was upregulated under hypoxia. ^ significant (p < 0.05) for +/− hypoxia.
PI3K is involved in signal transduction pathways regulating cell proliferation and glycolytic metabolism. The downregulation of PI3K in hypoxia likely underlies the decrease in proliferation and metabolic activity under hypoxia observed herein and by others.56, 57 Furthermore, downregulation of PI3K in longer term culture likely reflects the transient expression of HIF-1α as also demonstrated by others.56, 57 Cells under hypoxia also exhibit more phosphorylated ERK,52, 58 a crucial step in signal transduction.59 The observation of hypoxia-dependent, but not matrix-bound HA, activation of p/t-ERK in the longer culture (7 days) is consistent with the HIF family being the main regulators of the p-/t-ERK pathway. Decreased cell proliferation under hypoxia in conjunction with an increase in p/t-ERK, but downregulation of PI3K indicates a potential switch away from a proliferative towards a more invasive phenotype in order to escape microenvironmental stress associated with hypoxia.
3.4. Hypoxia increases GBM invasion in gelatin hydrogels independent of HA content
With the observed activation of ERK and deactivation of PI3K in response to hypoxia, we then examined whether the dual signals of hypoxia and matrix-immobilized HA altered GBM invasion patterns. GBM invasion was measured via a bead assay our lab previously described.26 Invasion of both U87 and U87vIII cells decreased in the presence of matrix-bound HA, consistent with previous findings using our GelMA hydrogel system but a different GBM cell line (U251 cells).26 Strikingly, both U87 and U87vIII GBM cells showed significantly increased average invasion distance under hypoxia compared to normoxia (Figure 4, Figure S4, Figure S5). These finding are consistent with previous studies showing hypoxia contributes to cell invasion as well as metastasis in numerous cancer types both in vivo and in vitro.33, 60, 61 Additionally, the increased cell invasion agrees with the increase in activated ERK, an upstream regulator of cell migration and invasion.52, 58 Potentially more interesting is how the observed decrease in proliferation may relate to the activation of ERK and the upregulation of invasion. The dichotomy of invasive or proliferative phenotype of cells was observed in 1996 by Berens et al.56 and explained in detail by Hatzikirou et al.57 in a proposed Go-or-Grow hypothesis. This hypothesis posits that cells under high nutrient conditions exhibit highly proliferative phenotypes, in contrast to more invasive phenotypes when exposed to hostile, metabolically challenging environments. Our results suggest this Go-or-Grow theory is applicable in U87 and U87vIII models and may explain the increased invasive potential of GBM in hypoxia.
Figure 4.
Average invasion distance for (A) U87 and (B) U87vIII cells. Invasion distance significantly upregulated under hypoxia culture for all conditions. Cells also invade more in hydrogels without HAMA (mostly, not all significant). ^ significant (p < 0.05) for +/− hypoxia; * significant (p < 0.05) for +/− HAMA.
3.5. Upregulation of matrix remodeling-associated genes under hypoxia
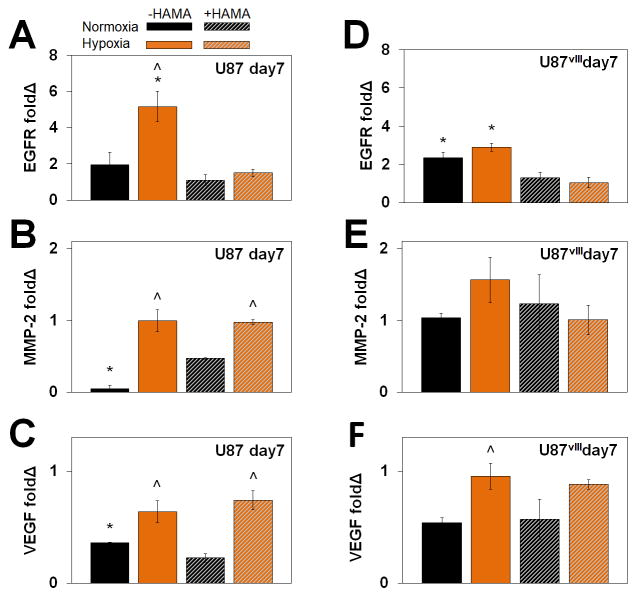
We also examined expression of a panel of invasion and malignancy-associated genes via RT-PCR, with data from day 7 samples in hydrogels normalized to cells prior to seeding within the hydrogel (day 0) (Figure 5, Figure S3). Specifically, matrix metalloproteinase 2 (MMP-2) gene expression increased significantly in U87, but not U87vIII cells in response to hypoxia, which is associated with GBM tumor progression and contributes to regulation of angiogenesis. Whether the differential response according to EGFR status reflects differential expression of other MMPs requires further investigation. Vascular endothelial growth factor (VEGF) gene expression was upregulated in U87 and U87vIII cells in hypoxia compared to normoxia, independent of presence of matrix-bound HA. This outcome is consistent with prior reports of VEGF expression contributing to upregulation of GBM invasive potential by invoking various signaling pathways as well as via vasularization.42,46, 55, 62 EGFR expression in U87 and U87vIII cells was upregulated significantly in GelMA (−HAMA) but not matrix-bound HA (+HAMA). Similarly, hypoxia also only upregulated EGFR expression in U87 and U87vIII cells in GelMA samples (−HAMA).
Figure 5.
Gene expression profiles of (A) (B) (C) U87 and (D) (E) (F) U87vIII for (A) (D) MMP-2, (B) (E) VEGF, and (C) (F) EGFR. ^ significant (p < 0.05) for +/− hypoxia; * significant (p < 0.05) for +/− HAMA.
Hypoxia activated EGFR, MMP-2 and VEGF expression to a greater extent in hydrogels without matrix-bound HA (−HAMA), which correlates with the trend of invasion. Hypoxia-induced MMP expression (which contributes to matrix remodeling) and VEGF-activated angiogenesis (which promotes in vivo vascularization) is consistent with their known contributions to GBM invasion,63–65 thus validating the three-dimensional hydrogels for the study of such. Collectively, these results indicate that, compared with matrix-bound HA, hypoxia may be a stronger extracellular cue to induce GBM cell invasion and matrix remodeling. However, opportunities exist to more fully explore a range of molecular weight HA incorporated into the GelMA hydrogel platform as a means to address complexity associated with HA degradation and synthesis in the tumor microenvironment.66
3.6. Activated soluble HA secretion under hypoxia
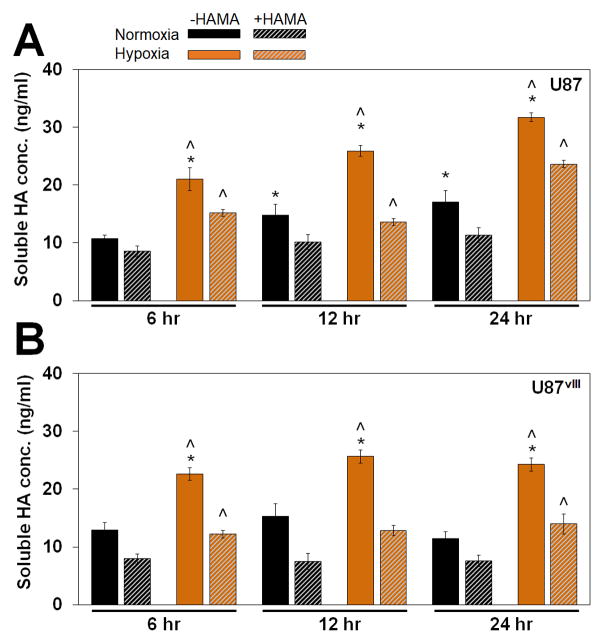
We reported previously that the matrix environment significantly influences compensatory HA biosynthesis by U251 GBM cells.26 Specifically, GBM cells produce significantly higher levels of soluble HA when cultured in GelMA hydrogels lacking matrix-bound HA (−HAMA) compared to those with matrix-bound HA (+HAMA), which might contribute to elevated invasion in -HAMA hydrogels. Therefore, we examined soluble HA concentrations to determine whether matrix-bound HA and microenvironmental hypoxic cues may contribute to different levels of soluble HA production by U87 and U87vIII GBM cells. Notably, both U87 and U87vIII GBM cells showed a similar trend of compensatory HA production in GelMA hydrogels lacking matrix-bound HA as rapidly as within 6 hours of culture, with the effect extending through the 7-day timepoint (data not shown). Overall, soluble HA production levels for U87 and U87vIII were largely similar. We observed a significant upregulation of soluble HA production for GBM cells cultured under hypoxia for both cell types (U87 & U87vIII) independent of matrix conditions (+/− HAMA) (Figure 6, Figure S6). Consistent with our previous observations,26 conditions with heightened GBM cell invasion within the hydrogel environment were associated with increased soluble HA production. While few studies have examined the role of hypoxia on HA production, Stern et al.67 observed a similar effect in vivo, in which tissues under low oxygen tensions are forced to undergo anaerobic metabolism, resulting in increased lactate levels and stimulation of HA production. This may explain the hypoxia-stimulated production of soluble HA in our platform; however, lactate is unlikely to be a mediator since media were changed at days 3 and 5 for the 7-day cultures and significant lactate accumulation was not observed (not shown).
Figure 6.
Soluble HA concentration measured via ELISA for (A) U87 and (B) U87vIII cells. A compensatory production of soluble HA was observed between +/− HAMA as early as 6 hours in culture. Soluble HA concentrations were elevated under hypoxia independent of the matrix composition. ^ significant (p < 0.05) for +/− hypoxia; * significant (p < 0.05) for +/− HAMA.
5. Conclusions
The GBM tumor microenvironment is highly heterogeneous and is marked by transitions in extracellular matrix properties and regions of metabolic constraint (hypoxia). Cross talk between these biophysical and metabolic signals may play a significant role in GBM invasion, therapeutic resistance, and overall poor prognosis of GBM. Yet, cross talk among these signaling axes is difficult to assess in vivo due to the complexity of the brain environment. Here, we report the use of a tissue engineering approach to create hydrogel microenvironments with controllable presentation of brain-mimetic matrix-immobilized HA and hypoxia. We observed that GBM cells under hypoxia show heightened invasive behavior regardless of the presence of matrix-bound HA. Further, the lack of matrix-bound HA affected GBM response by inducing compensatory HA secretion of this essential cell adhesive biomolecule, which was associated with increased GBM invasion. EGFR status (EGFR wt vs. EGFRvIII mutant) of U87 GBM cells also affected proliferation and metabolic activity in response to hypoxia and matrix-bound HA. Finally, this study demonstrates the value of a bioengineering approach for future studies that aim to define molecular mechanisms regulating the apparent shift from a proliferative to a migratory phenotype in response to hypoxia in GBM.
Supplementary Material
Figure 7.
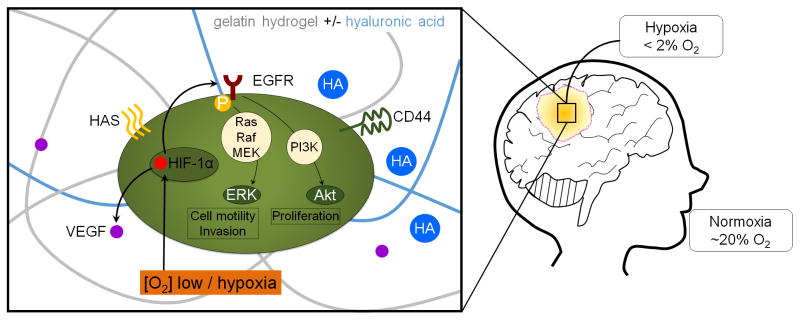
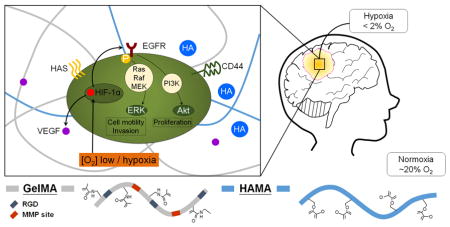
Schematic of the use of a GelMA hydrogel to examine the combined effects of matrix-composition and extracellular hypoxia on the activation of metabolic and mechanotransduction pathways associated with invasion and malignancy in glioblastoma.
Acknowledgments
The authors would like to acknowledge Dr. Sara Pedron for assistance with 1HNM analysis as well as Dr. Nathan Price (Institute for Systems Biology, Seattle, WA) for the gift of the U87 cell lines. Research reported in this publication was supported by the National Cancer Institute and the National Institute of Biomedical Imaging and Bioengineering of the National Institutes of Health under Award Numbers R01CA197488 and T32EB019944. The content is solely the responsibility of the authors and does not necessarily represent the official views of the National Institutes of Health. The authors are also grateful for additional funding provided by the Department of Chemical & Biomolecular Engineering (BACH) and the Carl R. Woese Institute for Genomic Biology (BACH) at the University of Illinois at Urbana-Champaign.
References
- 1.Stupp R, Mason WP, van den Bent MJ, Weller M, Fisher B, Taphoorn MJ, Belanger K, Brandes AA, Marosi C, Bogdahn U, Curschmann J, Janzer RC, Ludwin SK, Gorlia T, Allgeier A, Lacombe D, Cairncross JG, Eisenhauer E, Mirimanoff RO. N Engl J Med. 2005;352:987–996. doi: 10.1056/NEJMoa043330. [DOI] [PubMed] [Google Scholar]
- 2.Furnari FB, Fenton T, Bachoo RM, Mukasa A, Stommel JM, Stegh A, Hahn WC, Ligon KL, Louis DN, Brennan C, Chin L, DePinho RA, Cavenee WK. Genes Dev. 2007;21:2683–2710. doi: 10.1101/gad.1596707. [DOI] [PubMed] [Google Scholar]
- 3.Wen PY, Kesari S. N Engl J Med. 2008;359:492–507. doi: 10.1056/NEJMra0708126. [DOI] [PubMed] [Google Scholar]
- 4.Nakada M, Nakada S, Demuth T, Tran NL, Hoelzinger DB, Berens ME. Cell Mol Life Sci. 2007;64:458–478. doi: 10.1007/s00018-007-6342-5. [DOI] [PMC free article] [PubMed] [Google Scholar]
- 5.Ehsan SM, Welch-Reardon KM, Waterman ML, Hughes CC, George SC. Integr Biol (Camb) 2014;6:603–610. doi: 10.1039/c3ib40170g. [DOI] [PMC free article] [PubMed] [Google Scholar]
- 6.Poste G, Fidler IJ. Nature. 1980;283:139–146. doi: 10.1038/283139a0. [DOI] [PubMed] [Google Scholar]
- 7.Mourad PD, Farrell L, Stamps LD, Chicoine MR, Silbergeld DL. Surgical Neurology. 2005;63:511–519. doi: 10.1016/j.surneu.2004.08.062. [DOI] [PubMed] [Google Scholar]
- 8.Watkins S, Robel S, Kimbrough IF, Robert SM, Ellis-Davies G, Sontheimer H. Nature Communications. 2014;5:4196. doi: 10.1038/ncomms5196. [DOI] [PMC free article] [PubMed] [Google Scholar]
- 9.Watkins S, Robel S, Kimbrough IF, Robert SM, Ellis-Davies G, Sontheimer H. Nat Commun. 2014:5. doi: 10.1038/ncomms5196. [DOI] [PMC free article] [PubMed] [Google Scholar]
- 10.de Groot JF, Fuller G, Kumar AJ, Piao Y, Eterovic K, Ji Y, Conrad CA. Neuro-Oncology. 2010;12:233–242. doi: 10.1093/neuonc/nop027. [DOI] [PMC free article] [PubMed] [Google Scholar]
- 11.Clavreul A, Guette C, Faguer R, Tétaud C, Boissard A, Lemaire L, Rousseau A, Avril T, Henry C, Coqueret O, Menei P. J Pathol. 2014;233:74–88. doi: 10.1002/path.4332. [DOI] [PubMed] [Google Scholar]
- 12.Wallner KE, Galicich JH, Krol G, Arbit E, Malkin MG. Int J Radiat Oncol Biol Phys. 1989;16:1405–1409. doi: 10.1016/0360-3016(89)90941-3. [DOI] [PubMed] [Google Scholar]
- 13.Delgado-López PD, Corrales-García EM. Clinical and Translational Oncology. 2016;18:1062–1071. doi: 10.1007/s12094-016-1497-x. [DOI] [PubMed] [Google Scholar]
- 14.Wiranowska MR, Rojiani MV. Extracellular Matrix Microenvironment in Glioma Progression. InTech; 2011. [Google Scholar]
- 15.Syková E. In: The Neuronal Environment: Brain Homeostasis in Health and Disease. Walz W, editor. Humana Press; Totowa, NJ: 2002. pp. 57–81. [DOI] [Google Scholar]
- 16.Quirico-Santos T, Fonseca CO, Lagrota-Candido J. Arquivos de Neuro-Psiquiatria. 2010;68:799–803. doi: 10.1590/s0004-282x2010000500024. [DOI] [PubMed] [Google Scholar]
- 17.Misra S, Heldin P, Hascall VC, Karamanos NK, Skandalis SS, Markwald RR, Ghatak S. FEBS J. 2011;278:1429–1443. doi: 10.1111/j.1742-4658.2011.08071.x. [DOI] [PMC free article] [PubMed] [Google Scholar]
- 18.Toole BP. Nat Rev Cancer. 2004;4:528–539. doi: 10.1038/nrc1391. [DOI] [PubMed] [Google Scholar]
- 19.Monslow J, Govindaraju P, Puré E. Frontiers in Immunology. 2015;6:231. doi: 10.3389/fimmu.2015.00231. [DOI] [PMC free article] [PubMed] [Google Scholar]
- 20.Lam J, Truong NF, Segura T. Acta biomaterialia. 2014;10:1571–1580. doi: 10.1016/j.actbio.2013.07.025. [DOI] [PMC free article] [PubMed] [Google Scholar]
- 21.Hulkower KI, Herber RL. Pharmaceutics. 2011;3:107–124. doi: 10.3390/pharmaceutics3010107. [DOI] [PMC free article] [PubMed] [Google Scholar]
- 22.Kim Y, Kumar S. In: Tumors of the Central Nervous System, Volume 13: Types of Tumors, Diagnosis, Ultrasonography, Surgery, Brain Metastasis, and General CNS Diseases. Hayat MA, editor. Springer; Netherlands, Dordrecht: 2014. pp. 253–266. [DOI] [Google Scholar]
- 23.Umesh V, Rape AD, Ulrich TA, Kumar S. PLOS ONE. 2014;9:e101771. doi: 10.1371/journal.pone.0101771. [DOI] [PMC free article] [PubMed] [Google Scholar]
- 24.Ananthanarayanan B, Kim Y, Kumar S. Biomaterials. 2011;32:7913–7923. doi: 10.1016/j.biomaterials.2011.07.005. [DOI] [PMC free article] [PubMed] [Google Scholar]
- 25.Heffernan JM, Overstreet DJ, Le LD, Vernon BL, Sirianni RW. Ann Biomed Eng. 2015;43:1965–1977. doi: 10.1007/s10439-014-1223-1. [DOI] [PubMed] [Google Scholar]
- 26.Chen J-WE, Pedron S, Harley BA. Macromolecular Bioscience. 2017 doi: 10.1002/mabi.201700018. [DOI] [PMC free article] [PubMed] [Google Scholar]
- 27.Vartanian A, Singh SK, Agnihotri S, Jalali S, Burrell K, Aldape KD, Zadeh G. Neuro Oncol. 2014;16:1167–1175. doi: 10.1093/neuonc/nou035. [DOI] [PMC free article] [PubMed] [Google Scholar]
- 28.Rong Y, Durden DL, Van Meir EG, Brat DJ. J Neuropathol Exp Neurol. 2006;65:529–539. doi: 10.1097/00005072-200606000-00001. [DOI] [PubMed] [Google Scholar]
- 29.Carreau A, El Hafny-Rahbi B, Matejuk A, Grillon C, Kieda C. J Cell Mol Med. 2011;15:1239–1253. doi: 10.1111/j.1582-4934.2011.01258.x. [DOI] [PMC free article] [PubMed] [Google Scholar]
- 30.Vaupel P, Hockel M, Mayer A. Antioxid Redox Signal. 2007;9:1221–1235. doi: 10.1089/ars.2007.1628. [DOI] [PubMed] [Google Scholar]
- 31.Rajendran JG, Mankoff DA, O’Sullivan F, Peterson LM, Schwartz DL, Conrad EU, Spence AM, Muzi M, Farwell DG, Krohn KA. Clin Cancer Res. 2004;10:2245–2252. doi: 10.1158/1078-0432.ccr-0688-3. [DOI] [PubMed] [Google Scholar]
- 32.Brat DJ, Castellano-Sanchez AA, Hunter SB, Pecot M, Cohen C, Hammond EH, Devi SN, Kaur B, Van Meir EG. Cancer Research. 2004;64:920–927. doi: 10.1158/0008-5472.can-03-2073. [DOI] [PubMed] [Google Scholar]
- 33.Kaur B, Khwaja FW, Severson EA, Matheny SL, Brat DJ, Van Meir EG. Neuro-Oncology. 2005;7:134–153. doi: 10.1215/S1152851704001115. [DOI] [PMC free article] [PubMed] [Google Scholar]
- 34.Hardee ME, Zagzag D. The American Journal of Pathology. 2012;181:1126–1141. doi: 10.1016/j.ajpath.2012.06.030. [DOI] [PMC free article] [PubMed] [Google Scholar]
- 35.Theys J, Jutten B, Dubois L, Rouschop KMA, Chiu RK, Li Y, Paesmans K, Lambin P, Lammering G, Wouters BG. Radiotherapy and Oncology. 2009;92:399–404. doi: 10.1016/j.radonc.2009.06.017. [DOI] [PubMed] [Google Scholar]
- 36.Vivanco I, Robins HI, Rohle D, Campos C, Grommes C, Nghiemphu PL, Kubek S, Oldrini B, Chheda MG, Yannuzzi N, Tao H, Zhu S, Iwanami A, Kuga D, Dang J, Pedraza A, Brennan CW, Heguy A, Liau LM, Lieberman F, Yung WKA, Gilbert MR, Reardon DA, Drappatz J, Wen PY, Lamborn KR, Chang SM, Prados MD, Fine HA, Horvath S, Wu N, Lassman AB, DeAngelis LM, Yong WH, Kuhn JG, Mischel PS, Mehta MP, Cloughesy TF, Mellinghoff IK. Cancer Discovery. 2012;2:458–471. doi: 10.1158/2159-8290.CD-11-0284. [DOI] [PMC free article] [PubMed] [Google Scholar]
- 37.Liu Z, Han L, Dong Y, Tan Y, Li Y, Zhao M, Xie H, Ju H, Wang H, Zhao Y, Zheng Q, Wang Q, Su J, Fang C, Fu S, Jiang T, Liu J, Li X, Kang C, Ren H. Oncotarget. 2016;7:4680–4694. doi: 10.18632/oncotarget.6730. [DOI] [PMC free article] [PubMed] [Google Scholar]
- 38.Mao H, LeBrun DG, Yang J, Zhu VF, Li M. Cancer investigation. 2012;30:48–56. doi: 10.3109/07357907.2011.630050. [DOI] [PMC free article] [PubMed] [Google Scholar]
- 39.Franovic A, Gunaratnam L, Smith K, Robert I, Patten D, Lee S. Proceedings of the National Academy of Sciences. 2007;104:13092–13097. doi: 10.1073/pnas.0702387104. [DOI] [PMC free article] [PubMed] [Google Scholar]
- 40.Heimberger AB, Suki D, Yang D, Shi W, Aldape K. Journal of Translational Medicine. 2005;3:38–38. doi: 10.1186/1479-5876-3-38. [DOI] [PMC free article] [PubMed] [Google Scholar]
- 41.Pedron S, Becka E, Harley BAC. Adv Mater. 2015;27:1567–1572. doi: 10.1002/adma.201404896. [DOI] [PubMed] [Google Scholar]
- 42.Pedron S, Harley BAC. J Biomed Mater Res Pt A. 2013;101:3405–3415. doi: 10.1002/jbm.a.34637. [DOI] [PubMed] [Google Scholar]
- 43.Pedron S, Becka E, Harley BAC. Biomaterials. 2013;34:7408–7417. doi: 10.1016/j.biomaterials.2013.06.024. [DOI] [PubMed] [Google Scholar]
- 44.Mahadik BP, Pedron Haba S, Skertich LJ, Harley BA. Biomaterials. 2015;67:297–307. doi: 10.1016/j.biomaterials.2015.07.042. [DOI] [PMC free article] [PubMed] [Google Scholar]
- 45.Pedron S, Becka E, Harley BA. Advanced Materials. 2015;27:1567–1572. doi: 10.1002/adma.201404896. [DOI] [PubMed] [Google Scholar]
- 46.Pence JC, Clancy KBH, Harley BAC. Biotechnology and Bioengineering. 2015;112:2185–2194. doi: 10.1002/bit.25622. [DOI] [PMC free article] [PubMed] [Google Scholar]
- 47.Caliari SR, Harley BAC. Biomaterials. 2011;32:5330–5340. doi: 10.1016/j.biomaterials.2011.04.021. [DOI] [PMC free article] [PubMed] [Google Scholar]
- 48.Pedron S, Becka E, Harley BA. Biomaterials. 2013;34:7408–7417. doi: 10.1016/j.biomaterials.2013.06.024. [DOI] [PubMed] [Google Scholar]
- 49.Caliari SR, Weisgerber DW, Grier WK, Mahmassani Z, Boppart MD, Harley BAC. Advanced Healthcare Materials. 2015;4:831–837. doi: 10.1002/adhm.201400809. [DOI] [PMC free article] [PubMed] [Google Scholar]
- 50.Schwartz AD, Hall CL, Barney LE, Babbitt CC, Peyton SR. bioRxiv. 2017 doi: 10.1101/164525. [DOI] [Google Scholar]
- 51.Kalkan R. Crit Rev Eukaryot Gene Expr. 2015;25:363–369. doi: 10.1615/critreveukaryotgeneexpr.2015015601. [DOI] [PubMed] [Google Scholar]
- 52.Minet E, Arnould T, Michel G, Roland I, Mottet D, Raes M, Remacle J, Michiels C. FEBS Letters. 2000;468:53–58. doi: 10.1016/s0014-5793(00)01181-9. [DOI] [PubMed] [Google Scholar]
- 53.Koh MY, Powis G. Trends Biochem Sci. 2012;37:364–372. doi: 10.1016/j.tibs.2012.06.004. [DOI] [PMC free article] [PubMed] [Google Scholar]
- 54.Guo G, Yao W, Zhang Q, Bo Y. PLOS ONE. 2013;8:e72079. doi: 10.1371/journal.pone.0072079. [DOI] [PMC free article] [PubMed] [Google Scholar]
- 55.Xu L, Fukumura D, Jain RK. Journal of Biological Chemistry. 2002;277:11368–11374. doi: 10.1074/jbc.M108347200. [DOI] [PubMed] [Google Scholar]
- 56.Erlich RB, Kahn SA, Lima FRS, Muras AG, Martins RAP, Linden R, Chiarini LB, Martins VR, Moura Neto V. Glia. 2007;55:1690–1698. doi: 10.1002/glia.20579. [DOI] [PubMed] [Google Scholar]
- 57.BelAiba RS, Bonello S, Zähringer C, Schmidt S, Hess J, Kietzmann T, Görlach A. Molecular Biology of the Cell. 2007;18:4691–4697. doi: 10.1091/mbc.E07-04-0391. [DOI] [PMC free article] [PubMed] [Google Scholar]
- 58.Kim JY, Kim YJ, Lee S, Park JH. BMC Cancer. 2009;9:27. doi: 10.1186/1471-2407-9-27. [DOI] [PMC free article] [PubMed] [Google Scholar]
- 59.Wang GL, Jiang BH, Semenza GL. Biochemical and Biophysical Research Communications. 1995;216:669–675. doi: 10.1006/bbrc.1995.2674. [DOI] [PubMed] [Google Scholar]
- 60.Zhong H, De Marzo AM, Laughner E, Lim M, Hilton DA, Zagzag D, Buechler P, Isaacs WB, Semenza GL, Simons JW. Cancer Research. 1999;59:5830–5835. [PubMed] [Google Scholar]
- 61.Shweiki D, Neeman M, Itin A, Keshet E. Proceedings of the National Academy of Sciences. 1995;92:768–772. doi: 10.1073/pnas.92.3.768. [DOI] [PMC free article] [PubMed] [Google Scholar]
- 62.Zagzag D, Lukyanov Y, Lan L, Ali MA, Esencay M, Mendez O, Yee H, Voura EB, Newcomb EW. Lab Invest. 2006;86:1221–1232. doi: 10.1038/labinvest.3700482. [DOI] [PubMed] [Google Scholar]
- 63.Du R, Petritsch C, Lu K, Liu P, Haller A, Ganss R, Song H, Vandenberg S, Bergers G. Neuro-Oncology. 2008;10:254–264. doi: 10.1215/15228517-2008-001. [DOI] [PMC free article] [PubMed] [Google Scholar]
- 64.Wolf K, Mazo I, Leung H, Engelke K, von Andrian UH, Deryugina EI, Strongin AY, Bröcker EB, Friedl P. The Journal of Cell Biology. 2003;160:267–277. doi: 10.1083/jcb.200209006. [DOI] [PMC free article] [PubMed] [Google Scholar]
- 65.Lu KV, Jong KA, Rajasekaran AK, Cloughesy TF, Mischel PS. Lab Invest. 2003;84:8–20. doi: 10.1038/sj.labinvest.3700003. [DOI] [PubMed] [Google Scholar]
- 66.Kim Y, Kumar S. Mol Cancer Res. 2014;12:1416–1429. doi: 10.1158/1541-7786.MCR-13-0629. [DOI] [PMC free article] [PubMed] [Google Scholar]
- 67.Stern R, Shuster S, Neudecker BA, Formby B. Experimental Cell Research. 2002;276:24–31. doi: 10.1006/excr.2002.5508. [DOI] [PubMed] [Google Scholar]
Associated Data
This section collects any data citations, data availability statements, or supplementary materials included in this article.


