

Abstract
Subcutaneous C1‐inhibitor (HAEGARDA, CSL Behring), is a US Food and Drug Administration (FDA)‐approved, highly concentrated formulation of a plasma‐derived C1‐esterase inhibitor (C1‐INH), which, in the phase III Clinical Studies for Optimal Management in Preventing Angioedema with Low‐Volume Subcutaneous C1‐inhibitor Replacement Therapy (COMPACT) trial, reduced the incidence of hereditary angioedema (HAE) attacks when given prophylactically. Data from the COMPACT trial were used to develop a repeated time‐to‐event model to characterize the timing and frequency of HAE attacks as a function of C1‐INH activity, and then develop an exposure–response model to assess the relationship between C1‐INH functional activity levels (C1‐INH(f)) and the risk of an attack. The C1‐INH(f) values of 33.1%, 40.3%, and 63.1% were predicted to correspond with 50%, 70%, and 90% reductions in the HAE attack risk, respectively, relative to no therapy. Based on trough C1‐INH(f) values for the 40 IU/kg (40.2%) and 60 IU/kg (48.0%) C1‐INH (SC) doses, the model predicted that 50% and 67% of the population, respectively, would see at least a 70% decrease in the risk of an attack.
Study Highlights.
WHAT IS THE CURRENT KNOWLEDGE ON THE TOPIC?
☑ Administration of the FDA‐approved C1‐INH (SC; HAEGARDA) leads to dose‐dependent, physiologically relevant increases in trough C1‐INH(f) in patients with HAE.
WHAT QUESTION DID THIS STUDY ADDRESS?
☑ The relationship of exposure of C1‐INH (SC) to the risk of breakthrough HAE attacks, and whether different patient factors influence this relationship.
WHAT DOES THIS STUDY ADD TO OUR KNOWLEDGE?
☑ A strong, inverse exposure–response relationship was shown between C1‐INH(f) and breakthrough HAE attacks; the effect of C1‐INH (SC) on the reduction in risk was not age dependent. The 40 and 60 IU/kg C1‐INH (SC) doses are predicted to increase trough C1‐INH(f) levels well above the clinically significant 40% threshold.
HOW MIGHT THIS CHANGE DRUG DISCOVERY, DEVELOPMENT, AND/OR THERAPEUTICS?
☑ The link between C1‐INH(f) and the risk of an attack substantiates the C1‐INH dose used for HAE prophylaxis and will inform future studies aimed at optimizing outcomes on replacement therapy. A large proportion of patients treated with C1‐INH (SC) should be expected to experience notable reductions in the relative risk of an HAE attack.
Hereditary angioedema (HAE) is a rare, debilitating, and potentially life‐threatening genetic disease caused by a deficiency in functional C1‐esterase inhibitor (C1‐INH).1, 2 Mutations in the C1‐INH gene result in two types of HAE due to C1‐INH deficiency or dysfunction and can be detected by abnormal complement protein levels: type I patients (85% of cases) have low levels of C1‐INH antigen in plasma; type II patients (15% of cases) have low levels of functional C1‐INH protein and normal or slightly elevated levels of C1‐INH antigen. C1‐INH(f) assays are based on the principle of C1‐INH in the samples inhibiting a certain volume of C1‐esterase. Outputs are expressed as a percentage of functional activity in normal plasma (normal range 70–130%).
HAE therapies aim to treat and prevent the signs and symptoms of HAE, especially its disabling and life‐threatening attacks. Routine prophylactic administration of exogenous C1‐INH has been shown to be safe and clinically effective for the prevention of attacks, and are recommended to restore and maintain C1‐INH functional activity (C1‐INH(f)).3, 4 Until recently, the established dose regimen for routine prevention of attacks was twice‐weekly IV infusion of 1,000 IU C1‐INH. Subcutaneous C1‐inhibitor (HAEGARDA; CSL Behring, Marburg, Germany), recently approved by the US Food and Drug Administration (FDA), remedies some of the key limitations associated with IV administration for patients with HAE who require long‐term prophylaxis. A phase II trial demonstrated that C1‐INH (SC) dose‐dependently increased trough plasma levels of C1‐INH(f)5; the phase III Clinical Studies for Optimal Management in Preventing Angioedema with Low‐Volume Subcutaneous C1‐inhibitor Replacement Therapy (COMPACT) trial found that twice‐weekly C1‐INH (SC) significantly reduced the frequency of HAE attacks.6 To date, no single exposure–response model has been established to quantify the decrease in HAE attacks observed with increasing C1‐INH(f). The present analysis describes a model which, we believe for the first time, elucidates the relationship between C1‐INH(f) levels after C1‐INH (SC) administration and the risk of experiencing an HAE attack as well as describing subject‐related factors that may influence this exposure–response relationship.
METHODS
Study design and data source
The development of the exposure–response model utilized data from the pivotal phase III COMPACT study, a randomized trial with a crossover design, in which subjects with HAE received twice‐weekly prophylactic doses of 40 IU/kg or 60 IU/kg C1‐INH (SC; CSL830) followed by placebo for ≤16 weeks of each treatment, or vice versa. Patients were randomized if their HAE clinical diagnoses were confirmed by central laboratory testing and if they experienced a predetermined number of HAE attacks during any consecutive 4‐week period or during the first 2 weeks of the run‐in period. Further study design and details have been reported recently and are given in the Supplementary Materials.6 The COMPACT study received appropriate review board approval, and patients provided written informed consent to participate. The data for the present analysis included dose amounts, times of dose administration, patient‐specific parameters (weight and age at baseline, gender, number of attacks, prior randomization, HAE type (I vs. II), and observed baseline C1‐INH(f)), and individual post hoc pharmacokinetic (PK) parameters predicted from a population pharmacokinetic (PopPK) model. The study permitted rescue therapy (C1‐INH (IV)) for the acute treatment of HAE attacks; the PopPK analysis included dosing information for HAE rescue therapy in cases in which C1‐INH (IV) was administered. Plasma samples for assessment of C1‐INH(f) were collected during the phase III COMPACT study at 1,062 sampling points. The occurrences of HAE attacks and symptoms were recorded by patients using e‐diaries and were assessed by investigators; these were logged in along with the administration of rescue medication by the investigators at each trial visit.
Methodology of exposure–response approach
A repeated time‐to‐event model was used to characterize the timing and frequency of attacks as a function of C1‐INH(f).7, 8 Parametric model development assessed three main components; a background effect, a nondrug effect (e.g., time effect), and a C1‐INH (SC) effect, which allowed for informative use of the changes in C1‐INH(f).
Exploratory exposure–response evaluation for risk of attacks
A PopPK analysis was performed using data from the phase I to phase III clinical studies of treatment with C1‐INH (IV) or C1‐INH (SC; total 2,103 samples).5, 6 The C1‐INH(f) following administration of C1‐INH (SC) was adequately described by a linear one‐compartment model with first‐order absorption and first‐order elimination, with interindividual variability on all the parameters. The PopPK model found body weight to be a significant covariate on clearance. The parameters were estimated with good precision and shrinkage. Goodness‐of‐fit criteria revealed no indication of any substantive deficiency in the ability of the final model to characterize the trend and variability in the observed PK data. The results of the PopPK model will be published separately.
The subject‐specific PK parameters obtained from the PopPK analysis were used to predict the individual C1‐INH(f) time profiles following administration of C1‐INH (SC). These time profiles were used to inform the exposure–response analysis; the PK model predictions of C1‐INH(f) at the time of the attack following C1‐INH (SC) exposure were directly linked to the timing and frequency of the attack using the repeated time‐to‐event hazard model, as seen in Figure 1.
Figure 1.

Absolute risk of a breakthrough hereditary angioedema (HAE) attack vs. C1‐esterase inhibitor functional activity (C1‐INH(f)) (%). Blue dots represent the model predicted hazard vs. C1‐INH(f) (%) in each patient.
The timing (clock time) of an attack on a particular day was not available, therefore, events were treated as interval‐censored based upon the calendar day. More formally, let T be a random variable representing the time of an HAE attack based on continuous time and relative to the first dose of study medication or the end of a previous HAE attack, whichever is later. Let D be the ending time of the day on which a new event occurs. From the construction, D‐1<T≤D and D‐1, D defines the censoring interval. This interval will be 24 hours as related to the calendar day, except if an event occurs on the calendar day corresponding to the first dose of study medication. In this case, the interval duration is defined from the first dose of study medication to the end of the calendar day (<24 hours). Let W represent the time corresponding to the end of the study or subject withdrawal. W is also defined relative to the first dose of study medication or the end of a previous HAE attack, similar to D. The interval‐censored probability of an event and the right‐censored probability of not observing an event before withdrawal are:
| (1) |
where Pr(•) represents a probability; and S(•) represents the survival function. The survival function is related to the hazard, used in the exposure–response modeling, by the following equation:
| (2) |
where h is the hazard function and m is the (time) variable of integration.
When an HAE attack occurred, the risk of having another attack (S(t)) was not allowed to accrue until after the attack resolved; effectively, the subject was removed from the risk set. Despite the subject not being at risk of an event, the dose of rescue medication was included in the PK component of the exposure–response model as the rescue medication is an IV formulation of the treatment. The PK information following rescue were needed to ensure proper prediction of C1‐INH exposure throughout the time course of a subject. After each HAE attack resolved, the accumulation of risk over time was reinitiated and related to C1‐INH(f). Overall, the strategy of interval censoring was used to avoid assumptions about when the attack occurred, yet it kept as much resolution in the timing of the event in order to best associate it with C1‐INH(f) fluctuations.
A general parametric model was assessed in order to characterize the log hazard function, where fb, fnd, and fd represent the baseline, nondrug (e.g., time effects), and drug functions, respectively, t represents (continuous) time, which is relative to the first dose of study medication (t = 0):
| (3) |
A standard baseline parameterization was used for fb (i.e., a fixed (B0) and additive random effect), and η (defined as fb = B0 + η). Linear, power, or exponential plateau functions in time were tested for the nondrug functions, fnd. Linear, power, maximum effect (Emax) or sigmoidal Emax functions were evaluated for the C1‐INH (SC) drug effect function, fd, where Cp represents model‐predicted C1‐INH(f) at time T. Interindividual variability was considered for the time‐to‐event model through η to account for correlation between repeated events within the subject and heterogeneity between individuals. The “η”s were assumed to be normally distributed with mean 0 and variance ω2.
Alternative methods that were evaluated included the importance sampling expectation maximum and stochastic approximation expectation maximum because the Laplace approximation often failed to converge during estimation when evaluating covariates.
Covariate evaluation
Covariates evaluated in the analysis were: body weight, age, gender, observed baseline C1‐INH(f), baseline HAE attack counts, and HAE type (I vs. II). Clinical judgment was used to determine which covariates were tested on which parameters.
The full model with backward elimination approach was specified originally for covariate model selection. Due to the long run‐times for each model and some unreasonable covariate effect estimates (likely due to confounding), backward elimination was used to pare down the full model to a working full model that did not have the unreasonable estimates. Next, the Wald's approximation method9 was used with the working full time‐to‐event model to identify a subset of reduced time‐to‐event models. Given that the Wald's approximation method does not require full nonlinear mixed‐effect modeling (NONMEM) estimation for each step means that this approach is computationally economical for models with long run‐times.
The Wald's approximation method procedure used a penalty of 10.83 (based on a χ2 distribution with 1 degree of freedom at P = 0.001) to rank the subset of reduced time‐to‐event models. The ranks for the Wald's approximation method and NONMEM‐verified results were compared for selection of the final exposure–response model. Moreover, where significant covariate effects were identified, the magnitudes of the effects over relevant ranges, along with 95% confidence intervals, were provided.
Model evaluation
A visual predictive check, specifically a graphical posterior predictive check, was performed using the final model. Uncertainty in the population parameters was not incorporated. Therefore, the visual predictive check was conservative, in that the prediction intervals computed were smaller than the nominal value achieved had uncertainty been incorporated. The visual predictive check was conducted to align with the clinical evaluation of efficacy, which was concerned with the distribution of attacks, and was performed by comparing observed and predicted cumulative probabilities of the HAE attack rate, time‐normalized by month. The visual predictive check was computed by treatment group, 40 or 60 IU/kg C1‐INH (SC) or placebo. The random effects η were sampled for the visual predictive check.
To generate the visual predictive check, the HAE attack data were simulated from the model, conditional on individually predicted PK concentration‐time profiles. The cumulative hazard was computed by day as a function of C1‐INH(f), and itself was used to compute survival function values for each day, from which the probability that an event occurred was derived. Specifically, a uniformly distributed random number u* was sampled (u*∼U(0,1)), and 1‐u* was compared to S(D‐1) and S(D), where S(•) is the survival function and D represents the time since the first dose of study medication or resolution of a previous HAE attack in days. If S(D) ≤ 1–u* < S(D‐1), then an event was registered on day D. Following an event, the risk of a new event (starting at 0) was allowed to accrue, and a new u* was sampled. The occurrence of a simulated event was also evaluated. This process was repeated until the end of the study or withdrawal.
Simulations
The final model was used to simulate the absolute hazard of attacks over a wide range of C1‐INH(f) values (20–120%). The hazard ratio was computed using the geometric mean of observed baseline C1‐INH(f) as the reference (25.4%), compared to C1‐INH(f) ranging from 25.4–120%.
RESULTS
Study population
Ninety subjects from the phase III COMPACT study experienced 1,191 attacks and 234 censored events. Baseline characteristics and demographics for the study population are summarized in Table 1. All subjects who were administered at least one dose of placebo or C1‐INH (SC) were included in the analysis.
Table 1.
Subject characteristics and demographics
| Covariate | Statistic or category | Phase III COMPACT study |
|---|---|---|
| Total number | 90 | |
| Age at baseline, years | Median [min–max] | 40.0 [12–72] |
| Weight at baseline, kg | Median [min–max] | 78.1 [43–157] |
| Observed baseline C1‐INH(f), % |
Median [min–max] Geometric mean (SD) |
25 [4.5–77] 25.4 (1.67) |
| Baseline (historical HAE attack in run‐in period, no. of patients) | Median [min–max] | 3 [0–11] |
| Gender, no. of patients |
Male Female |
30 60 |
| HAE type, no. of patients |
Type 1 Type 2 |
78 12 |
| Total breakthrough HAE attack, no. of patients | 1,425 | |
C1‐INH(f), C1‐inhibitor functional activity; COMPACT, Clinical Studies for Optimal Management in Preventing Angioedema with Low‐Volume Subcutaneous C1‐inhibitor Replacement Therapy; HAE, hereditary angioedema.
Model findings
The parametric model described above was evaluated using the HAE data. These data did not support drug‐independent changes in the hazard over time; therefore, the nondrug component of the model was excluded. The model included a constant baseline hazard plus an Emax model to relate C1‐INH(f) concentration to the instantaneous risk of an event.
Covariate effects were evaluated using the Wald's approximation method. The top five models from the Wald's approximation method and the top three from the NONMEM‐based evaluation are reported in Supplementary Table S1. The final exposure–response model (run 1) included the covariate age on B0 but eliminated the other covariates, such as body weight, gender, observed baseline C1‐INH(f), baseline HAE attack counts, and HAE type (I vs II) on B0 and Emax, resulting in an increase of the objective function value of ≈27 units (compared to the working full model). The final time‐to‐event model for describing the absolute hazard of a breakthrough HAE attack in subjects receiving C1‐INH (SC) therefore is:
| (4) |
Based on the final model parameters (including the random effect on B0), the exposure–response relationship (absolute risk of a breakthrough HAE attack vs. predicted C1‐INH(f); %) was derived (Figure 1). The relationship between absolute attack risk relative to C1‐INH(f) exemplified that, although the baseline risk of an HAE attack varies as a function of age, there is no difference in the effect of C1‐INH (SC; i.e., in terms of half‐maximal effective concentration (EC50) and Emax). The parameters of this time‐to‐event model are presented in Table 2.
Table 2.
Parameter estimates of final C1‐INH (SC) population time‐to‐event model
| Parameter estimate [units] | Point estimate | SE | 95% CIa | Derived parameter [units]b | |
|---|---|---|---|---|---|
| B0 [hazard]c | 0.0802 | 0.380 | −0.665 to 0.825 | 1.08 [hazard] | |
| Age, years on B0 | 1.05 | 0.254 | 0.552–1.55 | – | |
| Emax, maximum effect | −10.5 | 0.334 | −11.2 to −9.84 | 0.99 [maximum fractional reduction in risk] | |
| EC50, % | 3.40 | 0.123 | 3.16–3.64 | 29.9 [C1‐INH(f) %] | |
| Interindividual variance | |||||
|
|
0.871 | 0.15 | – | – | |
C1‐INH, C1‐inhibitor; C1‐INH(f), C1‐inhibitor functional activity; CI, confidence interval; EC50, half‐maximal effective concentration; Emax, maximum effect.
95% CI calculated estimate ± 1.96 × SE. Derived parameters were calculated as exp (estimate).
Parameters were derived as follows: B0 = expParameter Estimate; Emax was calculated as 1‐exp(ParameterEstimate ); EC50 = expParameter Estimate. cThe shrinkage estimate for B0 was 6.0%.
Covariate evaluation
Covariates evaluated in the analysis were: body weight, age, gender, observed baseline C1‐INH(f), baseline HAE attack counts, and HAE type (I vs. II). Clinical judgment was used to determine which covariates were tested on which parameters. Continuous covariates were centered at their typical values (TVCOV) and the typical value for parameters (TVP) expressed as:
| (5) |
where θP was the estimated parameter representing the model parameter P when the individual covariate (COVi) was equal to TVCOV, and θCOV,P was the estimated parameter representing the influence of continuous covariates on model parameter P.
Categorical covariates were tested and incorporated in the model as a series of indicator variables taking on values of zero or one. The variables were included in the model as follows:
| (6) |
where TVP was as previously defined and θCAT,P was the estimated parameter representing the influence of categorical covariates on model parameter P.
Predictive performance
The relationship between the cumulative probability of an HAE attack per month with C1‐INH (SC) dose rate (placebo, 40 IU/kg, and 60 IU/kg), based on 500 simulations is shown in Figure 2. The visual predictive check indicated that the predictions intervals (shaded regions) of the model generally contained the observed values (lines). There is some potential for lack of perfect fit by the model as noted by the visual predictive check; the model may underpredict the higher HAE attack frequency for the placebo and treatment groups. Overall, the predictive performance of the final model was considered adequate for characterizing the exposure–response relationship.
Figure 2.
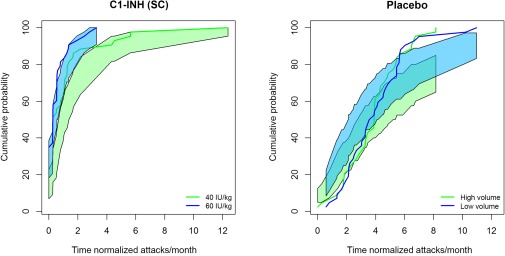
The relationship between cumulative probability of a breakthrough hereditary angioedema (HAE) attack and time of normalized attacks per month. The solid blue and green lines represent the cumulative probability of the observed HAE attacks (normalized by month). The blue and green bands reflect the 90% prediction intervals (without uncertainty based on estimation) based on 500 simulations based on the final model. C1‐INH, C1‐esterase inhibitor.
Simulations
The mean absolute risk of an attack varied across a wide range of C1‐INH(f) (20–120%), demonstrating a strong exposure–response relationship between the risk of a breakthrough HAE attack and C1‐INH(f). In order to assess the effect of age on the baseline risk of an HAE attack, the absolute risk across a range of C1‐INH functional activities (20–120%) was simulated at ages 20, 40, and 60 years for the typical individual (η = 0; Figure 3). These ages corresponded to the 5th, 50th, and 95th percentiles of the subject population in the phase III COMPACT study.
Figure 3.

Predicted absolute risk of an hereditary angioedema (HAE) attack vs. C1‐esterase inhibitor functional activity (C1‐INH(f)) (%) stratified by age. The blue solid line represents the absolute risk of HAE attack at the median age (40 years old) of the patient population in the study. The blue dotted lines represented the 5th and 95th (20–60 years old) confidence interval of the age of the patient population in the study.
In the phase III COMPACT study, the observed geometric mean baseline C1‐INH(f) was 25.4%.6 This was considered to be the C1‐INH(f) with no treatment and was used as the reference C1‐INH(f) value (Cr) to assess the relative reduction in rate of HAE attacks using the following equation:
| (7) |
Figure 4 shows the relative risk of a breakthrough HAE attack across a wide range of C1‐INH(f) activities for trough concentration, Cp. The figure also shows the C1‐INH(f) (%) thresholds that would result in a 50%, 70%, and 90% reduction in risk of an HAE attack, whereas on treatment with C1‐INH (SC) compared to baseline C1‐INH(f) levels (i.e., no C1‐INH (SC) prophylaxis given). The model estimated that 50%, 70%, and 90% reductions in relative risk corresponded to C1‐INH(f) values of 33.1%, 40.3%, and 63.1%, respectively.
Figure 4.

Simulated relationship between the relative risk of a breakthrough hereditary angioedema (HAE) attack and C1‐esterase inhibitor functional activity (C1‐INH(f); relative to the geometric mean baseline C1‐INH(f) of 25.4%) with predicted Ctrough values expected after administering C1‐esterase inhibitor (C1‐INH (SC)). Box plots represent the range of observed baseline C1‐INH(f) values (baseline) and steady‐state final population pharmacokinetic model‐predicted Ctrough after 40 IU/kg and 60 IU/kg doses of C1‐INH (SC), respectively. Black lines within the box represent the median value, the red circle represents the geometric mean, and these numbers are listed above the box. The red dashed line is the median of the simulation. The pink shaded area represents the prediction intervals (SEs in the parameter estimates only). The blacked dashed lines represent 50%, 70%, and 90% reductions in relative risk of a breakthrough HAE attack. Longhurst, H.J. et al.6 Prevention of hereditary angioedema attacks with subcutaneous C1 inhibitor. N. Engl. J. Med. 376, 1131–1140 (2017). Copyright © 2017 Massachusetts Medical Society. Reprinted with permission from Massachusetts Medical Society.
To understand the proportion of an HAE population that which would be expected to exceed these desired levels of C1‐INH(f) at a given dose, steady‐state C1‐INH functional activities for 1,000 subjects with HAE dosed with 40 IU/kg and 60 IU/kg C1‐INH (SC) were simulated using the final population PK model. The proportion of HAE subjects expected to have C1‐INH(f) levels greater than the levels related to a relative risk reduction (50%, 70%, and 90%) were derived for C1‐INH (SC) doses of 40 IU/kg and 60 IU/kg (Figure 4). Based on the simulations, Ctrough levels of 40.2% would be obtained at 40 IU/kg C1‐INH (SC) and 48.0% at 60 IU/kg C1‐INH (SC). At the 40 IU/kg dose, 50.0% of patients with HAE were estimated to experience a ≥70% reduction in the risk of an HAE attack when compared to no prophylaxis. At the 60 IU/kg dose, 67% of patients with HAE were estimated to experience a ≥70% reduction in relative risk. Overall, the 40 IU/kg and 60 IU/kg doses may both achieve ≥50% reductions in the relative risk of an HAE attack in over 72% of subjects. The difference between the two doses was most pronounced at the ≥90% reduction in relative risk of an HAE attack. The reduction in relative risk of an HAE attack was always greater in a higher percentage of subjects with the 60 IU/kg dose (Table 3).
Table 3.
Proportions of patients receiving C1‐INH (SC) expected to exceed C1‐INH(f) activity levels associated with a reduction in relative risk of a breakthrough HAE attack
| Dose of C1‐INH (SC) | ||
|---|---|---|
| 40 IU/kg | 60 IU/kg | |
| ≥50% relative risk reduction (C1‐INH(f) = 33.1%) | 72.5% | 87.0% |
| ≥70% relative risk reduction (C1‐INH(f) = 40.3%) | 50.3% | 67.4% |
| ≥90% relative risk reduction (C1‐INH(f) = 63.1%) | 7.30% | 20.3% |
Ctrough, minimum (trough)/plasma functional activity at steady state; C1‐INH, C1‐inhibitor; C1‐INH(f), C1‐inhibitor functional activity; HAE, hereditary angioedema.
Simulations were performed using the final population pharmacokinetic model in 1,000 virtual patients.
DISCUSSION
A subcutaneous formulation of C1‐INH (CSL830), which was recently approved by the FDA, offers a new option for routine prevention of HAE attacks in adolescents and adults. In the phase III COMPACT trial, patients who received twice‐weekly prophylactic doses of 40 IU/kg and 60 IU/kg C1‐INH (SC) experienced significantly fewer HAE attacks than patients who received placebo (P < 0.001 for both comparisons). Overall, HAE attack rates were reduced by a median of 89% for the 40 IU/kg and by 95% for the 60 IU/kg dose.6
It was previously suggested that a critical level for C1‐INH(f), below which patients with HAE were more likely to experience HAE attacks, was at ∼40% of normal C1‐INH(f); however, this was based on the relationship between C1‐INH antigen and apparent function.10 As yet, the relationship between C1‐INH(f) levels and the risk of HAE attacks has not been evaluated. The present analysis, using phase III COMPACT data, aimed to develop an exposure–response model quantifying the relationship between C1‐INH(f) and attack risk, and to identify patient factors that may influence this relationship.
This analysis substantiates the phase III COMPACT study results and supports the prophylactic use of C1‐INH (SC) in patients with HAE. First, our interval‐censored Emax‐based time‐to‐event model adequately described the relationship between plasma C1‐INH(f) and the frequency and timing of HAE attacks, such that higher C1‐INH functional activities corresponded to greater reductions in attack risk. Second, covariate testing in the exposure–response model revealed an effect of age on the baseline risk of experiencing an attack; the prophylactic effect of C1‐INH (SC) was, however, independent of age. Other covariates tested, including body weight, gender, observed baseline C1‐INH(f), baseline HAE attack counts, and HAE type (I vs. II), did not demonstrate a major influence on the baseline risk of having an HAE attack or the effect of C1‐INH (SC) treatment. Third, administration of either the 40 IU/kg or 60 IU/kg dose resulted in ≥50% reductions in the relative attack risk in the majority of subjects, with the risk reduction greater in a higher percentage of subjects treated with the 60 IU/kg dose. Fourth, the findings of this analysis corroborate the previously suggested critical level of 40% for C1‐INH(f), below which patients with HAE are more likely to experience HAE attacks.10
Based on this model, the maintenance of higher steady‐state values of C1‐INH(f) would provide greater preventive effect, thus significantly decreasing the risk of experiencing an HAE attack compared to no treatment. This analysis also revealed the potential for further optimization of dosing that may provide almost complete protection against HAE attacks through the use of the exposure–response model. This model may also be used to compare various dosing regimens and routes of administration. The model may be further explored for its utility in individualized dosing to achieve improved attack protection.
To the best of our knowledge, the present analysis is the first attempt to quantify the relationship between the risk of HAE attacks and C1‐INH(f) after replacement therapy. Unlike traditional methods of logistic and linear regression, time‐to‐event models, such as those used in this analysis, naturally encompass both the frequency and timing of events.11 Interval censoring was used because the event timing during the day was unknown; this censoring avoided assumptions about imputing the event time and also the PK parameter driving the relationship (such as trough plasma concentration (Cmin) or average concentration (Cavg)). The effect of C1‐INH(f) was applied to the instantaneous risk of an event, and this risk was integrated over the day to determine the probability that an HAE attack occurred. The predictive performance of the final model was evaluated by applying a visual predictive check to assess how closely model simulations replicated the cumulative distribution of the frequency of breakthrough attacks normalized by month (the primary endpoint of the study). The interpretation of this approach differs from the selection of a PK driver that may or may not be verified, given that the exact event times were not known.
The visual predictive check did not account for the dropout rate; however, it should be noted that this rate was minor and not linked to HAE attacks. Lack of perfect fit may be due to linking the risk of HAE attack directly to plasma C1‐INH(f). HAE is a local disease, such that events occur peripherally, and, thus, risk may be related more to C1‐INH levels in different tissues of the body. It should be noted that the model provides a conservative estimate—it overpredicts the distribution of larger numbers of HAE attack counts, thus, to some extent, understating the full potential of C1‐INH treatment. As such, the Emax relationship between risk and plasma concentration may only approximate the true relationship between risk and overall C1‐INH exposure. Nevertheless, by assessing general aggregate risk for HAE attacks in relation to target and actionable plasma C1‐INH(f) exposures, we established that plasma C1‐INH concentration can sufficiently predict attack risk so as to provide guidance for informing dosage regimens that will be useful to patients with HAE.
In conclusion, we describe an interval‐censored repeated time‐to‐event model able to characterize the exposure–response relationship between C1‐INH(f) and the risk of breakthrough HAE attacks. The defined exposure–response relationship confirmed that a greater reduction in the relative risk of an HAE attack correlates with increasing C1‐INH functional activities.
Conflict of Interest
M.H. was a consultant for CSL Behring. B.Z. received research funding from Shire; was a consultant for CSL Behring, Dyax, Isis, and BioCryst; and a speaker for Dyax and RMEI. T.C. received research funding from CSL Behring, Shire, Grifols, and BioCryst; speaker fees from CSL Behring, Grifols, and Shire; is a consultant for CSL Behring and Shire. H.L. reports personal fees from CSL Behring during the conduct of the study; grant support and personal fees from BioCryst, and grant support, personal fees, and other support from CSL Behring and Shire (including Dyax/Viropharma) outside the submitted work. M.C. is a consultant for CSL Behring, Viropharma, Dyax, SOBI, Pharming, BioCryst, and Sigma Tau; and received research/educational grants from Shire and CSL Behring. Y.Z., M.T., D.P., I.P., T.M., and J.S. are employees of CSL Behring.
Author Contributions
Y.Z., D.P., M.T., M.H., T.M., and J.S. wrote the manuscript. I.P. designed the research. B.Z., M.C., T.C., and H.L. performed the research. Y.Z., M.H., D.P., and M.T. analyzed the data.
Supporting information
Supplementary Text and Table: 2017.10.11 Exposure‐response analysis publication supplementary RESUBMISSION FINAL.docx
Table S1. Summary of covariate testing using WAM and NONMEM.
Model code
Acknowledgments
The authors thank all of the patients and their families who contributed to this study, and all of the participating investigators, research nurses, and data coordinators. The authors would also like to note the contributions of the late Matthew Hutmacher to this study and to the field of pharmacometrics. This study was sponsored by CSL Behring, Marburg, Germany. Editorial assistance was provided by Succinct Medical Communications, with financial support from CSL Behring.
This article was published online on 09 January 2018. Minor edits have been made that do not affect data. This notice is included in the online and print versions to indicate that both have been corrected 22 January 2018.
References
- 1. Zuraw, B.L. Clinical practice. Hereditary angioedema. N. Engl. J. Med. 359, 1027–1036 (2008). [DOI] [PubMed] [Google Scholar]
- 2. Toscani, M. & Riedl, M. Meeting the challenges and burdens associated with hereditary angioedema. Manag. Care 20, 44–51 (2011). [PubMed] [Google Scholar]
- 3. Zuraw, B.L. et al US Hereditary Angioedema Association Medical Advisory Board 2013 recommendations for the management of hereditary angioedema due to C1 inhibitor deficiency. J. Allergy Clin. Immunol. Pract. 1, 458–467 (2013). [DOI] [PubMed] [Google Scholar]
- 4. Craig, T. et al WAO guideline for the management of hereditary angioedema. World Allergy Organ. J. 5, 182–199 (2012). [DOI] [PMC free article] [PubMed] [Google Scholar]
- 5. Zuraw, B.L. et al Phase II study results of a replacement therapy for hereditary angioedema with subcutaneous C1‐inhibitor concentrate. Allergy 70, 1319–1328 (2015). [DOI] [PMC free article] [PubMed] [Google Scholar]
- 6. Longhurst, H.J. et al Prevention of hereditary angioedema attacks with subcutaneous C1 inhibitor. N. Engl. J. Med. 376, 1131–1140 (2017). [DOI] [PubMed] [Google Scholar]
- 7. Karlsson, K.E. , Plan, E.L. & Karlsson, M.O. Performance of three estimation methods in repeated time‐to‐event modeling. AAPS J. 13, 83–91 (2011). [DOI] [PMC free article] [PubMed] [Google Scholar]
- 8. Juul, R.V. , Rasmussen, S. , Kreilgaard, M. , Christrup, L.L. , Simonsson, U.S. & Lund, T.M. Repeated time‐to‐event analysis of consecutive analgesic events in postoperative pain. Anesthesiology 123, 1411–1419 (2015). [DOI] [PubMed] [Google Scholar]
- 9. Kowalski, K.G. & Hutmacher, M.M. Efficient screening of covariates in population models using Wald's approximation to the likelihood ratio test. J. Pharmacokinet. Pharmacodyn. 28, 253–275 (2001). [DOI] [PubMed] [Google Scholar]
- 10. Späth, P.J. , Wüthrich, B. & Bütler, R. Quantification of C1‐inhibitor functional activities by immunodiffusion assay in plasma of patients with hereditary angioedema–evidence of a functionally critical level of C1‐inhibitor concentration. Complement 1, 147–159 (1984). [DOI] [PubMed] [Google Scholar]
- 11. Holford, N. A time to event tutorial for pharmacometricians. CPT Pharmacometrics Syst. Pharmacol. 2, e43 (2013). [DOI] [PMC free article] [PubMed] [Google Scholar]
Associated Data
This section collects any data citations, data availability statements, or supplementary materials included in this article.
Supplementary Materials
Supplementary Text and Table: 2017.10.11 Exposure‐response analysis publication supplementary RESUBMISSION FINAL.docx
Table S1. Summary of covariate testing using WAM and NONMEM.
Model code