Abstract
Background:
Sacopenia is a common problem in elderly with the adverse outcomes. The objective of this study was to estimate the peak appendicular skeletal muscle mass (ASM) and age of its attainment by sex among the Iranian population.
Methods:
A total of 691 men and women aged 18–94 years participated in this cross-sectional, population-based study in Bushehr, Iran. ASM was measured by dual X-ray absorptiometry. Cutoff points for men and women were established considering two standard deviations (SDs) below the mean values of the skeletal muscle index (SMI) for young reference groups. The relationship between ASM and age was described by the second-degree regression models. Two SDs below the mean SMIs of reference groups were as cutoff values of low muscle mass in Iranian population.
Results:
The peak ASM values were 21.35 ± 0.12 Kg and 13.68 ± 0.10 Kg, and the age at peak ASM were 26 (24–28) years and 34 (33–35) years for men and women, respectively. Mean and SD of SMI in those ages were 7.01 ± 0.02 Kg/m2 and 5.44 ± 0.02 Kg/m2 among men and women, respectively. Calculated cutoff values of low muscle mass among the Iranian population were 7.0 Kg/m2 and 5.4 Kg/m2 among men and women, respectively.
Conclusions:
Iranian reference values of SMI for both genders were similar to Asia Working Group for Sarcopenia recommendation and lower than the United States and European values. Further studies from different nations and the Middle East countries are needed to obtain reference values for populations, enabling the researchers for comparison and also more valid reports on sarcopenia prevalence.
Keywords: Iran, peak muscle mass, reference values, sarcopenia
Introduction
The skeletal muscle mass plays an important role in functions such as movement and metabolism and loss of muscle mass is a common problem in the elderly.[1] The age-related loss of muscle mass along with muscle functions is called sarcopenia.[2] Sarcopenia is now recognized as a major public health problem in the world with adverse outcomes such as physical disability, poor quality of life, falling, related skeletal fracture, and even death.[3,4,5]
Researches in Europe and Asia have developed a consensus set of diagnostic criteria for sarcopenia based on its parameters.[2,6] Determining the most appropriate reference value of muscle mass for the purpose of establishing a sarcopenic diagnosis is still an important issue in different populations in the world. To establish low muscle mass, some studies have assessed the total or appendicular skeletal muscle in young adults as the reference value.[7,8] For a clinically applicable definition, correction factors such as height, body mass index, and body fat have been used.[4,8,9] To calculate skeletal muscle index (SMI), the sum of muscle masses of the four limbs is defined as appendicular skeletal muscle mass (ASM) (SMI; ASM/height2). Several cut points based on SMI have been derived; however, some factors, such as measurement techniques, age, gender, and ethnicity affect these cutoffs.[10] Some studies have used the cut points based on SMI from the European Working Group on Sarcopenia in Older People (EWGSOP) or Asia Working Group for Sarcopenia (AWGS) guidelines.[11,12,13] Furthermore, researchers have shown significant differences and a strong bias in the prevalence of sarcopenia when different cut points of the distinct populations are used instead of the original sex-specific group of subjects.[14] Therefore, the recommendation is that SMI would ideally refer to sex-specific ethnic group populations. For the Iranian population, no reference value of ASM exists and few studies on sarcopenia have used a cutoff point derived from EWGSOP.
For this reason, the aim of this study was to determine cut points of SMI for Iranian subjects, which can lead to reference values in Iran and other Middle East countries.
Methods
Study population
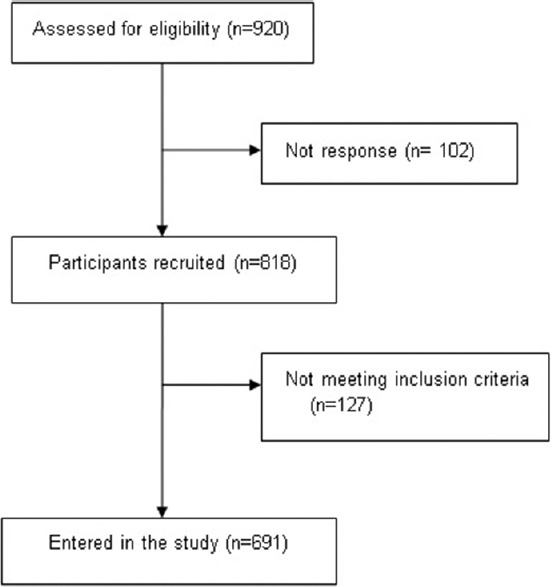
The study was performed in 2016 among healthy Iranian subjects who live in urban areas of Bushehr city, the capital of Bushehr province in southwestern Iran. The participants in this study were selected through a multistage, age and sex stratified, and cluster-random sampling. Equal size clusters were selected based on a systematic random approach among unique postal codes for each household with the cooperation of the post office. As shown in Figure 1, among 920 individuals who were invited, a total of 818 attended the clinic (response rate: 88.9%). In each cluster, individuals were invited to participate in the study among 46 age-sex groups. Age groups have been defined in 3-year-old increments between 18 and 94 years old. All individuals were evaluated for the eligibility criteria. We selected subjects free from metabolic diseases (cardiovascular disease, diabetes, and hypertension), any kind of cancer and they were not taking any medications that may affect muscle functions or weight (corticosteroids, bisphosphonates, parathyroid hormone, calcium, and vitamin D). In addition, we included subjects with body mass index BMI between 18 and 30 Kg/m2.
Figure 1.

Flow chart of enrollments the study
The study was approved by the National Institute for Medical Research Development. A written informed consent was signed by all the participants.
Measurements
Anthropometric measurements were taken with shoes removed and with the participants wearing light clothing. The height and weight were measured with a fixed stadiometer and a digital scale according to the standard protocol. BMI was calculated as weight (Kg) divided by height (m2). A flexible circumference measuring tape was used to measure waist circumference; at a point midway between the iliac crest and the lowest rib in the standing position, and the hip circumference was measured at the widest part of the hip. All measurements were read to the nearest 0.1 cm.
Body composition for each participant was measured using dual X-ray absorptiometry (DXA) (DXA, Discovery WI, Hologic Inc., USA; CV = 1% for whole body values). The device could measure bone mineral density, fat mass as well as muscle mass of the head, trunk, and extremities separately with minimal radiation exposure. According to DXA results, we calculated the ASM for each participant as the sum of the upper and lower limb muscle mass without fat and bone tissue. The time required for the evaluation of each person was 20 min.
The participants were also interviewed by trained nurses and then completed a questionnaire regarding sociodemographic data, lifestyle factors, medical, and drug use history.
Skeletal muscle mass indices and cutoff points
The SMI was defined as ASM/height2 (Kg/m2). According to EWGSOP, the International Working Group on Sarcopenia IWGS, and AWGS definitions, cutoff points for men and women were established considering two SDs below the mean values of indices for young reference groups.[2,6,15]
Statistical analysis
The normality of variables was assessed using visual inspection of histograms and the measures of skewness and kurtosis as well as Kolmogorov–Smirnov and Shapiro–Wilk tests. The square root transformation was applied to ASM and SMI values to fit the normal distribution assumption.
To estimate the relationship between the ASM and age in both genders, three regression models (up to the third degree) were fitted to the scatter diagrams of the two variables. To find the best-fitted model, we used a hierarchical approach. In this model, the cubic model was first considered as the “saturated” model and was compared with the quadratic model as the “reduced” model using adjusted r2 and root MSE. Rejection of the null hypothesis in this test meant that the “saturated” model is the appropriate model for the calculation of the Peak ASM, and the inability to reject the null hypothesis indicated an acceptance of the “reduced” model. In the second case, this process was repeated for the comparison of the quadratic and linear models. After fitting the best models, the corresponding equations for the fitted curves or lines were constructed and the age point of peak ASM was identified. Participants within the nearest 5-year-age group, calculated as peak ASM age point ±2 years for models, were considered as a reference group.
The analysis was performed using SPSS (version 16; SPSS Inc., Chicago, IL, USA) and STATA (Release 12. Statistical software. STATA Corp., LP, College Station, Texas, USA).
Results
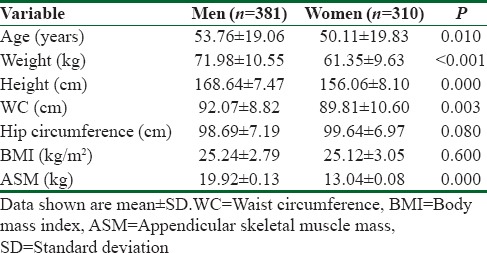
In total, 691 participants aged 18–94 years (381 men and 310 women) were selected for the study [Figure 1]. As expected, ASM in men was higher than in women (P < 0.001). In addition, there was a significant difference in waist circumference between men and women (P = 0. 003).
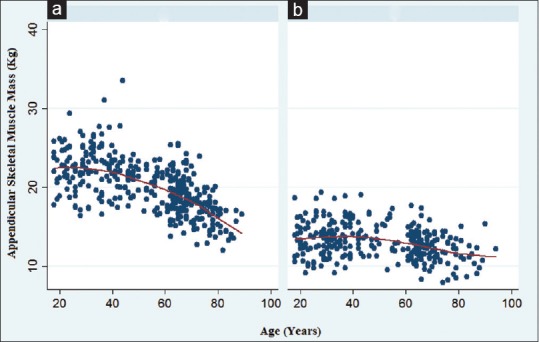
The distribution of the ASM according to age was presented as scatter plots in both genders in Figure 2 and Table 1. As expected, the ASM increased during younger ages and then gradually declined with increasing of the age in both genders.
Figure 2.

Scatter plots for age-related changes in the appendicular skeletal muscle mass in men (a) and women (b)
Table 1.
General characteristics of study subjects

The relationship between ASM and age was best described by the second-degree regression models in both genders. Based on these equations [Table 2], age points with highest ASM values were estimated and these points were used for determining a 5-year age interval with the peak ASM. The peak ASM value for men was 21.35 ± 0.12 Kg and the age at the peak ASM was around 26 (24-28 years). The corresponding value for the peak ASM among women was 13.68 ± 0.10 Kg but the age at this peak was between 33 and 37. These values were used for calculating SMI in both sexes. The mean and standard deviation (SD) of SMI in those ages were calculated 7.01 ± 0.02 Kg/m2 and 5.44 ± 0.02 Kg/m2 in men and women, respectively. Two SDs below the mean SMIs of the reference groups were 7.0 Kg/m2 in men and 5.4 Kg/m2 in women and were considered as cutoff values of low muscle mass in the Iranian population.
Table 2.
Maximum appendicular skeletal muscle mass values and related age groups for men and women

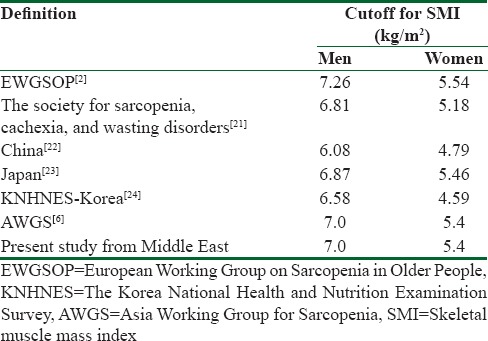
Table 3 shows cutoff points of SMI that have been provided by EWGSOP, AWGS, other studies, and our results.
Table 3.
Comparison of cutoff for skeletal muscle mass index in different studies

Discussion
The present study is the first population-based investigation that characterizes reference values of muscle mass among healthy subjects in Iran. We found that men aged 24-28 and women aged 33-37 had a peak ASM, and the mean± SD of SMI in those ages were 7.01±0.02 kg/m2 for men and 5.44±0.02 kg/m2 for women. Cut-off points for SMIs were 7.0 kg/m2 and 5.4 kg/m2 in Iranian men and women respectively.
To assess sarcopenia, a common problem in the elderly, it is essential to establish an appropriate measure for the diagnosis of this disease. In recent years, some research groups in the world have been trying to make a consensus definition, diagnosis and management of sarcopenia.[2]
Based on different definitions, skeletal muscle mass is evaluated by magnetic resonance imaging (MRI), computed tomography (CT), dual energy absorptiometry (DXA) and bio-impedance analysis (BIA). However, CT and MRI are the gold standards of assessing muscle mass; there are many limitations in terms of cost and radiation exposure. BIA is also a noninvasive and inexpensive method for measuring fat and muscle mass, but it may overestimate muscle mass.[2,16] Therefore, DXA is an appropriate alternative to evaluate body composition and EWGSOP, IWGS and AWGS have accepted the determination of cut-off points for low muscle mass by DXA as a parameter for sarcopenia.[2,6,15]
Some studies have used fat free mass[17,18], the total skeletal muscle mass[7,9,19], and ASM[8,20], as the parameters for muscle mass. There are some different methods used to define cut-off points for muscle mass. Some use two standard deviations below the mean values of indices for young adults from the same population under study[21,22]; while some others use the sex specific lowest quintile of the older study participants.[9,19]
Other studies use the cut-off values that were recommended by EWGSOP or AWGS.[11,23] Studies have shown that the prevalence of sarcopenia may not be accurate when reference values of the selfsame population are unavailable.[16,24] Therefore, EWGSOP and AWGS have encouraged the use of healthy young adults’ data of the same population to obtain valid cut-off points for the world population in order to improve the diagnosis of low muscle mass and sarcopenia in an elderly population.
Muscle mass decreases approximately 3–8% per decade after the age of 30 and this rate of decline is even greater after the age of 60.[25] The age-related skeletal muscle mass decline is associated with gender and ethnic differences.[26] The ASM in our study reached a peak at the age of 35 in women, which was later than that of the studied women from China[20] but comparable with their Italian, Korean and Indian counterparts[27,28,29]. Also, the peak ASM occurred among the 24 to 28-year-old Iranian men, which was similar to data gathered in Italy and China.[20,27] It seems that the peak ASM occurs about one decade later among women than men. This should be discussed and studied more to discover its determinants and underlying factors.
Table 3 compares our cut- offs for SMI, measured by using DXA, with other populations. According to EWGSOP, based on a definition proposed by Cruz-Jentoft et al in 2010[2], individuals whose SMI is 2 or more than the standard deviations below sex-specific means of the Rosetta study[26] reference data set are defined as having low muscle mass. Cut-offs for this definition are 7.26 kg/m2 for men and 5.54 kg/m2 for women. Another definition was proposed by Morley et al. for the Society for Sarcopenia, Cachexia, and Wasting Disorders in 2011.[30] Low SMI is defined as 2 SD below the mean of healthy individuals aged 20 -30, with NHANES IV study[31] as the reference population. Cut-offs for this definition are 6.81 kg/m2 and 5.18 kg/m2 for men and women respectively. In recent years, many studies were conducted in Asian countries. In one study in china[20], the cut- off values for sarcopenia were defined as 6.08 Kg/m2 for men and 4.79 Kg/m2 for women. However, other studies among the Japanese[32] and Koreans[33,34] indicated that the cut- off values SMI are relatively higher among Chinese people, but generally, the peak ASM value is lower in the Asian population than the western countries.[6] These results show that even within the same race, there is a significant variation in peak muscle mass, which may reflect the impact of other factors on the occurrence of sarcopenia. Overall, AWGS recommended using height- adjusted ASM, and suggested cut- offs be 7.0 Kg/m2 in men and 5.4 Kg/m2 in women by using DXA.[6] In our study, Iranian reference values for both genders are similar to the AWGS recommendation and lower than the United States and European values. As our study results reveal, it seems that the cut- off points for sarcopenia in the Middle East are similar to Eastern Asian countries and lower than western countries.
However, ethnic differences may be the main reason for this difference; other factors such as lifestyle habits, body size and cultural backgrounds should be considered. Therefore, comparing the prevalence of sarcopenia in different races in various countries is difficult, mostly because of practical difficulties in measurement techniques of muscle mass, reference data, differences in the age of the study population and the selection bias.
The present results have to be interpreted within the context of strengths and potential limitations. Firstly, the study represents one of the studies of sarcopenia in the Middle East, and as such, it increases the reliability of estimates of peak ASM, SMI and prevalence of sarcopenia in this region. Secondly, the participants were randomly selected, which confirms the representativeness of our population. Thirdly, the technique of measurement of ASM with DXA is considered the “gold standard” after CT and MRI for the assessment of muscle mass.
Nevertheless, the study also has a number of potential limitations. The participants in this study were sampled from an urban population; as a result, the study's finding may not be generalisable to the rural population. Also, the peak ASM should be estimated from a longitudinal study in which a large number of men and women are followed, but such a study is not practically possible. On the other hand, estimating the peak ASM in a cross-sectional study such as the present study can be biased by unmeasured confounders.
Conclusions
Our study suggests cut-off values for SMI in an Iranian population by using DXA. Further studies from different nations along with Middle Eastern countries are needed to obtain reference values for populations, enabling the researchers to compare and also produce more valid reports on sarcopenia prevalence.
Financial support and sponsorship
This study was financially supported by a grant from the National Institute for Medical Research Development (Grant Number; 940613).
Conflicts of interest
There are no conflicts of interest.
Acknowledgments
We would also like to thank all the personnel of the Persian Gulf Tropical Medicine Research Center and all the individuals who took part in the study.
References
- 1.Janssen I, Ross R. Linking age-related changes in skeletal muscle mass and composition with metabolism and disease. J Nutr Health Aging. 2005;9:408–19. [PubMed] [Google Scholar]
- 2.Cruz-Jentoft AJ, Baeyens JP, Bauer JM. Sarcopenia: European consensus on definition and diagnosis: Report of the European Working Group on Sarcopenia in Older People. Age Ageing. 2010;39:412–23. doi: 10.1093/ageing/afq034. [DOI] [PMC free article] [PubMed] [Google Scholar]
- 3.Landi F, Liperoti R, Russo A. Sarcopenia as a risk factor for falls in elderly individuals: results from the ilSIRENTE study. Clin Nutr. 2012;31:652–8. doi: 10.1016/j.clnu.2012.02.007. [DOI] [PubMed] [Google Scholar]
- 4.Janssen I, Heymsfield SB, Ross R. Low relative skeletal muscle mass (sarcopenia) in older persons is associated with functional impairment and physical disability. J Am Geriatr Soc. 2002;50:889–96. doi: 10.1046/j.1532-5415.2002.50216.x. [DOI] [PubMed] [Google Scholar]
- 5.Arango-Lopera VE, Arroyo P, Gutierrez-Robledo LM, et al. Mortality as an adverse outcome of sarcopenia. J Nutr Health Aging. 2013;17:259–62. doi: 10.1007/s12603-012-0434-0. [DOI] [PMC free article] [PubMed] [Google Scholar]
- 6.Chen LK, Liu LK, Woo J, et al. Sarcopenia in Asia: consensus report of the Asian Working Group for Sarcopenia. J Am Med Dir Assoc. 2014;15:95–101. doi: 10.1016/j.jamda.2013.11.025. [DOI] [PubMed] [Google Scholar]
- 7.Janssen I, Baumgartner RN, Ross R, et al. Skeletal muscle cutpoints associated with elevated physical disability risk in older men and women. Am J Epidemiol. 2004;159:413–21. doi: 10.1093/aje/kwh058. [DOI] [PubMed] [Google Scholar]
- 8.Baumgartner RN, Koehler KM, Gallagher D, et al. Epidemiology of sarcopenia among the elderly in New Mexico. Am J Epidemiol. 1998;147:755–63. doi: 10.1093/oxfordjournals.aje.a009520. [DOI] [PubMed] [Google Scholar]
- 9.Newman AB, Kupelian V, Visser M, et al. Sarcopenia: alternative definitions and associations with lower extremity function. J Am Geriatr Soc. 2003;51:1602–9. doi: 10.1046/j.1532-5415.2003.51534.x. [DOI] [PubMed] [Google Scholar]
- 10.Cruz-Jentoft AJ, Landi F, Schneider SM, et al. Prevalence of and interventions for sarcopenia in ageing adults: a systematic review. Report of the International Sarcopenia Initiative (EWGSOP and IWGS) Age Ageing. 2014;43:748–59. doi: 10.1093/ageing/afu115. [DOI] [PMC free article] [PubMed] [Google Scholar]
- 11.Hashemi R, Shafiee G, Motlagh AD, et al. Sarcopenia and its associated factors in Iranian older individuals: Results of SARIR study. Arch Gerontol Geriatr. 2016;66:18–22. doi: 10.1016/j.archger.2016.04.016. [DOI] [PubMed] [Google Scholar]
- 12.Patel HP, White MC, Westbury L, et al. Skeletal muscle morphology in sarcopenia defined using the EWGSOP criteria: findings from the Hertfordshire Sarcopenia Study (HSS) BMC Geriatr. 2015;15:171. doi: 10.1186/s12877-015-0171-4. [DOI] [PMC free article] [PubMed] [Google Scholar]
- 13.Hashemi R, Heshmat R, Motlagh AD, et al. Sarcopenia and its determinants among Iranian elderly (SARIR): study protocol. J Diabetes Metab Disord. 2012;11:23. doi: 10.1186/2251-6581-11-23. [DOI] [PMC free article] [PubMed] [Google Scholar]
- 14.Bijlsma AY, Meskers CG, Ling CH, et al. Defining sarcopenia: the impact of different diagnostic criteria on the prevalence of sarcopenia in a large middle aged cohort. Age (Dordr) 2013;35:871–81. doi: 10.1007/s11357-012-9384-z. [DOI] [PMC free article] [PubMed] [Google Scholar]
- 15.Lee WJ, Liu LK, Peng LN, et al. Comparisons of sarcopenia defined by IWGS and EWGSOP criteria among older people: results from the I-Lan longitudinal aging study. J Am Med Dir Assoc. 2013;14:528e1–7. doi: 10.1016/j.jamda.2013.03.019. [DOI] [PubMed] [Google Scholar]
- 16.Beaudart C, Reginster JY, Slomian J, et al. Estimation of sarcopenia prevalence using various assessment tools. Exp Gerontol. 2015;61:31–7. doi: 10.1016/j.exger.2014.11.014. [DOI] [PubMed] [Google Scholar]
- 17.Castillo EM, Goodman-Gruen D, Kritz-Silverstein D, et al. Sarcopenia in elderly men and women: the Rancho Bernardo study. Am J Prev Med. 2003;25:226–31. doi: 10.1016/s0749-3797(03)00197-1. [DOI] [PubMed] [Google Scholar]
- 18.Gould H, Brennan SL, Kotowicz MA, et al. Total and appendicular lean mass reference ranges for Australian men and women: the Geelong osteoporosis study. Calcif Tissue Int. 2014;94:363–72. doi: 10.1007/s00223-013-9830-7. [DOI] [PubMed] [Google Scholar]
- 19.Delmonico MJ, Harris TB, Lee JS, et al. Alternative definitions of sarcopenia, lower extremity performance, and functional impairment with aging in older men and women. J Am Geriatr Soc. 2007;55:769–74. doi: 10.1111/j.1532-5415.2007.01140.x. [DOI] [PubMed] [Google Scholar]
- 20.Cheng Q, Zhu X, Zhang X, et al. A cross-sectional study of loss of muscle mass corresponding to sarcopenia in healthy Chinese men and women: reference values, prevalence, and association with bone mass. J Bone Miner Metab. 2014;32:78–88. doi: 10.1007/s00774-013-0468-3. [DOI] [PubMed] [Google Scholar]
- 21.Tichet J, Vol S, Goxe D, et al. Prevalence of sarcopenia in the French senior population. J Nutr Health Aging. 2008;12:202–6. doi: 10.1007/BF02982621. [DOI] [PubMed] [Google Scholar]
- 22.Masanes F, Culla A, Navarro-Gonzalez M, et al. Prevalence of sarcopenia in healthy community-dwelling elderly in an urban area of Barcelona (Spain) J Nutr Health Aging. 2012;16:184–7. doi: 10.1007/s12603-011-0108-3. [DOI] [PubMed] [Google Scholar]
- 23.Beaudart C, Reginster JY, Petermans J, et al. Quality of life and physical components linked to sarcopenia: The SarcoPhAge study. Exp Gerontol. 2015;69:103–10. doi: 10.1016/j.exger.2015.05.003. [DOI] [PubMed] [Google Scholar]
- 24.Pagotto V, Silveira EA. Applicability and agreement of different diagnostic criteria for sarcopenia estimation in the elderly. Arch Gerontol Geriatr. 2014;59:288–94. doi: 10.1016/j.archger.2014.05.009. [DOI] [PubMed] [Google Scholar]
- 25.Volpi E, Nazemi R, Fujita S. Muscle tissue changes with aging. Curr Opin Clin Nutr Metab Care. 2004;7:405–10. doi: 10.1097/01.mco.0000134362.76653.b2. [DOI] [PMC free article] [PubMed] [Google Scholar]
- 26.Gallagher D, Visser M, De Meersman RE, et al. Appendicular skeletal muscle mass: effects of age, gender, and ethnicity. J Appl Physiol (1985) 1997;83:229–39. doi: 10.1152/jappl.1997.83.1.229. [DOI] [PubMed] [Google Scholar]
- 27.Coin A, Sarti S, Ruggiero E, et al. Prevalence of sarcopenia based on different diagnostic criteria using DEXA and appendicular skeletal muscle mass reference values in an Italian population aged 20 to 80. J Am Med Dir Assoc. 2013;14:507–12. doi: 10.1016/j.jamda.2013.02.010. [DOI] [PubMed] [Google Scholar]
- 28.Kwon HJ, Ha YC, Park HM. The Reference Value of Skeletal Muscle Mass Index for Defining the Sarcopenia of Women in Korea. J Bone Metab. 2015;22:71–5. doi: 10.11005/jbm.2015.22.2.71. [DOI] [PMC free article] [PubMed] [Google Scholar]
- 29.Marwaha RK, Garg MK, Bhadra K, et al. Assessment of lean (muscle) mass and its distribution by dual energy X-ray absorptiometry in healthy Indian females. Arch Osteoporos. 2014;9:186. doi: 10.1007/s11657-014-0186-z. [DOI] [PubMed] [Google Scholar]
- 30.Morley JE, Abbatecola AM, Argiles JM, et al. Sarcopenia with limited mobility: an international consensus. J Am Med Dir Assoc. 2011;12:403–9. doi: 10.1016/j.jamda.2011.04.014. [DOI] [PMC free article] [PubMed] [Google Scholar]
- 31.Kelly TL, Wilson KE, Heymsfield SB. Dual energy X-Ray absorptiometry body composition reference values from NHANES. PLoS One. 2009;4:e7038. doi: 10.1371/journal.pone.0007038. [DOI] [PMC free article] [PubMed] [Google Scholar]
- 32.Sanada K, Miyachi M, Tanimoto M, et al. A cross-sectional study of sarcopenia in Japanese men and women: reference values and association with cardiovascular risk factors. Eur J Appl Physiol. 2010;110:57–65. doi: 10.1007/s00421-010-1473-z. [DOI] [PubMed] [Google Scholar]
- 33.Kim YS, Lee Y, Chung YS, et al. Prevalence of sarcopenia and sarcopenic obesity in the Korean population based on the Fourth Korean National Health and Nutritional Examination Surveys. J Gerontol A Biol Sci Med Sci. 2012;67:1107–13. doi: 10.1093/gerona/gls071. [DOI] [PubMed] [Google Scholar]
- 34.Kim YP, Joh JY, Kim S. The application of different appendicular skeletal muscle cutoff points and research definitions associated with health-related quality of life in Korean older people: data from KNHANES 2008-2011. BMC Geriatr. 2014;14:144. doi: 10.1186/1471-2318-14-144. [DOI] [PMC free article] [PubMed] [Google Scholar]


