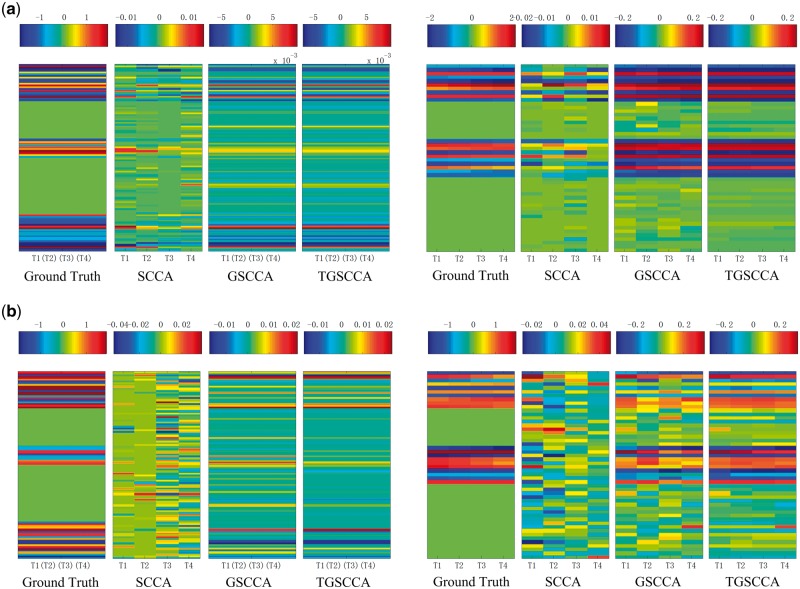
Fig. 3.
The estimated weights of u and v from average 5-fold cross-validation test on simulation data are shown in the left five panels and right five panels. Ground truth of w and v are shown in the most left in the two parts, respectively. The estimated u values and v values are shown in the remaining panels, corresponding to different methods. (a) Results on simulation data 1. (b) Results on simulation data 2

