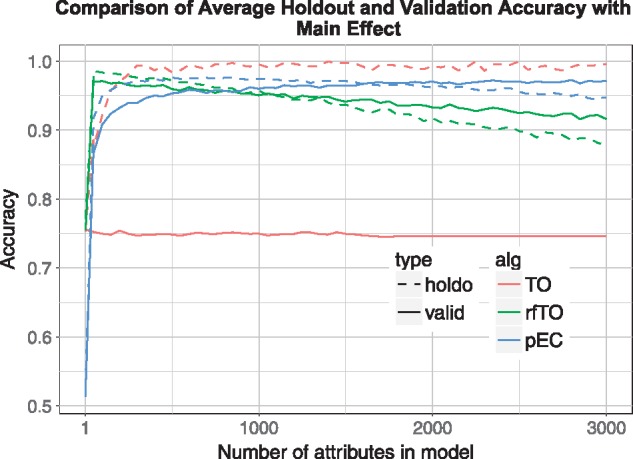
Fig. 5.

Main effect simulation results. replicate simulations, samples, attributes, functional attributes, effect size . Standard thresholdout (TO/red) overfits the independent validation data set; private Evaporative Cooling (pEC/blue) and thresholdout random forest (rfTO/green) give holdout accuracies that are very close to validation accuracies; for reference, standard random forest mean OOB accuracy = 0.832 (Color version of this figure is available at Bioinformatics online.)
