

Abstract
Summary
Most pre-mRNA transcripts in eukaryotic cells must undergo splicing to remove introns and join exons, and splicing elements present a large mutational target for disease-causing mutations. Splicing elements are strongly position dependent with respect to the transcript annotations. In 2012, we presented Spliceman, an online tool that used positional dependence to predict how likely distant mutations around annotated splice sites were to disrupt splicing. Here, we present an improved version of the previous tool that will be more useful for predicting the likelihood of splicing mutations. We have added industry-standard input options (i.e. Spliceman now accepts variant call format files), which allow much larger inputs than previously available. The tool also can visualize the locations—within exons and introns—of sequence variants to be analyzed and the predicted effects on splicing of the pre-mRNA transcript. In addition, Spliceman2 integrates with RNAcompete motif libraries to provide a prediction of which trans-acting factors binding sites are disrupted/created and links out to the UCSC genome browser. In summary, the new features in Spliceman2 will allow scientists and physicians to better understand the effects of single nucleotide variations on splicing.
Availability and implementation
Freely available on the web at http://fairbrother.biomed.brown.edu/spliceman2. Website implemented in PHP framework—Laravel 5, PostgreSQL, Apache, and Perl, with all major browsers supported.
Supplementary information
Supplementary data are available at Bioinformatics online.
1 Introduction
During the process of precursor mRNA (pre-mRNA) splicing, non-coding portions (introns) are removed and coding sections (exons) are joined together to form a mature message. The spliceosome, a macromolecular ribonucleoprotein complex catalyzes the splicing reaction. During the step-wise assembly on the pre-mRNA, the spliceosome has to rely on information encoded in the intron/exon boundaries (3′ splice site and 5′ splice site) as well as around them (branch-point sequence, polypyrimidine tract, intronic splicing enhancers and silencers, and exonic splicing enhancers and silencers). It is estimated that about a third of disease causing mutations also affect splicing by disruption of the signals needed for the correct assembly of the spliceosome (Lim et al., 2011).
In a previous study Lim et al. (2011), we found that splicing elements have unique positional distributions around splice sites. The L1 distance metric was used to measure the difference between positional distributions of individual splicing elements (see Supplementary Section S1 for L1 distance calculation description). The L1 distance proved to be a reliable way of detecting aberrant splicing caused by single nucleotide variations. Point mutations that caused higher L1 distances were more likely to affect splicing in vitro than those with smaller distances (Lim et al., 2011) (Supplementary Section S2 and Supplementary Fig. S1). A year later, the Spliceman tool was released with the goal to use the L1 distance metric as a predictor of single point mutations’ effects on splicing (Lim and Fairbrother, 2012).
We decided to revisit Spliceman’s pipeline and add functionality that together with L1 distance would make better predictions and provide a more user-friendly interface.
2 Materials and methods
2.1 Input improvement
The original Spliceman program accepted inputs only in the FASTA format (Lim and Fairbrother, 2012). This placed limitations on the number of mutations that could be processed at once as well as limited integration of the tool with already established variant processing pipelines. Data are inputted to Spliceman2 using industry-standard variant call format (VCF). Users can either enter data into a text box for a small number of mutations or upload a VCF file for larger inputs, which allows Spliceman2 to handle much larger datasets than its predecessor (Fig. 1A).
Fig. 1.
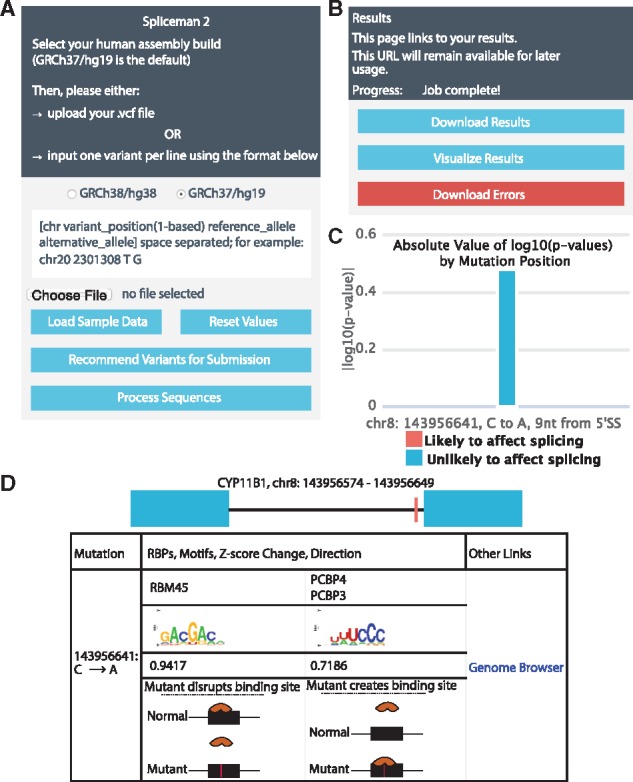
(A) Input panel for Spliceman2. (B) Results page for Spliceman2. (C) Plot of L1 distance results. (D) Fragment of visualization page generated by the Spliceman2 pipeline
2.2 Algorithm methodology
Spliceman2 processes its input through a multi-step pipeline.
2.2.1 Step (1) input validation
The algorithm first checks that its inputs are valid coordinates in either the hg19 or the hg38 reference genome by verifying that each reported ref base in the input matches the entry at the same location in the reference.
2.2.2 Step (2) intersection of input with mutation database
Each mutation in the input file is intersected with the list of pre-computed valid mutation coordinates (Supplementary Section S3).
2.2.3 Step (3) RNA-binding protein (RBP) score calculation
To determine if a 13-mer region is significantly enriched with matches to a RBP motif (Ray et al., 2013), we first summed the position weight matrix (PWM) scores of each 7-mer in the region for all possible regions of size 13. We then transformed these values to z-scores. We deemed that a particular sequence has an enrichment of matches if the z-score for that sequence was >1.96. These steps were repeated for each RBP with PWM width of size 7 (n = 122). Spliceman2 returns only top 5 RBPs that differ in enrichment between wild type and mutant sequences (either mutant or wild type are enriched for matches, but not both) together with the z-score difference between the two species.
2.2.4 Step (4) exonic splicing regulatory sequences score calculation
To determine whether a particular mutation in a particular exon disrupts any exonic cis-elements, Spliceman2 incorporates the findings of Ke et al. (2011) regarding the effects of hexamers on splicing. In brief, we summed the reported exonic splicing regulatory (ESR) scores of each hexamer overlapping the mutation position in the wild type and mutant sequences separately. We then took the difference between these two values and deemed that a particular mutation created a silencing element or disrupted an enhancing element if the final score was negative and created an enhancing element or disrupted a silencing element if the final score was positive. This value is reported only for exonic mutations.
2.2.5 Step (5) storage and retrieval of the processed variations
Each analyzed mutation (chromosome, coordinate, and nucleotide change) is added to a local database to make future searches for the same mutation significantly faster (Supplementary Section S4 and Supplementary Fig. S2). No other information about the submission is captured.
3 Outputs
Spliceman2 expands on Spliceman’s output by adding a visualization component and returning more relevant data. After processing, users have several options to view their results (Fig. 1B). Results can be downloaded as a text file with columns of data for L1-distance, ESR, genome, and RBPs as well as information about the mutation and its location. Spliceman2 features data visualization, plots the L1-distance results (Fig. 1C), presents the data contained in the text file in a table, and creates diagrams displaying the locations of mutations on exons (Fig. 1D). Users can also download all mutations that could not be processed as an error text file with descriptions of each individual failure event.
Funding
This work has been supported by the National Institutes of Health [R01GM095612 to W.G.F., R01GM105681 to W.G.F., R21HG007905 to W.G.F.]; and by the Simons Foundation Autism Research Initiative [342705 to W.G.F.].
Conflict of Interest: None declared.
Supplementary Material
References
- Ke S. et al. (2011) Quantitative evaluation of all hexamers as exonic splicing elements. Genome Res., 21, 1360–1374. [DOI] [PMC free article] [PubMed] [Google Scholar]
- Lim K.H. et al. (2011) Using positional distribution to identify splicing elements and predict pre-mrna processing defects in human genes. Proc. Natl. Acad. Sci. USA, 108, 11093–11098. [DOI] [PMC free article] [PubMed] [Google Scholar]
- Lim K.H., Fairbrother W.G. (2012) Spliceman–plicemaner.1101135108oi.o that predicts sequence variations in pre-mrna splicing. Bioinformatics, 28, 1031–1032. [DOI] [PMC free article] [PubMed] [Google Scholar]
- Ray D. et al. (2013) A compendium of rna-binding motifs for decoding gene regulation. Nature, 499, 172–177. [DOI] [PMC free article] [PubMed] [Google Scholar]
Associated Data
This section collects any data citations, data availability statements, or supplementary materials included in this article.