Abstract
Somatic gene mutations can alter the vulnerability of cancer cells to T cell-based immunotherapies. To mimic loss-of-function mutations involved in resistance to these therapies, we perturbed genes in tumour cells using a genome-scale CRISPR-Cas9 library comprising ~123,000 single guide RNAs, and profiled genes whose loss in tumour cells impaired the effector function of CD8+ T cells (EFT). We correlated these genes with cytolytic activity in ~11,000 patient tumours from The Cancer Genome Atlas. Among the genes validated using different cancer cell lines and antigens, we identified multiple loss-of-function mutations in APLNR, encoding Apelin receptor, in patient tumours refractory to immunotherapy. We show that APLNR interacts with JAK1, modulating interferon-gamma responses in tumours, and its functional loss reduces the efficacy of adoptive cell transfer and checkpoint blockade immunotherapies in murine models. Collectively, our study links the loss of essential genes for EFT with the resistance or non-responsiveness of cancer to immunotherapies.
Genetic aberrations are generated in most cancers as a product of their neoplastic evolution1. Somatic mutations can give rise to neoantigens that are capable of eliciting potent T cell responses driven by current immunotherapies2–7. However, mutations can also induce resistance to immunotherapies. For example, loss-of-function mutations in beta-2-microglobulin (B2M) and Janus kinases (JAK1 and JAK2) have been reported in patients unresponsive to immunotherapies8,9. Nevertheless, the identity of functionally essential genes in cancer cells that facilitate immune selection by immunotherapies remains unknown. To systematically catalogue genes in tumours whose loss can enable immune escape from T cell-mediated cytolysis, we used a genome-scale CRISPR-Cas9 mutagenesis screen in human melanoma cells.
CRISPR-Cas9 screens have been used to identify genes critical for proliferation10,11, drug resistance12,13, and metastasis14 of cancer cells. To identify the genes essential in tumours for the ‘effector function of T cells’ (EFT), we developed a ‘two cell-type’ (2CT) CRISPR assay consisting of human T cells as effectors and melanoma cells as targets. We sought to understand how genetic manipulations in one cell type can affect a complex interaction with another cell type. In addition, the 2CT assay enabled us to perform pooled screens with higher library representation than can be achieved in vivo.
Here, we report several previously undescribed genes and microRNAs that play a role in facilitating tumour destruction by T cells. We examined the correlation of expression of these candidate genes with measures of cytolytic activity in ~11,000 human tumours from The Cancer Genome Atlas (TCGA), and also reported how the loss of a novel candidate gene can mediate resistance to T cell-based immunotherapies in human and murine tumours.
A 2CT-CRISPR assay system
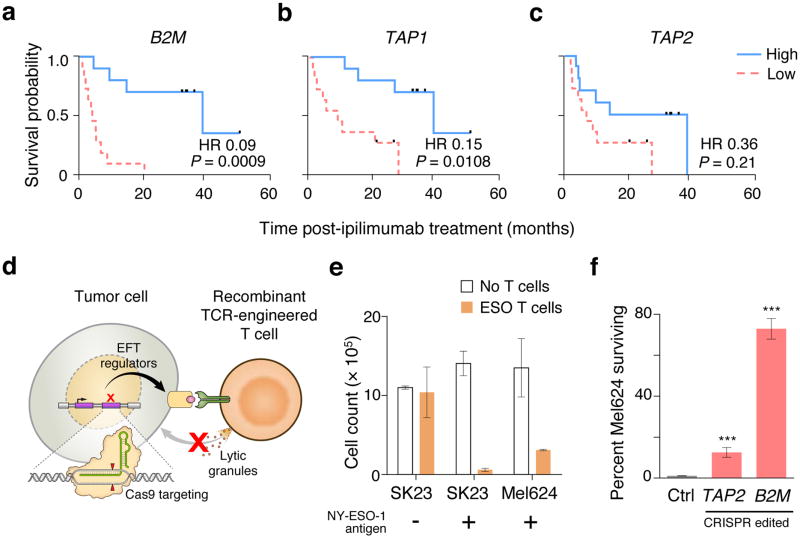
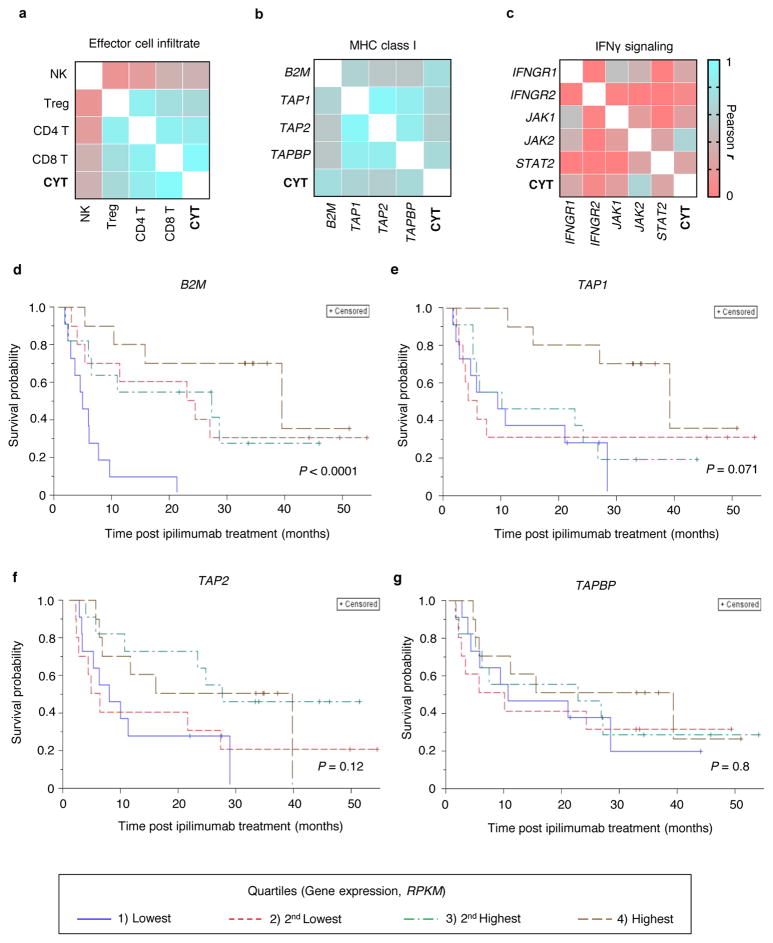
To identify cell-types and genes related to the anti-tumour function of immune cells that might be necessary for immunotherapy, we performed correlation analysis on gene expression data from melanoma patients treated with the anti-CTLA4 antibody, ipilimumab3. Consistent with previous reports15,16, we found that intratumoral cytolytic activity (CYT, computed as the geometric mean of perforin PRF1 and granzyme GZMA expression) was strongly correlated with CD8+ T cell infiltration in the tumours (Extended Fig. 1a; r = 0.96, P < 1 × 10⁻¹⁵) and with the expression of genes involved in the MHC class I antigen processing/presentation pathway (Extended Fig. 1b; r > 0.54, P < 0.001 for each gene), but weakly correlated with interferon-gamma (IFNγ) signalling genes (Extended Fig. 1c). We observed that the reduction in the overall survival of these patients was significantly associated with loss of expression of B2M and TAP1 in tumours biopsied prior to ipilimumab treatment (Fig. 1a–c, Extended Fig. 1d–g). Given these associations, we chose to use CD8+ T cells and MHC class I genes to develop the 2CT-CRISPR assay system.
Figure 1. 2CT-CRISPR assay system confirms functional essentiality of antigen presentation genes for immunotherapy.
a–c, Kaplan-Meier survival plots of patient overall survival with the expression of antigen presentation genes B2M (a), TAP1 (b) and TAP2 (c) after ipilimumab immunotherapy. Patients were categorized into ‘High’ and ‘Low’ groups according to the highest and the lowest quartiles of each individual gene expression (RPKM). Reported P-values have been penalized by multiplying the unadjusted P-value by 3 to account for the comparison of the two extreme quartiles. Hazard ratio (HR) was calculated using Mantel-Haenszel test; with HR ranges: B2M (0.02–0.31), TAP1 (0.04–0.52) and TAP2 (0.12–1.07). Data is derived from 42 melanoma patients from the Van-Allen et al. cohort3. d, Schematic of the 2CT-CRISPR assay to identify essential genes for EFT. e, NY-ESO-1 antigen specific lysis of melanoma cells after 24 h of co-culture of ESO T cells with NY-ESO-1− SK23, NY-ESO-1+ SK23 and NY-ESO-1+ Mel624 cells (n = 3 biological replicates) at E:T ratio of 1. f, Survival of Mel624 cells modified through lentiviral CRISPR targeting of MHC class I antigen presentation/processing genes after introduction of ESO T cells. CRISPR-modified Mel624 cells were co-cultured with ESO T cells at E:T ratio of 0.5 for 12 h. Live cell survival (%) was calculated from control cells unexposed to T cell selection. Data is from 3 independent infection replicates. All values are mean ± s.e.m. ***P < 0.001 as determined by Student’s t-test.
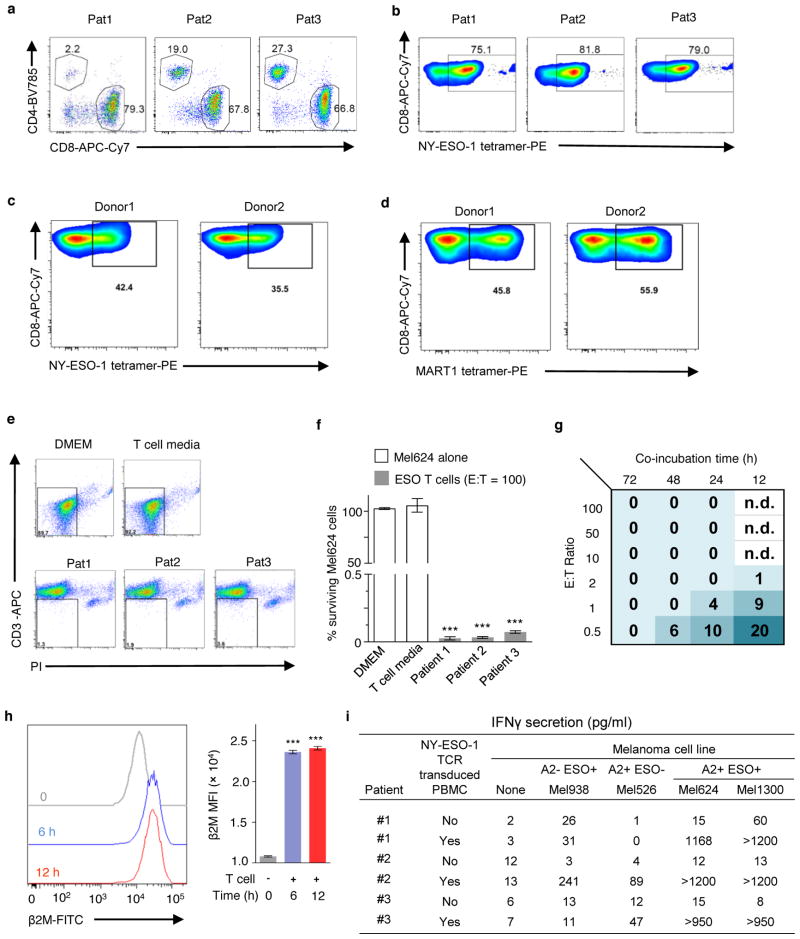
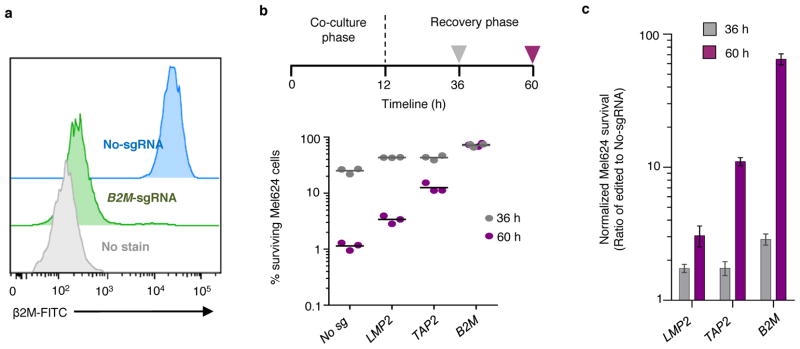
The 2CT-CRISPR assay employs a gene-engineered CD8+ T cell to specifically target an antigen expressed in an HLA class I-restricted fashion (Extended Fig. 2a–d). We utilized primary human T cells transduced with a recombinant TCR specific for NY-ESO-1 antigen (NY-ESO-1:157–165 epitope) presented in an HLA-A*02–restricted fashion (ESO T cells) that we previously reported to mediate tumour regression in patients with melanomas and synovial cell sarcomas (Fig. 1d–e, Extended Fig. 2a–c)17–19. We optimized the 2CT assay to control the selection pressure, alloreactivity and bystander killing20 exerted by T cells by modulating the effector to target (E:T) ratio and length of co-incubation (Extended Fig. 2e–i). To test whether the loss of antigen presentation genes can directly compromise T cell-mediated cell lysis of human cancer cells using our 2CT CRISPR assay, we targeted TAP2 and B2M with three unique single guide RNAs (sgRNAs) cloned into the lentiCRISPRv2 lentiviral vector in NY-ESO-1+ Mel624 melanoma cells. FACS analysis confirmed that B2M-targeting lentiviral CRISPRs achieved ~95% protein knock-out (Extended Fig. 3a). Significant resistance was detected in cells transduced with B2M sgRNAs (72 ± 5%) and with TAP2 sgRNAs (13 ± 2%) upon co-culture of the gene-modified NY-ESO-1+ Mel624 cells with ESO T cells (Fig. 1f, Extended Fig. 3b–c). These results show that loss of key MHC class I genes promotes evasion of T cell-mediated tumour killing in the optimized 2CT-CRISPR assay.
Genome-wide 2CT-CRISPR screen for EFT
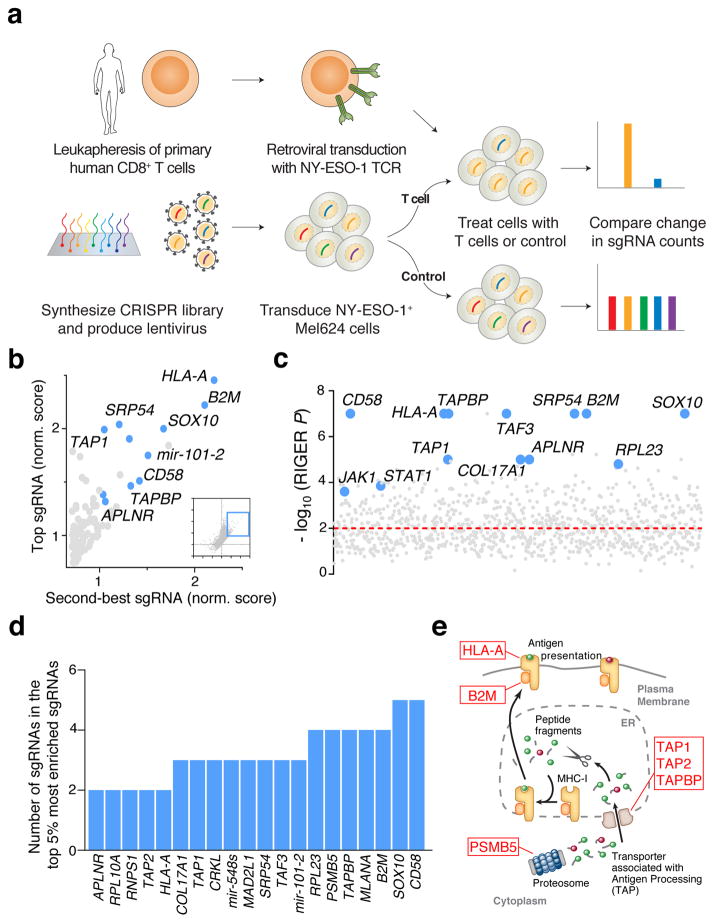
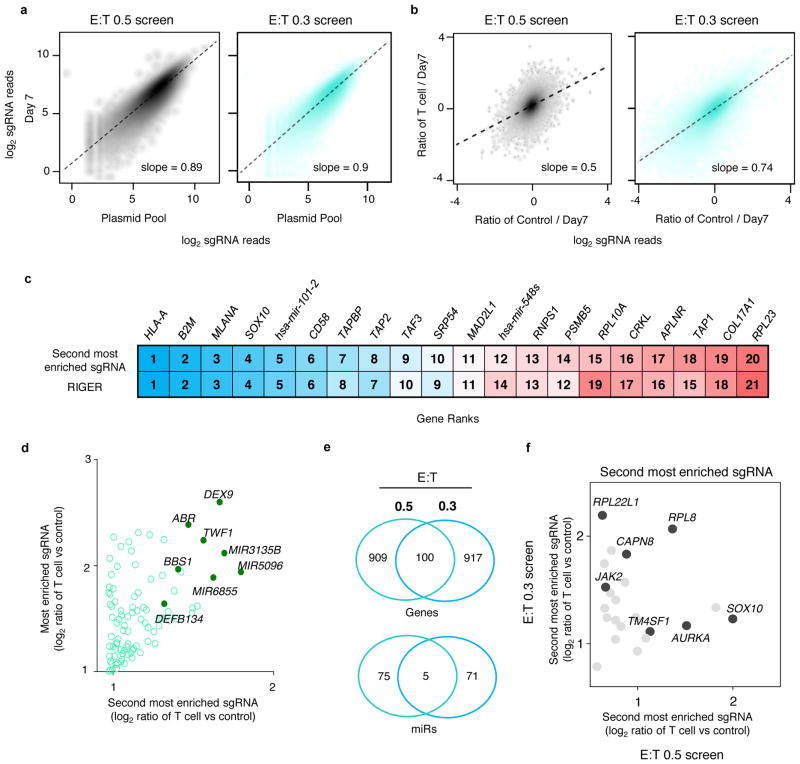
To identify the tumour intrinsic genes essential for EFT on a genome-scale, we transduced Mel624 cells with the Genome-Scale CRISPR Knock-Out (GeCKOv2) library at an MOI < 0.3 (Fig. 2a). The GeCKOv2 library is comprised of 123,411 sgRNAs that target 19,050 protein-coding genes (6 sgRNAs per gene) and 1,864 microRNAs (4 sgRNAs per microRNA), and also includes ~1,000 ‘non-targeting’ control sgRNAs21. We exposed transduced tumour cells to ESO T cells at effector to target (E:T) ratios of 0.3 and 0.5 for 12 h in independent screens that resulted in ~76% and ~90% tumour cell lysis, respectively. Using deep sequencing, we examined the sgRNA library representation in tumour cells before and after T cell co-incubation (Extended Fig. 4a–b). We observed that the distribution of the sgRNA reads in T cell-treated samples versus controls was significantly altered in screens with the higher number of T cells, E:T of 0.5 (Kolmogorov–Smirnov test, P = 7.5 × 10⁻⁵), and not with an E:T of 0.3 (Extended Fig. 4b, P = 0.07), indicating that the efficiency of this 2CT-CRISPR assay was dependent on the selection pressure applied by T cells.
Figure 2. Genome-wide CRISPR mutagenesis reveals essential genes for the effector function of T cells in a target cell.
a, Design of the genome-wide 2CT-CRISPR assay to identify loss-of-function genes conferring resistance to T cell-mediated cytolysis. b, Scatterplot of the normalized enrichment of the most-enriched sgRNA versus the second-most-enriched sgRNAs for all genes after T cell-based selection (inset). The top 100 genes by second-most-enriched sgRNA rank are displayed in the enlarged region. c, Identification of top enriched genes using the RIGER analysis. d, Consistency of multiple sgRNA enrichment for the top 20 ranked genes by second-most enriched sgRNA score. The number of sgRNAs targeting each gene that are found in the top 5% of most enriched sgRNAs overall is plotted. e, Schematic of MHC class I antigen processing pathway with candidate genes scoring in the top 0.1% of all genes in the library highlighted.
We quantified consistent enrichment of candidate genes by multiple methods: 1) ranking genes by their second most enriched sgRNA (Fig. 2b); 2) the RNAi Gene Enrichment Ranking (RIGER) metric22 (Fig. 2c); and 3) the number of sgRNAs for each gene enriched in the top 5% of all sgRNAs in the library (Fig. 2d). All three methods showed a high degree of overlap (Fig. 2b–d, Extended Fig. 4c, Supplementary Table 1). Despite the disparity in the enriched sgRNA distributions between screens with E:T of 0.3 and 0.5, several highly-ranked genes and microRNAs are shared between the screens (Extended Fig. 4d–f). Based on our initial optimization of the 2CT-CRISPR assay, we expected that genes directly associated with MHC class I antigen processing and presentation would be enriched in our screens, and found that HLA-A, B2M, TAP1, TAP2 and TAPBP were among the most highly-enriched genes in our screen (Fig 2d–e). In addition, many genes without an established connection to the EFT were ranked amongst the top 20 enriched genes in this genome scale analysis, such as SOX10, CD58, MLANA, PSMB5, RPL23 and APLNR (Fig. 2c–d).
Biological role of putative essential genes for the EFT
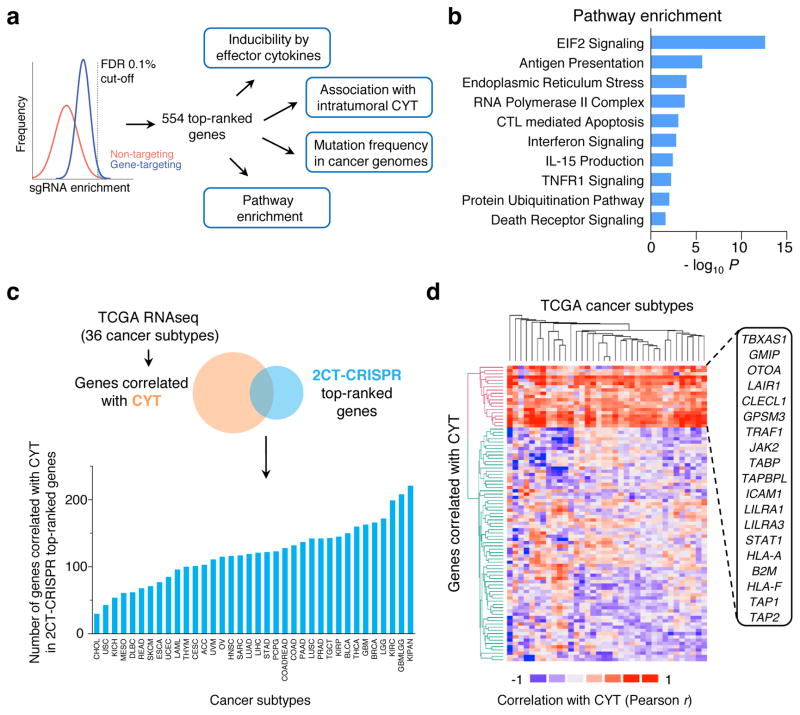
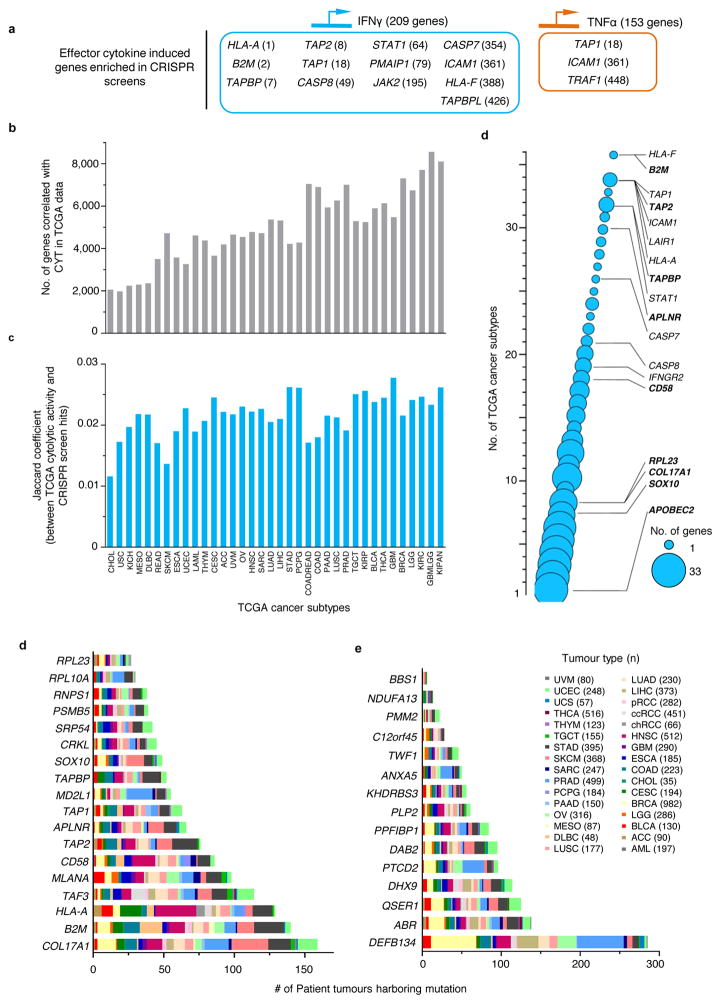
We sought to assess the clinical and biological significance of the most enriched 2CT-CRISPR candidates (554 genes at false discovery rate (FDR) < 0.1%) by comparing the candidates with publicly available cancer genome sequencing and querying association with known cancer/immune pathways (Fig. 3a). As a part of their effector mechanism, T cells induce transcriptional changes in the tumour microenvironment via secretion of cytokines such as IFNγ and tumour necrosis factor alpha (TNFα) to enhance recognition and lysis of cancer cells15,23–25. To assess whether any of these genes induced by effector cytokines are likely to have a functional role in modulation of the EFT, we intersected the gene expression profiles of cytokine-induced genes23–25 with the candidate genes. We found that 13 IFNγ-induced genes and 3 TNFα-induced genes were captured in our 554 top candidates (Extended Fig. 5a) bolstering the functional relevance of these cytokine-induced genes in tumour cells for EFT.
Figure 3. Categorization of candidate essential genes for EFT using available knowledge database.
a, Candidate genes based on FDR cut-off of 0.1% (n = 554 genes) were functionally categorized by multiple methods to understand the biological significance for EFT. b, Most significant pathways by Ingenuity Pathway Analysis (P < 0.05) from top 2CT-CRISPR candidates. c–d, Association of top 554 candidate genes with intratumoral cytolytic activity (CYT, expression of perforin and granzyme) using TCGA datasets. c, RNA-sequencing data for 36 human cancers were obtained from the TCGA database and genes positively correlated with CYT (P < 0.05, Pearson correlation) were intersected with 2CT-CRISPR candidates to quantify number of overlapping genes in each cancer subtype. d, Heatmap showing the partitioning of the clusters of genes based on Pearson correlation coefficient values of CRISPR screen hits with CYT using pan-cancer TCGA data. Individual cancer and pathway heatmaps are available at https://bioinformatics.cancer.gov/publications/restifo.
Using Gene Ontology (GO) and pathway analyses, we found that in addition to antigen presentation and IFNγ signalling, 2CT-enriched genes function in EIF2 signalling, endoplasmic reticulum stress, apoptosis, assembly of RNA polymerase II, TNF receptor signalling and protein ubiquitination pathways (F-test, Bonferroni corrected P < 0.05; Fig. 3b, Supplementary Tables 2–3). These data reveal previously unrecognized signalling circuitry in tumours whose loss can dampen EFT, warranting further investigation.
To assess whether loss of candidate genes identified in the 2CT-CRISPR screen was associated with decreased cytolytic activity in patient tumours, we obtained gene expression profiles of 11,409 human tumours spanning 36 tumour-types from the TCGA database and measured the correlation between candidate genes and CYT in these datasets (Fig. 3c–d, Extended Fig. 5b–c). With this approach, we generated a list of genes that associate with CYT for each TCGA cancer type and are also enriched in our 2CT screens (Supplementary Table 4, web-resource https://bioinformatics.cancer.gov/publications/restifo). Using hierarchical clustering, we identified a set of 19 genes that are correlated with CYT across most of the 36 cancer types (Fig. 3d, Extended Fig. 5d, Supplementary Table 5–6). Ten of these 19 genes were inducible by IFNγ, indicating that these genes may be upregulated in cancers due to an increased infiltration of T cells. Loss of expression of these 19 genes within tumours could diminish or extinguish the presentation of tumour antigens (including HLA-A, HLA-F, B2M, TAP1, TAP2); T cell co-stimulation (ICAM1, CLECL1, LILRA1, LILRA3); or cytokine production and signalling (JAK2, STAT1) in the tumour microenvironment that drive infiltration and activation of T cells, and thus serve as principal mechanism in immune evasion.
We interrogated mutation frequency of the top enriched genes in different tumour types in the TCGA datasets (Extended Fig. 5d–e, Supplementary Fig. 1). We found COL17A1, B2M, HLA-A, TAF3, DEFB134, ABR, QSER1 and DHX9 each to be mutated in >100 patient tumours across different malignancies, demonstrating that mutations in these candidates naturally occur in human cancers.
Validation and generalizability of top candidates
We elected to independently validate 17 genes based on two criteria: the gene should be ranked among the top 20 candidates in either screen, and the gene should not be previously described in anti-tumour function of T cells. We included CTAG1B (encoding tumour antigen, NY-ESO-1) and TAPBP (encoding Tapasin involved in class I antigen processing) as positive controls.
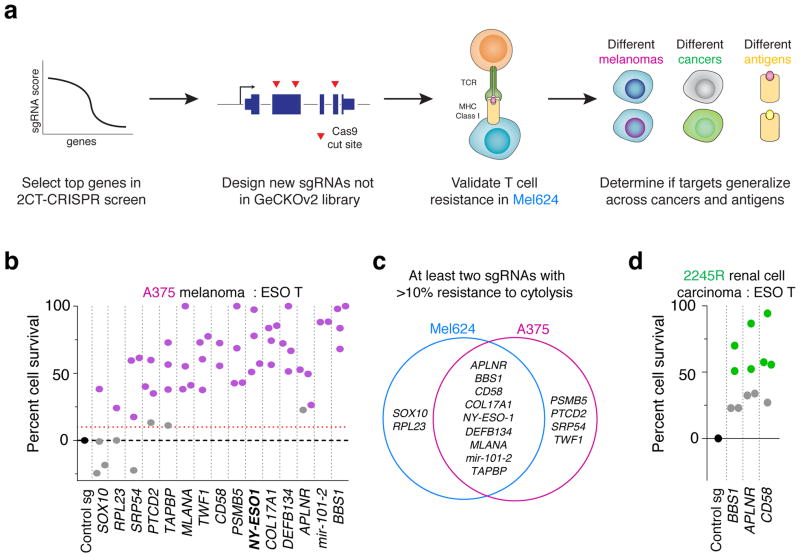
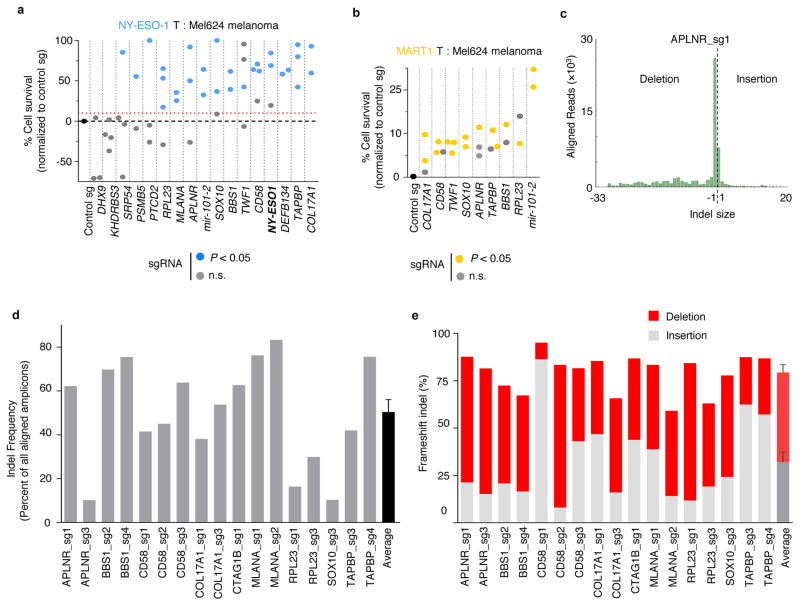
We targeted each gene in NY-ESO-1+ melanoma cells, Mel624 and A375, with four sgRNAs (Supplementary Table 7) and individually measured resistance against ESO-T cells (Fig. 4a). Fifteen genes showed significant resistance to T cell-mediated cytolysis with at least 1 sgRNA in these cells (Fig. 4b, Extended Fig. 6a, Student’s t-test, P < 0.05 compared to control sgRNA, n = 3 biological replicates). To mitigate concerns of off-target activity, we considered a candidate to be a critical gene for the EFT if loss-of-function resulted in a resistance phenotype with at least 2 distinct sgRNAs. Using these criteria, we validated 9 candidates in both Mel624 and A375 cells (Fig. 4c). The transcription factor SOX10, whose expression is elevated ~16-fold in melanoma over other cancers (Supplementary Fig. 2) and targets other top 2CT screen hits (e.g. MITF), was validated only in Mel624 cells (Fig. 4d), which may be due to its higher expression (~1.8-fold higher) in these cells compared to A375 cells26.
Figure 4. Validation of top candidate genes across cancers.
a, Schematic of the array validation strategy for top candidates from the pooled 2CT-CRISPR screen to test generalization across melanomas, MHC class I antigens and other (non-melanoma) cancer. b, Survival of HLA-A*02+ NY-ESO-1+ A375 cells edited with individual sgRNAs (2–4 per gene) after co-culture with ESO T cells at E:T ratio of 0.5. n = 3 biological replicates per sgRNA. c, Shared and unique genes essential for EFT in Mel624 and A375 melanoma cells. d, Survival of HLA-A*02+ NY-ESO-1+ renal cell carcinoma 2245R cells edited with individual sgRNAs (4 per gene) after co-culture with ESO T cells at E:T ratio of 0.5 in 2CT assay. n = 4 biological replicates per sgRNA. b–d, P-value calculated for positively enriched gene-targeting sgRNAs compared to control sgRNA by Student’s t-test. Data representative of at least two independent experiments.
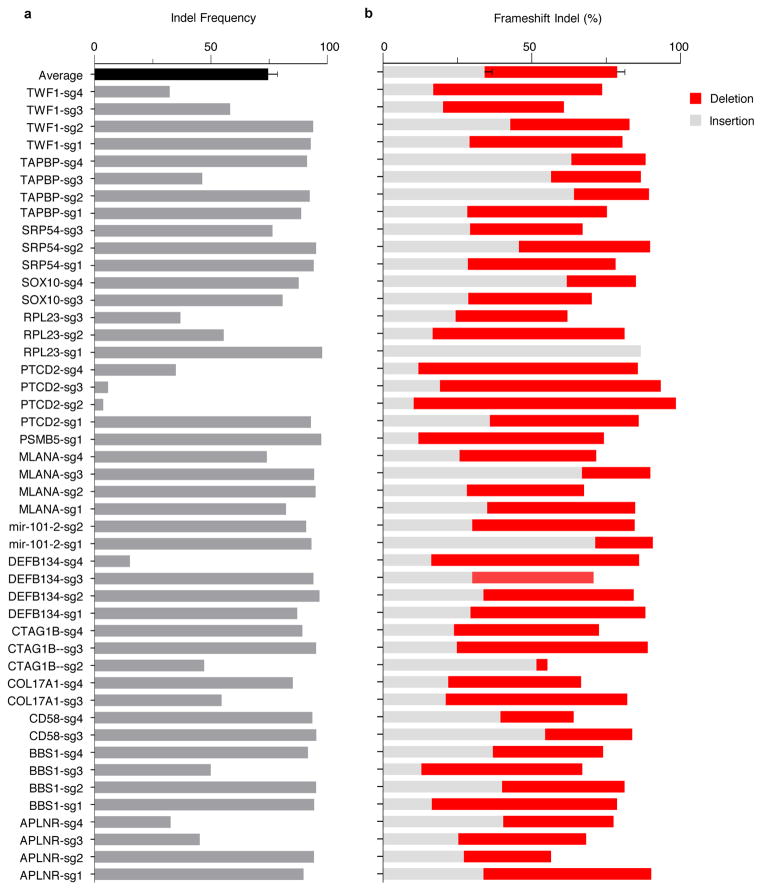
To test if these validated genes generalize to an unrelated T cell receptor antigen MART-1, we introduced sgRNAs targeting several of these genes into MART-1/MLANA+ Mel624 cells and then co-cultured them with MART-1 TCR-transduced primary human T cells (MART1-T cells; Extended Fig. 2d, 6b)18. MART-1 T cells are highly potent against tumour cells due to their high avidity TCRs and bystander destruction of cancer cells18,20. Tumour cells transduced with control non-targeting sgRNAs were completely eradicated upon co-culture with MART1-T cells, whereas ESO T cells only induced cytolysis of ~60% of tumour cells with the same incubation (Supplementary Fig. 3). MART-1+ Mel624 cells with sgRNAs targeting each of the 9 candidate genes showed increased resistance against these T cells (Extended Fig. 6b, P < 0.05). We confirmed on-target gene disruption efficiency of sgRNAs by performing deep sequencing analysis at the target Cas9 cut-sites in these melanoma cells (Extended Fig. 6c–e,7). The genes that we validated across different melanoma cell lines and different antigen-TCR combinations include cellular cytoskeleton genes, COL17A1 (collagen type XVII alpha 1) and TWF1 (twinfilin-1), microRNA gene (hsa-mir-101-2) and 60S ribosomal protein (RPL23, Supplementary discussion). These findings underscore the role of these biological processes in tumour cells in modulation of EFT.
Next, we tested if immune resistance due to the loss of the cellular signalling-related genes APLNR, encoding a G-protein coupled Apelin receptor, and BBS1, encoding Bardet-Biedl syndrome 1 protein, and the adhesion related gene CD58 can be generalized to other cancer-types. To this end, we overexpressed NY-ESO-1 (CTAG1B) in a patient derived HLA-A*02+ renal cell carcinoma (2245R) cells using retroviral vector and targeted each gene with four sgRNAs. For each gene, APLNR, BBS1 and CD58, we found that at least two sgRNAs exhibited >50% resistance to ESO T cell-mediated lysis (Fig. 4d, P < 0.05). Thus, we validated key genes found in our CRISPR screen using multiple cell lines, target antigens and tumour cell types. To test the heuristic power of a gene previously unknown to play a role in EFT, we focused on APLNR, which was validated across different cell lines and antigens.
In vivo relevance of APLNR
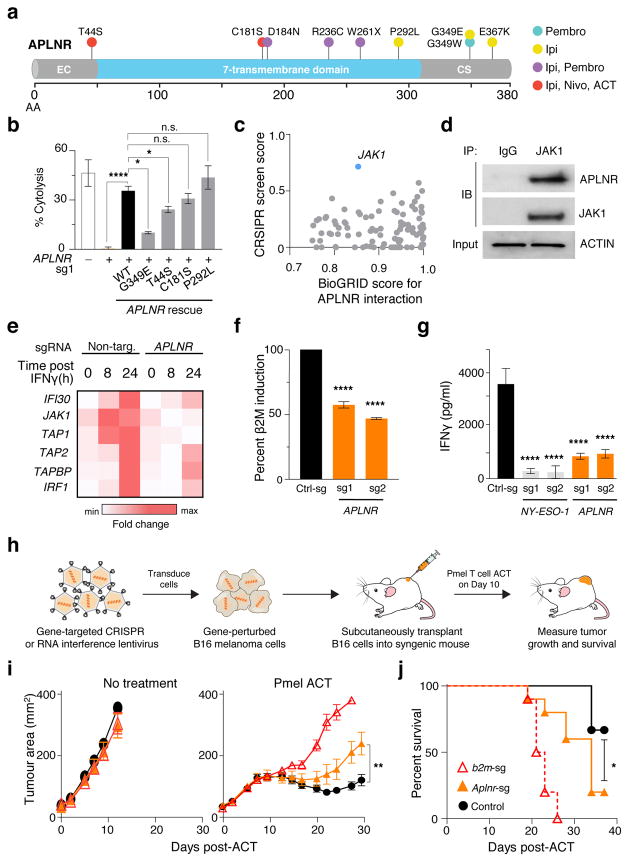
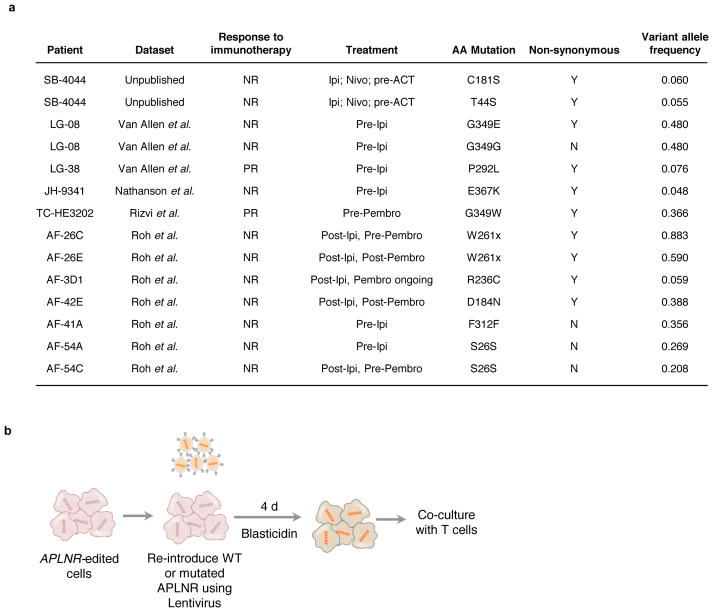
APLNR is one of the G-protein coupled receptors (GPCR) that is mutated in several cancers27. To determine whether loss-of-function mutations in APLNR are present in patient tumours treated with T cell-based immunotherapies, we mined available whole exome sequencing datasets3,5,28,29 from metastatic melanoma and lung cancer patients treated with checkpoint blockade therapies including anti-CTLA4 (ipilimumab) and anti-PD1 (pembrolizumab or nivolumab) antibodies. From these datasets, we identified 7 non-synonymous mutations in APLNR, one of which is a nonsense mutation (W261X) resulting in deletion of the seventh transmembrane helix and cytoplasmic C-terminal tail of the receptor (Fig. 5a, Extended Fig. 8a). The C-terminus of APLNR contains residues critical for membrane association, receptor internalization, receptor dimerization, and interaction with cytosolic proteins30, and thus its loss is likely to be deleterious to protein function. We also conducted whole exome sequencing analysis on a metastatic lung lesion resected from a patient SB-4044 with melanoma resistant to both anti-CTLA4 (ipilimumab) and anti-PD1 (nivolumab) immunotherapies. We found two non-synonymous mutations, T44S and C181S, in APLNR (Fig. 5a, Extended Fig. 8a) within this melanoma lesion.
Figure 5. Functional loss of APLNR reduces efficacy of cancer immunotherapy.
a, Non-synonymous mutations detected in APLNR in human melanoma tumours refractory to indicated immunotherapies. Ipi, ipilimumab; Nivo, nivolumab; Pembro, pembrolizumab; EC, extracellular domain; CS, cytoplasmic signalling domain. b, Mutations encoding G349E and T44S in APLNR resist the restoration of T-cell mediated cytolysis in APLNR-perturbed tumour cells. n = 3 biological replicates. c, Second most enriched sgRNA score in CRISPR screens for 96 APLNR-interacting proteins from the BioGrid database31. d, Western blot probed for APLNR after immunoprecipitation pull-down of JAK1 from A375 cell lysates. Results were similar in an independent replicate experiment (not shown). e, Quantitative PCR analysis of JAK1-STAT1 pathway induced genes in wild-type and APLNR-edited cells at 0, 8 and 24 h post treatment with 1 μg/ml IFNγ. n = 3 biological replicates. f, Induction of surface expression of β2M on APLNR-edited cells upon co-culture with ESO T cells as measured by FACS. n = 3 biological replicates. g, IFNγ secretion from ESO T cells after overnight co-culture with CRISPR edited A375 cells determined using ELISA. n = 3 biological replicates. h, Schematic of in vivo experiments to test the response of B2m and Aplnr knock-out tumours to ACT in immunocompetent mice. i, j, Subcutaneous tumour growth in mice receiving ACT of Pmel-1 T cells. Tumour area (i) and overall survival (j) are shown. Significance for tumour growth kinetics were calculated by Wilcoxon rank sum test. Survival significance was assessed by a log-rank Mantel-Cox test. n = 5 mice per ‘No treatment’ groups. For ‘Pmel ACT’ groups, n = 9 mice in control group, n = 10 mice per B2m-sg and Aplnr-sg groups. All values are mean ± s.e.m. ****P < 0.0001, **P < 0.01, *P < 0.05. Data are representative of two independent experiments.
We selected 4 non-synonymous mutations (T44S, C181S, P292L, G349E) from the Van Allen et al. cohort and SB-4044 to determine if these mutations can limit EFT. In APLNR-KO A375 cells, we re-introduced mutated or wild-type (WT) APLNR using lentivirus (Extended Fig. 8b). While re-introduction of WT, C181S or P292L mutations rescued the sensitivity of APLNR-KO cells to T-cell mediated cytolysis, T44S and G349E mutations only resulted in partial rescue indicating that these mutations in APLNR reduce EFT (Fig. 5b). The presence of these loss-of-function mutations in non-responding tumour lesions suggests that the functional loss of APLNR in tumours could be associated with immunosuppression in vivo.
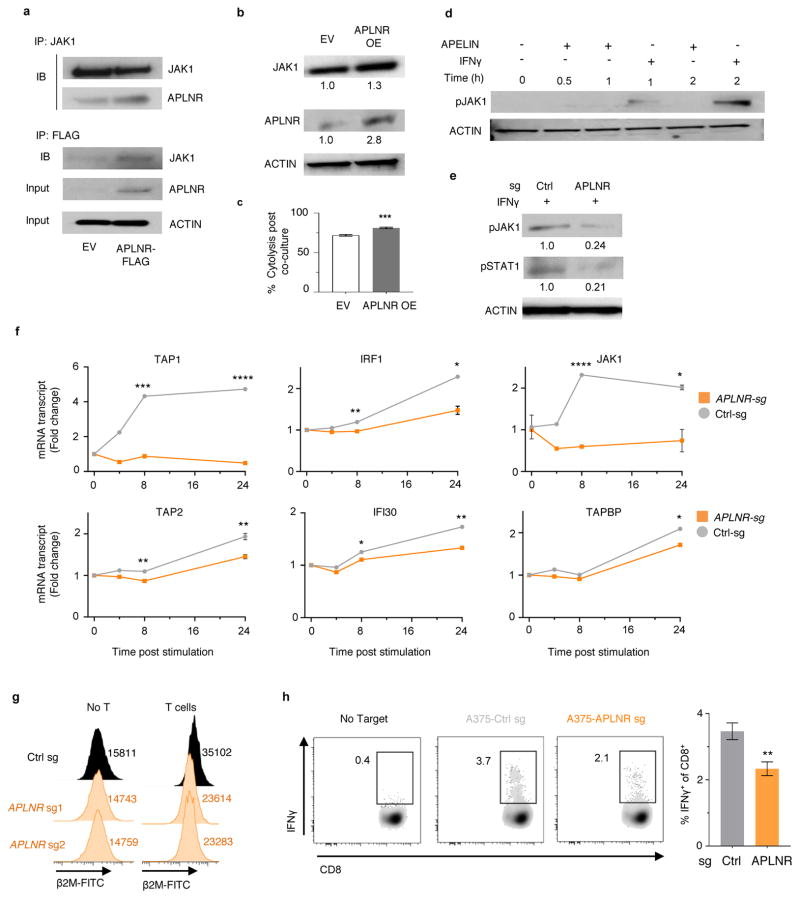
To investigate potential mechanisms by which APLNR regulates EFT, we analysed transcriptome of APLNR-KO cells using RNA-seq. We did not find any substantial differences in mRNA transcript levels of genes involved in antigen presentation, T cell inhibition or co-stimulation (Supplementary Fig. 4). We thus examined whether APLNR regulates EFT by modulating protein signalling. APLNR has been reported to interact with 96 different intracellular proteins (BioGRID interaction database31), and in genome-scale CRISPR screens, targeting multiple genes in the same pathway can result in similar phenotypes. Of these 96 previously reported binding partners of APLNR, JAK1 was the most enriched in our screen (enriched in the top 0.5% of all genes, Fig. 5c). Using immunoprecipitation pull-down, we confirmed that APLNR binds to JAK1 in A375 and HEK293T cells (Fig. 5d, Extended Fig. 9a). Retroviral overexpression of APLNR coincided with an increase in JAK1 protein levels (Extended Fig. 9b). In addition, this overexpression of APLNR significantly increased the sensitivity of tumour cells to EFT (Extended Fig. 9c, increase in cytolysis from 71.7 ± 1% to 81.1 ± 0.9%).
IFNγ-driven phosphorylation of JAK1 stimulates the JAK-STAT signalling cascade to augment antigen processing and presentation in tumours, which in turn enhances recognition and cytolysis by T cells32. First, we determined whether Apelin treatment of tumour cells can directly induce phosphorylation of JAK1. We did not observe any changes in JAK1 phosphorylation with Apelin treatments (Extended Fig. 9d). We also tested whether activation of APLNR using peptide ligands (Pyr-Apelin 13, Apelin 17 and Apelin 36) or a chemical agonist (ML233) on tumour cells alters EFT. We did not observe any significant effect of these treatments suggesting that APLNR may regulate EFT independent of its canonical GPCR signalling. Next, we tested whether loss of APLNR alters the responsiveness of tumour cells to IFNγ treatment. We found that APLNR-KO cells exhibited reduced induction of JAK-STAT signalling upon IFNγ treatment as measured by the phosphorylation status of JAK1 and STAT1 (Extended Fig. 9d–e), and induction of specific IFNγ-gamma response gene transcripts (Fig. 5e, Extended Fig. 9f). Upon co-culture with ESO T cells for 6 h, APLNR-KO cells induced less β2M expression on the cell surface compared to unedited cells (Fig. 5f, Extended Fig. 9g). In agreement with the reduced sensitivity of APLNR-KO cells to IFNγ-mediated upregulation of antigen processing and presentation genes, we noted a significant decrease in the recognition of APLNR-KO tumour cells by ESO T cells (Fig. 5g, Extended Fig. 9h, Supplementary Fig. 5). Taken together, these data suggest that APLNR augments EFT by modulating IFNγ signalling in tumour cells.
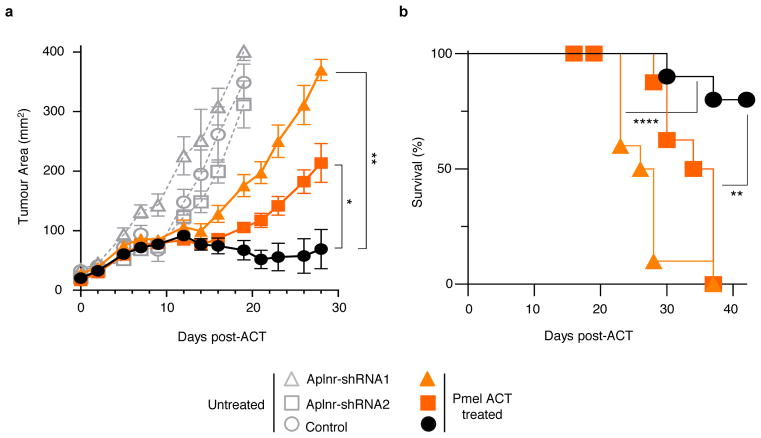
Finally, to test the relevance of APLNR for immunotherapy in an in vivo setting, we targeted Aplnr in murine B16 melanoma tumours with multiple sgRNAs (Fig. 5h). We also included B2m-targeting sgRNAs as a positive control. For each target gene, we performed Western blot analysis on the cells to select the sgRNAs with the highest protein reduction (Supplementary Fig. 6). Upon subcutaneous implantation of these cells in immunocompetent C57BL/6 mice, we did not observe any significant changes in tumour growth kinetics between untreated control cells and CRISPR-modified cells (Fig. 5i). However, after treatment of these tumours with adoptive transfer of tumour-specific Pmel-1 TCR transgenic T cells (which target melanoma antigen gp100)33, B2m knock-out in these tumours significantly diminished the efficacy of adoptive cell transfer (ACT) treatment as measured by tumour growth (Wilcoxon rank sum test, P = 0.0002, Fig. 5i) and host survival (log-rank test, P < 0.0001, Fig. 5j). Similarly, for Aplnr knock-out tumour cells, we observed a significant reduction in the tumour clearance (P = 0.0042, Fig. 5i) and host survival (P < 0.019, Fig, 5j) after ACT. As an orthogonal method to our genome-edited B16 tumours, we confirmed that shRNA-mediated Aplnr knockdown in B16 using two independent hairpins also reduced ACT efficacy (Extended Fig. 10). In addition, we found that Aplnr KO in B2905 mouse melanoma reduced the efficiency of anti-CTLA4 blockade in vivo with 0 out of 10 mice experiencing a complete regression with sg-Aplnr-transduced cells versus 5 out of 10 mice with sg-Control-transduced cells (Supplementary Fig. 7). Taken together, these data demonstrate that APLNR loss reduces the effectiveness of T cell-based cancer therapies including immune checkpoint blockade and ACT.
Discussion
To capture the genes necessary for a complex phenomenon such as the EFT in cancer immunotherapy, we developed a 2CT-CRISPR screening system and used it to identify several genes capable of modulating melanoma growth when targeted by T cells. Given the association of these genes with intratumoral CYT in pan-cancer TCGA datasets, this resource provides a rich trove of new targets to investigate resistance to T cell-based therapies. Reverting or bypassing the functional loss of such genes in tumours using drugs such as epigenetic modulators34,35 may allow development of new combinatorial treatment strategies to improve clinical responses with immunotherapies.
Our data reveals a novel role of APLNR in regulating the anti-tumour response of T cells via modulation of the JAK-STAT signalling in target cells. It has been shown that Angiotensin receptor, a closely related GPCR to APLNR, also directly regulate the JAK-STAT pathway36. A recent study has shown that T cell effector cytokines IFNγ and TNFα exerts an anti-tumour effect by altering endothelial cells of blood vessels (where APLNR is highly expressed37) to induce ischemia in the tumour stroma38. Given our finding that APLNR interacts with JAK1 to augment IFNγ response, APLNR can further increase the sensitivity of tumour blood vessels to IFNγ and thus improve anti-tumour efficacy of T cells. Hence, we speculate that APLNR might have a role beyond direct tumour cell recognition in vivo, and its expression on tumour blood vessels and stromal cells should be investigated in future studies.
In summary, we have utilized a two cell-type CRISPR screen to discover both well-established and novel genes in cancer cells that regulate EFT. Our findings have direct clinical implications as these data may serve as a functional blueprint to study the emergence of tumour resistance to T cell-based cancer therapies. Recent clinical trials have raised the question of why most patients fail to experience complete regressions of their cancers7. Our study provides a comprehensive list of genes that can contribute to resistance of human tumours to immunotherapy and have also identified loss-of-function mutations shared with those observed in patients that fail to respond to immunotherapy (Supplementary Discussion, Supplementary Fig. 8). A careful evaluation and validation of mutations in these genes on a personalized basis in immunotherapy-resistant patients may allow identification of novel mechanisms of immune escape and speed the development of a new category of drugs that circumvent these escape mechanisms.
METHODS
Human Specimen
Peripheral blood mononuclear cells (PBMCs) were isolated from healthy donors and tumour samples were isolated from patients with melanoma. All human specimens were collected with informed consent and procedures approved by the institutional-review board (IRB) of the National Cancer Institute (NCI).
Mice
Animal experiments were approved by the Institutional Animal Care and Use Committees of the NCI and performed in accordance with NIH guidelines. C57BL/6J were purchased from The Jackson Laboratory. Female mice aged 6–8 weeks were used for tumour implantation experiments.
Cell culture
The melanoma cell lines HLA-A*02+/MART-1+ / NY-ESO-1+(Mel624.38, Mel1300), HLA-A*02− (Mel938) and HLA-A*02+ / NY-ESO-1− (Mel526) were isolated from surgically resected metastases as previously described17, and were cultured in RPMI 1640 (Invitrogen) medium supplemented with 10% fetal bovine serum (FBS, Hyclone, Logan, UT). The A375 (HLA-A*02+/NY-ESO-1+) cell line was obtained from the American Type Culture Collection (Manassas, VA). The SK23 cell line transduced with retrovirus containing NY-ESO-1 expressing vector (SK23 NY-ESO-1+) and HLA-A*02+ renal cell carcinoma (2245R) cells was obtained from Ken-ichi Hanada (Surgery Branch, NCI) and cultured in RPMI 1640 medium supplemented with 10% FBS. A375 cells were cultured in D10 medium containing DMEM supplemented 10% FBS, 2 mM L-glutamine, and 1% penicillin-streptomycin (Life Technologies). Cell lines were confirmed mycoplasma negative using Mycoplasma detection kit (Biotool #B3903). All PBMCs and lymphocytes used for transduction and as feeder cells were obtained from aphereses of NCI Surgery Branch patients on IRB-approved protocols. They were cultured in T cell medium, which is: AIM-V medium (Invitrogen) supplemented with 5% human AB serum (Valley Biomedical, Winchester, VA), 100 U/ml penicillin and 100 μg/ml streptomycin, 2 mM L-glutamine and 12.5 mM HEPES (Life Technologies).
Retroviral Vectors and Transduction of Human T cells
Retroviral vectors for TCRs recognizing the HLA-A*02–restricted melanoma antigens NY-ESO-1 (NY-ESO-1:157–165 epitope) and MART-1 (MART-1:27–35 epitope, DMF5) were generated as previously described17,18. Clinical grade cGMP-quality retroviral supernatants were produced by the National Gene Vector Laboratories at Indiana University. For transduction, peripheral blood lymphocytes (PBLs) (2 × 10⁶ cell/mL) were stimulated with IL-2 (300 IU/mL) and anti-CD3 antibody OKT3 (300 IU/ mL) on Day 0. Non-tissue culture treated six-well plates were coated with 2 mL/well of 10 μg/mL RetroNectin (Takara Bio, Otsu, Japan) on day 1 and stored overnight at 4 °C. Vector supernatant (4 mL/well, diluted with D10 media) were applied to plates on day 2 followed by centrifugation at 2000×g for 2h at 32°C. Half the volume was aspirated and PBLs were added (0.25–0.5 × 10⁶ cell/mL, 4 mL/well), centrifuged for 10 min at 1000×g, and incubated at 37 °C / 5% CO2. A second transduction on day 3 was performed as described above. Cells were maintained in culture at 0.7–1.0 × 10⁶ cell/mL. After harvest, cells underwent a rapid expansion protocol (REP) in the presence of soluble OKT3 (300 IU/mL), IL-2 (6000 IU/mL) and irradiated feeders as previously described18. After day 5 of the REP, cells were frozen down for co-culture later.
Lentivirus Production and Purification
To generate lentivirus, HEK293FT cells (Invitrogen) were cultured in D10 medium. One day prior to transfection, HEK293FT cells were seeded in T-225 flasks at 60% confluency. One to two hours before transfection, DMEM media was replaced with 13 mL of pre-warmed serum-free OptiMEM media (Invitrogen). Cells were transfected using Lipofectamine 2000 and Plus reagent (Invitrogen). For each flask, 4 mL of OptiMEM was mixed with 200 μL of Plus reagent, 20 μg of lentiCRISPRv2 plasmid or pooled plasmid human GeCKOv2 (Genome-scale CRISPR Knock-Out) library, 15 μg psPAX2 (Addgene, Cambridge, MA) and 10 μg pMD2.G (Addgene). 100 μl Lipofectamine 2000 was diluted with 4 mL of OptiMEM and was combined to the mixture of plasmids and Plus reagent. This transfection mixture was incubated for 20 minutes and then added dropwise to the cells. 6–8 h post transfection, the media was replaced to 20 mL of DMEM supplemented with 10% FBS and 1% BSA (Sigma). Virus containing media was harvested 48 h post-transfection. Viral titer was assayed with Lenti-X GoStix (Clontech, Mountain View, CA). Cell debris were removed by centrifugation of media at 3,000 rcf and 4 ˚C for 10 minutes followed by filtration of the supernatant through a 0.45 μm low-protein binding membrane (Millipore Steriflip HV/PVDF). For individual lentiCRISPRv2 plasmids, viral supernatants were frozen in aliquots at −80 °C. For pooled library plasmids, viral supernatants were concentrated by centrifugation at 4,000 rcf and 4 ˚C for 35 min in Amicon Ultra-15 filters (Millipore Ultracel-100K). Concentrated viral supernatants were stored in aliquots at −80 °C.
Two Cell-type (2CT) T cell and Tumour Cell Co-culture Assay
NY-ESO-1 and MART-1 T cells were used for co-culture assays. Two days prior to co-culture, cells were thawed in T cell media containing 3 U/mL DNAse (Genentech Inc., South San Francisco, CA) overnight. Tumour cells were seeded at specific density on this day in the same media as the T cells. T cells were then cultured in T cell media containing 300 IU/mL interleukin-2 (IL2) for 24 hours. T cells were co-cultured with tumour cells at various Effector: Target (E:T ratios) for varying time periods. To reduce T cell killing activity and enrich for resistant tumour cells during the recovery phase, T cells were removed by careful 2x phosphate buffered saline (PBS) washes following the addition of D10 media without IL2. At the end of recovery phase of co-culture, tumour cells were detached using trypsin (Invitrogen) and washed twice with PBS. Tumour cells were then stained with fixable Live/Dead dye (Invitrogen) followed by human anti-CD3 antibody (clone SK7, BD) in FACS staining buffer (PBS + 0.2% BSA). Cell counts were measured using CountBright Absolute Counting Beads (Invitrogen) by FACS.
2CT GeCKOv2 Screens and Genomic DNA Extractions
Cell-cell interaction genome-wide screens were performed using Mel624 cells transduced independently with both A and B GeCKOv2 libraries21. For one screen, we split two groups of 5 × 10⁷ transduced Mel624 cells. One group was co-cultured with 1.67 ×10⁷ patient-derived NY-ESO-1 T cells (Effector to target [E:T] ratio of 1:3 or 0.3) for each library. A second (control) group were cultured under the same density and conditions but without T cells. The co-culture phase was maintained for 12 hours after which the T cells were removed as described above. The recovery phase was maintained for another 48 hours. In this initial screen, NY-ESO-1 T cells lysed ~76% of tumour cells, and the surviving cells were frozen to evaluate sgRNA enrichment later. For a second screen, we similarly transduced Mel624 cells with the GeCKOv2 library and split them into two groups of 5 × 10⁷ transduced cells. For one group, we increased the E:T ratio to 0.5 by co-culture of 2.5 × 10⁷ NY-ESO-1 T cells with 5 × 10⁷ transduced Mel624 cells for each library while keeping all other conditions similar. As before, the second group of Mel624 cells were used as controls, which were cultured under the same density and conditions, but without T cells. By increasing the selection pressure, we observed that T cells killed ~90% of library transduced Mel624 cells.
To evaluate sgRNA enrichment, cells with and without T cell co-culture (along with an early time point collected after puromycin selection) were harvested and frozen. For gDNA extraction from harvested tumour cells, we used our previously optimized ammonium acetate and alcohol precipitation procedure to isolate gDNA14 but substituted AL buffer (Qiagen) for the initial cell lysis step.
2CT-CRISPR Pooled Screen Readout and Data Analysis
To determine sgRNA abundance as the readout of library screens, two-step PCR amplification were performed on gDNA using Takara Ex-Taq polymerase (Clontech). The first PCR step (PCR1) included amplification of the region containing sgRNA cassette using v2Adaptor_F and v2Adaptor_R primers, and the second step PCR (PCR2) included amplification using uniquely barcoded P7 and P5 adaptor-containing primers to allow multiplexing of samples in a single HiSeq run12. All PCR1 and PCR2 primer sequences, including full barcodes, are listed on the GeCKO website (http://genome-engineering.org/gecko/). Assuming 6.6 pg of gDNA per cell, 150 μg of gDNA was used per sample (~350-fold sgRNA representation), in 15 PCR1 reactions. For each PCR1 reaction, 10 μg gDNA were used in a 100 μl reaction performed under cycling conditions: 95 °C for 5 min, 18 cycles of (95 °C for 30 s, 62 °C for 30 s, 72 °C for 30 s), and 72 °C for 3 min. PCR1 products for each sample were pooled and used for amplification with barcoded second step PCR primers. For each sample, we performed 7 PCR2 reactions using 5 μL of the pooled PCR1 product per PCR2 reaction. PCR2 products were pooled and then normalized within each biological sample before combining uniquely-barcoded separate biological samples. The pooled product was then gel-purified from a 2% E-gel EX (Life Technologies) using the QiaQuick gel extraction kit (Qiagen). The purified, pooled library was then quantified with Tapestation 4200 (Agilent Technologies). Diluted libraries with 5%–20% PhiX were sequenced on a HiSeq 2000.
Demultiplexed reads were trimmed by cutadapt using 12 bp flanking sequences around the 20 bp guide sequence39. Trimmed reads were aligned using Bowtie40 to the GeCKOv2 indexes created from library CSV files downloaded from the GeCKO website (http://genome-engineering.org/gecko/?page_id=15). Read alignment was performed with parameters -m 1 -v 1 -norc, which allows up to 1 mismatch and discards any reads that do not align in the forward orientation or that have multiple possible alignments. Aligned counts of library sgRNAs were imported into R/RStudio. Counts were normalized by the total reads for each sample and then log-transformed. A gene ranking was computed using the second most enriched sgRNA for each gene (Second most enriched sgRNA score) and the RIGER weighted-sum method22.
Gene Pathway Enrichment Analysis
For pathway analysis, we constructed a set of enriched candidate genes by taking advantage of the 1,000 control (non-targeting) sgRNAs embedded in our pooled library with at least one sgRNA enriched above the most enriched non-targeting control (Fig. 3a, FDR < 0.1%, second most enriched sgRNA score > 0.5). This yielded a list of 554 genes. In this list, we looked for gene category over-representation using Ingenuity Pathway Analysis (QIAGEN Redwood City, www.qiagen.com/ingenuity). The analysis criteria were set as follows: 1) querying for molecules with Ingenuity Knowledge Base as a reference set; 2) restricted to human species; and 3) experimentally observed findings as a confidence level. Fisher’s Exact Test (P < 0.05) was used to compute significance for over-representation of genes in a particular pathway or biological process.
The Cancer Genome Atlas (TCGA) Correlation and Mutation Analysis
TCGA RNA-seq data in form of normalized RNA-Seq by Expectation-Maximization (RSEM) values from multiple cancer data sets was downloaded from the Firehose Broad GDAC (http://gdac.broadinstitute.org/, DOI for data release: 10.7908/C11G0KM9) using the TCGA2STAT package for R41, and used to find overlap between TCGA gene expression indicative of cytolytic activity and genes from our pooled screen where loss-of-function confers resistance to T cell killing. We first identified the genes correlated with a previously identified cytolytic activity signature (CYT), namely the geometric mean of granzyme A (GZMA) and perforin 1 (PRF1) expression15. To identify these genes in the TCGA data, we calculated the geometric mean of GZMA and PRF1 in each data set and searched for any genes with a positive correlation to this quantity across patients (Pearson’s r > 0, P < 0.05). We then examined the intersection between genes whose expression was correlated with cytolytic activity (TCGA datasets) and the enriched genes found in the CRISPR screen (554 genes). Individual heatmaps for the two sets of clustered genes were regenerated for each cancer type and can be found at https://bioinformatics.cancer.gov/publications/restifo.
For the top 20 ranked gene candidates from any of the screens, we obtained patient mutation data from the TCGA database using cBioPortal42,43. For mutation frequency counts, tumours containing likely loss-of-function genetic aberrations (defined as homozygous deletion, missense, nonsense, frame-shift, truncated or splice-site mutations) were included in the analysis.
Arrayed Validation of 2CT-CRISPR Screen Genes
Individual lentiCRISPRs were produced as above except that viral supernatants were not concentrated. For each gene, we used 3–4 sgRNA guide sequences as listed in Supplementary Table 7, where 2 sgRNAs sequences were designed de novo and the other 2 sgRNAs were from GeCKOv2 library. We cloned these sgRNAs into the lentiCRISPRv2 vector (Addgene) as previously described21. To produce virus in a high-throughput format, HEK293FT cells were seeded and transfected in 6-well plates where each well received a different lentiCRISPR plasmid. The lentiviral production protocol was the same as the one described above for GeCKOv2 library lentivirus production (scaled to 6-well format). Mel624 and A375 cells with unique gene perturbations were generated by transduction with these viral supernatants. Typically, we used 500 μl of lentiCRISPRv2 virus per 5 × 10⁴ cells for Mel624 and A375. Puromycin selection (1 ug/ml) was applied to these cells for 5–7 days. Over this period, untransduced cells were killed completely by puromycin.
After taking a subset of cells for analysis of insertion-deletion (indel) mutations, the remainder were normalized to seed 1 × 10⁴ cells/well in 96-well plates. During the arrayed screen, each cell line was co-cultured with appropriate T cells (either NY-ESO-1 or MART-1) in a 96-well plate format at an E:T ratio of 1:3 for 12 hours in T cell media. As in the pooled screen, we performed gentle 2x PBS washes to remove the T cells. Mel624 or A375 cells were collected after a recovery phase culture of 48 hours for high-throughput FACS analysis. Tumour cell counts were measured using a FACS-based CountBright bead method (Life Technologies). We noticed variability in proliferation and survival rates across cells depending on the sgRNA received. To account for this variability, we calculated a relative percent change for each sgRNA: (%Δ, 2CT vs noT) in tumour cells co-cultured with T cells (2CT) compared to tumour cell counts without T cells (noT). The normalized cell survival was calculated by the following formula:
For co-culture with MART-1 T cells, all parameters were the same, except that the co-culture period duration was 24 hours with the same recovery period as with NY-ESO-1 experiments.
Indel Mutation Detection for Array 2CT Validation
Genomic DNA from thawed cell pellets was purified using the Blood & Cell Culture kit (Qiagen). SgRNA target site PCR amplifications were performed for each genomic loci using conditions as described previously14, pooled together and then sequenced in a single Illumina MiSeq run. All primer sequences for indel detection can be found in Supplementary Table 8.
To analyze the data from the MiSeq run, paired-end reads were trimmed for quality using trimmomatic with parameters SLIDINGWINDOW:5:2544. Reads with surviving mate pairs were then aligned to their targeted amplicon sequence using Bowtie245. To determine indel sizes, we calculated the size difference between observed reads and predicted read size based on the genomic reference sequence. If observed read size was equal to the predicted size, these reads were scored as no indels. The size difference was used to detect insertions or deletions.
Flow Cytometry and Immunoassays
Tumour cells or T cells suspended in FACS staining buffer were stained with fluorochrome-conjugated antibodies against combinations of the following surface human antigens: CD4 (RPA-T4, BD, Franklin Lakes, NJ), CD8 (SK1, BD), CD3e (SK7, BD), HLA-A*02/MART-1:27–35 tetramer (DMF5, Beckman Coulter Immunotech, Monrovia, CA); NY-ESO-1 tetramer (NIH Tetramer Core Facility); PD1-L1 (MIH1, eBiosciences, San Diego, CA); PD1-L2 (24F.10C12, Biolegend, San Diego, CA); IFNγ (25723.11, BD), CD58 (1C3, BD) and β2M (2M2, Biolegend). Cell viability was determined using propidium iodide exclusion or a fixable live/dead kit (Invitrogen). Intracellular staining assay (ICS) on ESO T cells after 5–6 hours of co-culture with A375 cells, where T cells were pre-treated with monensin (512092KZ, BD) and brefeldin A (512301KZ, BD), was performed using manufacturer’s instructions for BD Flow cytometry ICS. Flow cytometric data were acquired using either a FACSCanto II or LSRII Fortessa cytometer (BD), and data were analysed with FlowJo version 7.5 software (FlowJo LLC, Ashland, OR).
The amount of IFNγ release by T cells after co-culture with tumour cells was measured by Sandwich ELISA assay using anti-IFNγ (Thermo Scientific #M700A) coated 96-well plates, biotin-labeled anti-IFNγ (M701B), HRP-conjugated streptavidin (N100) and TMB substrate solution (N301).
Quantitative PCR analysis
Total RNA was extracted from cells using RNeasy Plus Mini Kit (Qiagen). Gene expression was quantified using TaqMan RNA-to-Ct 1-Step Kit (Thermo Fisher) and Taqman assay probes (Invitrogen): Aplnr (Mm00442191_s1), Actb (Mm00607939_s1), APLN (Hs00936329), ACTB (Hs01060665_g1), IRF1 (Hs00971965_m1), IFI30 (Hs00173838_m1), TAP1 (Hs00388675_m1), TAP2 (Hs00241060_m1), TAPBP (Hs00917451_g1) and JAK1 (Hs01026983_m1). Relative mRNA expression was determined via the ΔΔCt method.
Immunoprecipitation and Western Blot Analysis
For immunoprecipitation, cells were lysed on ice in IP lysis buffer (Thermo Fisher #87787) supplemented with protease and phosphatase inhibitors (Thermo Fisher #88668) for 15 min. Lysates were cleared by centrifugation at 16,000g for 10 min at 4 °C and supernatants were incubated with indicated antibodies for 24 h at 4 °C. Following incubation, cells were added to pre-washed Dynabeads coupled to protein G or protein A (Life Technologies) and incubated for 3 h at 4 °C. Immune complexes were purified on magnets with extensive washing with lysis buffer. Purified complexes were mixed with sample buffer and assayed by western blot. Antibodies used included: anti-Jak1 (BD #610231), anti-Jak2 (Cell Signaling #3230), anti-FLAG (Cell Signaling #8146). In some cases, immune complexes were isolated with sepharose conjugated antibodies specific for IgG (Cell Signaling #3420) or FLAG (Cell Signaling #5750).
For immunoblots, total protein was extracted with 1X RIPA lysis buffer (Millipore, Billerica, MA) with 1X protease inhibitor (Roche, Basel, Switzerland). Protein concentration was determined using the BCA assay (Thermo/Pierce). Cell lysates were resolved on 4–20% Tris-Glycine gels (Invitrogen), transferred to PVDF membranes (Millipore), and incubated overnight at 4 °C with the appropriate primary antibodies: Anti-Aplnr (Abcam #ab214369), Anti-β2M (Abcam #ab75853) and Anti-β Actin (Abcam #ab8227) for mouse tumour cells; Anti-APLNR (Abcam #ab97452), Anti-phospho-JAK1 (Cell Signaling #3331) and Anti-phospho-STAT1 (Cell Signaling #7649). Signals were detected using HRP-conjugated secondary antibodies (Santa Cruz Biotechnology) and SuperSignal West Femto Chemiluminescent Substrate (Thermo/Pierce). Images were captured using ChemiDoc Touch imaging system (Bio-Rad, Hercules, CA).
Whole Exome sequencing and Transcriptomics analysis
Whole exome sequencing of patient tumour was performed as previously described46. To measure genome-scale transcriptomic analysis on APLNR-KO cells, total RNA was extracted using the RNeasy Plus Mini Kit (Qiagen). The quality and quantity of extracted total RNA was assessed using TapeStation 2200 (Agilent). All RNA-Seq analyses were performed using three biological replicates. 200 ng of total RNA was used to prepare RNA-Seq library using the TruSeq RNA sample prep kit (Illumina). Paired-end RNA sequencing was performed on a HiSeq 2000 (Illumina). Sequenced reads were aligned to the human genome (hg19) with Tophat 2.0.1147 and the mapped data was then processed by Cufflinks. Gene expression values were normalized to obtain RPKM (reads per kilobase exon model per million mapped reads) values using CuffDiff48. To define differentially expressed genes, we used a 2-fold change and P < 0.05 difference between groups.
Characterization of APLNR patient mutations using 2CT assay
APLNR was perturbed in A375 cells using LentiCRISPRv2 encoding APLNR_sg1 (Supplementary Table 7). Cells were selected with puromycin for 5–7 days. For rescue experiments, cells were transduced with a lentiviral (blasticidin-selectable) plasmid encoding codon-shuffled APLNR sequences (either wild-type or with specific patient mutations). APLNR sequences were re-coded to ensure that APLNR_sg1 cannot introduce Cas9-mediated breaks in the APLNR transgene. Transduced A375 cells were selected with 10 μg/ml blasticidin for 5 days. Expression of these constructs in cells was verified by Western analysis. Cells were subject to 2CT-assay with ESO T cells as described above.
Adoptive Cell Transfer (ACT) and Tumour Immunotherapy
For immunotherapy experiments, we used murine-human chimeric gp100 antigen overexpressing B16 melanoma (mhgp100-B16) cells that are responsive to adoptive transfer of Pmel-1 TCR transgenic CD8+ T cells in an in vivo setting. We generated gene-deleted mhgp100-B16 cells using lentiviruses encoding sgRNAs targeting Aplnr (5′-GATCTTGGTGCCATTTTCCG-3′) or B2m (5′-GAAATCCAAATGCTGAAGAA-3′) loci as described above. C57BL/6 mice were subcutaneously implanted with 5 × 10⁵ mhgp100-B16 cells. After 10 days of tumour implantation, mice (n = 10 for treatment groups) were sub-lethally irradiated (600 cGy), and injected intravenously with 1 × 10⁶ Pmel-1 CD8+ T cells and received intraperitoneal injections of IL-2 in PBS (6 × 10⁴ IU per 0.5 ml) once daily for consecutive 3 days. All tumour measurements were blinded. Tumour size was measured in a blinded fashion approximately every two days after transfer and tumour area was calculated as length × width of the tumour. Mice with tumours greater than 400 mm2 were euthanized. The products of the perpendicular tumour diameters are presented as mean ± s.e.m. at the indicated times after ACT. In another experimental setting, we also used RNA-interference-mediated knock-down of Aplnr in mhgp100-B16 cells to perform adoptive transfer as above. Lentiviral particles encoding shRNAs (Dharmacon, shRNA1-V2LMM_36640; shRNA2-V3LMM_517943) were used to knock-down expression of Aplnr in mhgp100-B16 cells. qPCR analysis was performed on these cells to confirm knock-down efficiencies of these constructs.
B2905 is a melanoma cell line derived from spontaneous tumour induced by UV irradiation of C57BL/6-HGF transgenic mice49. We generated gene-deleted B2905 cells using lentiCRISPR encoding Aplnr sgRNA as above. We implanted 1 × 10⁶ tumour cells subcutaneously on C57BL/6 mice. Intraperitoneal injections of 250 μg of anti-CTLA4 monoclonal antibody (Bio X cell, BE0131) or IgG control antibody were given on days 10, 13, 16 and 19 post implantations. Tumour size was measured in a blinded fashion approximately every 10 days and tumour area was calculated as length × width of the tumour. Due to large intra-individual differences in tumour growth rates (Supplementary Fig. 7a), the significance of resistance to anti-CTLA4 treatment was determined by Fisher’s exact test comparison of sg-Ctrl versus sg-Aplnr groups using the number of progressing tumours and completely regressed tumours in each group.
Statistical Analysis
Data between two groups were compared using a two-tailed unpaired Student’s t-test or the Mann-Whitney test as appropriate for the type of data (depending on normality of the distribution). Unless otherwise indicated, a P-value less than or equal to 0.05 was considered statistically significant for all analyses, and not corrected for multiple comparisons. To compare multiple groups, we used an analysis of variance (ANOVA) with the Bonferroni correction. All group results are represented as mean ± s.e.m, if not stated otherwise. Prism (GraphPad Software Inc., La Jolla, CA) was used for these analyses.
Data Availability
Data that support the findings of this study are available from the corresponding author upon reasonable request.
Extended Data
Extended Data Figure 1. Intratumoral expression of antigen presentation genes, B2M, TAP1 and TAP2 informs long-term survival of melanoma patients treated with anti-CTLA4 (ipilimumab) immunotherapy.
a, Pearson correlation matrix of intratumoral cytolytic activity (CYT, expression of perforin and granzyme A15) with tumour infiltrating effector cell markers for natural killer (NK, expression of NCAM1 and NCR1), regulatory T (Treg, expression of FOXP3 and IL2RA), CD4+ T (expression of CD3E and CD4) and CD8+ T cells (expression of CD3E and CD8A). b, Pearson correlation matrix of CYT with the expression of MHC class I antigen presentation genes. c, Pearson correlation matrix of CYT with the expression of IFNγ signalling genes. d–g, Kaplan-Meier survival plots of patient overall survival with the expression of antigen presentation genes after ipilimumab immunotherapy (Van allen et al. cohort3). Data were divided into quartiles based on RPKM values of each individual gene and the four groups were evaluated for their association with survival. The global P-values shown indicate the overall association of the quartiles of gene expression levels with survival. n = 42 patients (a–g).
Extended Data Figure 2. Optimization of selection pressure and duration of co-culture for 2CT-CRISPR assay system.
a, FACS plots showing percentages of CD4+ and CD8+ T cells in three different patient PBMCs after transduction with a retroviral plasmid encoding NY-ESO-1 TCR and expansion for 7 days. b, Transduction efficiency of T cells transduced with a retroviral plasmid encoding NY-ESO-1 TCR as determined by FACS. T cells were obtained from the peripheral blood of patients with metastatic melanoma. c, Transduction efficiency of T cells transduced with a retroviral plasmid encoding NY-ESO-1 TCR as determined by FACS. T cells were obtained from the peripheral blood of healthy donors. d, Transduction efficiency of T cells transduced with a retroviral plasmid encoding MART-1 TCR as determined by FACS. T cells were obtained from the peripheral blood of healthy donors. e, Representative plots of FACS-based determination of live, PI− (propidium iodine) CD3− tumour cell counts after co-culture of patient ESO T cells with Mel624 cells at an E:T ratio of 100 for 24 h. f, Barplot quantifies the cytolytic efficiency of T cells for data shown in (e). n = 3 biological replicates. g, Optimization of selection pressure exerted by ESO T cells on Mel624 cells at variable timings of co-culture and E:T ratios. Numbers in the grid represent average tumour cell survival (%) after co-culture. Data pooled from 3 independent experiments. n = 3 culture replicates. h, Upregulation of β2M expression at 0, 6 or 12 hours after co-culture of Mel624 cells with ESO T cells at an E:T ratio of 0.5. Left panel: Representative FACS plot showing distribution of β2M expressing tumour cells. Right panel: Bar plot depicts mean fluorescence intensities of n = 3 co-culture replicates. i, Specific reactivity of ESO T cells against NY-ESO-1 antigen assessed in tumour lines by IFNγ secretion (pg/ml) after overnight co-culture. n = 3 co-culture replicates. Values in f and h are mean ± s.e.m. ***P < 0.001 as determined by two-tailed Student’s t-test.
Extended Data Figure 3. Optimization of 2CT-CRISPR assay system for genome-scale screening.
a, Representative FACS plot of B2M expression in Mel624 cells on day 5 after transduction with lentiCRISPRv2 lentivirus containing a pool of three sgRNAs targeting B2M. b–c, Cas9 disruption of MHC Class I antigen presentation/processing pathway genes reduces efficacy of T cell-mediated cytolysis. Timeline shows 12 hours of co-culture of ESO T cells with individual gene edited Mel624 cells at E:T ratio of 0.5. Live cell survival (%) was calculated from control cells unexposed to T cell selection. Each dot in the plot represents independent gene-specific CRISPR lentivirus infection replicate (n = 3). Improvement in CRISPR edited cell yields at 60 h timepoint compared to 36 h after 2CT assay as shown in (c). All values are mean ± s.e.m. Data is representative of two independent experiments.
Extended Data Figure 4. Genome-scale 2CT-CRISPR mutagenesis identifies genes in tumour cells essential for the effector function of T cells.
a, Scatterplot of sgRNA representation in the plasmid pool and Mel624 cells at Day 7 after transduction with the GeCKOv2 library for 2CT-CRISPR screens with E:T of 0.5 and 0.3. b, Scatterplot showing the effect of T cell selection pressure on the global distribution of sgRNAs after co-culture at E:T of 0.5 and 0.3. c, Agreement between top ranked genes enriched via two different metrics-second most enriched sgRNA and RIGER P-value analyses in 2CT-CRISPR screens performed at E:T of 0.5. d, Scatterplot showing the enrichment of the most versus the second most enriched sgRNAs for top 100 genes after T cell-based selection at E:T 0.3. Data pooled from 2 independent screens with libraries A and B. e, Overlap of genes and miRs enriched after T cell-based selection at E:T of 0.5 (high selection) and 0.3 (low selection). Venn diagrams depicts shared and unique most enriched candidates in top 5% of the second most enriched sgRNA. f, Common enriched genes across all screens within the top 500 genes ranked by the second most enriched sgRNA.
Extended Data Figure 5. Association of candidate essential genes with CYT and mutation spectrum.
a, Top candidate genes are categorized based on their inducibility by effector cytokines IFNγ (light blue) or TNFα (orange), using publicly available gene expression profiles GSE3920, GSE5542, GSE2638. b, Genes whose expression are positively correlated (P < 0.05) with cytolytic activity (defined as the geometric mean of PRF1 and GZMA expression) in TCGA datasets for 36 human cancers. c, Overlap (Jaccard coefficient) between genes correlated with cytolytic activity (from panel b) with top 2.5% of CRISPR screen gene hits (with second best sgRNA enrichment > 0.5). d, Bubble plot depicting the number of overlapping genes from (b) correlated across multiple cancers. Previously known genes B2M, CASP7 and CASP8, and novel validated genes from CRISPR screen are highlighted (in bold) according to their correlation to the cytolytic activity in the number of different cancer-types. The size of each bubble represents the number of genes in each dataset. d–e, Pan-cancer mutational heterogeneity of top candidate genes from CRISPR screens with T cell based selection at E:T of 0.5 (d) and 0.3 (e). Patient tumour data containing genetic aberrations including missense, nonsense, non-start, frameshift, truncation or splice-site mutations, or homozygous deletions was retrieved from TCGA database.
Extended Data Figure 6. Validation of top ranked candidate genes using Mel624 cells and two different T cell receptors.
a–b, Survival of Mel624 cells edited with individual sgRNAs (2–4 per gene) after co-culture with ESO T cells (a) and MART-1 T cells (b) at E:T ratio of 0.5 in 2CT assay. P-value calculated for positively enriched gene-targeting sgRNAs compared to control sgRNA by Student’s t-test. Data representative of at least two independent experiments. n = 3 replicates per sgRNA. c. Representative histogram of deep sequencing analysis of on-target insertion-deletion (indel) mutations by individual lentiCRISPR. d–e, Deep sequencing analysis of indels generated by CRISPR-Cas9 at each exonic target site for the genes validated in Mel624 cells at day 20 post-transduction.
Extended Data Figure 7. Gene perturbation efficiency and indel mutations after CRISPR-Cas9 targeted disruption in A375.
Deep sequencing analysis of indels generated by CRISPR-Cas9 at each exonic target site for validated in A375 cells at day 5 post-transduction. Average values are mean. Error bars denotes s.e.m.
Extended Data Figure 8. Characterization of non-synonymous mutations in APLNR identified in patient tumours resistant to immunotherapy.
a, List of all somatic mutations in APLNR from 4 published immunotherapy studies3,5,28,29 and 1 unpublished patient tumor from NCI Surgery Branch (SB). b, Schematic of the re-introduction of WT or mutated APLNR in APLNR-edited cells to functionally verify the point mutations from the SB and Van Allen et al. cohorts. Blasticidin selects for cells that received the WT/mutated APLNR rescue construct.
Extended Data Figure 9. APLNR modulates IFNγ signaling via physical interaction with JAK1.
a, Pull-down of JAK1 and APLNR in the extracts from HEK 293T cells transiently transfected with APLNR-FLAG plasmid. b, Immunoblot showing the upregulation of JAK1 protein expression in APLNR overexpressing A375 cells (APLNR OE). EV: Empty vector control. c, Effect of overexpression of APLNR in tumour cells on T cell-mediated cytolysis. n = 4 biological replicates. d, Immunoblot showing that addition of 100 μM Apelin ligand does not induce phosphorylation of JAK1 in tumour cells. e, Immunoblot showing the phosphorylation levels of JAK1 at Tyr1022/1023 residues and STAT1 at Tyr701 residue upon 100 ng/ml IFNγ treatment for 30 min in APLNR-edited cells versus cells receiving a control sgRNA. f, Quantitative PCR analysis of JAK1-STAT1 pathway-induced genes in APLNR-edited cells post 4, 8 and 24 h of treatment with 1 μg/ml IFNγ. n = 3 biological replicates. g, Induction of surface expression of β2M on APLNR-edited cells upon co-culture with ESO T cells for 6 h as measured by FACS. h, Intracellular staining assay performed on CD8+ T cells to measure IFNγ production post co-culture with A375 cells as target for 5–6 hr. n = 3 biological replicates. All data are representative of at least two independent experiments. Error bars represent mean ± s.e.m. of replicate measurements. **** P < 0.0001, *** P < 0.001 **P < 0.01, *P < 0.05.
Extended Data Figure 10. APLNR knock-down decreases the efficiency of in vivo adoptive cell transfer immunotherapy.
Subcutaneous tumour growth in mice receiving ACT of Pmel T cells. Tumour area (a) and overall survival (b) are shown. Significance for tumour growth kinetics were calculated by Wilcoxon rank sum test. Survival significance was assessed by a log-rank Mantel-Cox test. n = 5 mice per ‘Untreated’ groups. n = 10 mice per ‘Pmel ACT treated’ groups. All values are mean ± s.e.m. ****P < 0.0001, **P < 0.01, *P < 0.05. Data are representative of two independent experiments.
Supplementary Material
Acknowledgments
The research was supported by the Intramural Research Program of the NCI, and by the Cancer Moonshot program for the Center for Cell-based Therapy at the NCI, NIH. The work was also supported by the Milstein Family Foundation. We thank S. A. Rosenberg, K. Hanada, A. Wellstein, C. Hurley and L. M. Weiner for their valuable discussions and intellectual input, M. Kruhlak, Z. Yu, C. Subramaniam, C. Kariya, A. J. Leonardi, N. Ha, H. Xu, M. A. Black and H. Chinnasamy for technical assistance in this project. This work utilized the computational resources of the NIH HPC Biowulf cluster (http://hpc.nih.gov). The results here are in part based upon data generated by the TCGA Research Network: http://cancergenome.nih.gov/. This study was done in partial fulfilment of a PhD in Tumor Biology to S.J.P. N.E.S. is supported by the NIH through NHGRI (R00-HG008171) and a Sidney Kimmel Scholar Award.
Footnotes
Author contributions
S.J.P. and N.P.R. designed the study. S.J.P., N.E.S., and N.P.R. wrote the manuscript. S.J.P. carried out CRISPR screens and validation experiments. N.E.S analysed CRISPR screen data and human mutation datasets from immunotherapy cohorts. T.Y., G.U.M., A.C., M.S and S.F. assisted in generation of TCR-engineered T cells and CRISPR-edited cells. R.E., A.E., T.Y., S.V., G.U.M., A.C. and M.S. edited the manuscript. S.J.P, A.E. and S.V. carried out murine experiments. G.M., E.G. and C.D. developed B2905 murine model for anti-CTLA4 experiments. S.V. and L.J. analysed RNA-seq data. M.C. and A.M. analysed TCGA datasets. J.G. performed indel analyses. S.S. analysed clinical data. R.K. performed Western blots and immunoprecipitation experiments. F.Z., E.T. and P.R. contributed reagents. N.P.R. supervised the study.
Competing financial interests
The authors declare no competing financial interests.
References
- 1.Lawrence MS, et al. Mutational heterogeneity in cancer and the search for new cancer-associated genes. Nature. 2013;499:214–218. doi: 10.1038/nature12213. [DOI] [PMC free article] [PubMed] [Google Scholar]
- 2.Chan TA, Wolchok JD, Snyder A. Genetic basis for clinical response to CTLA-4 blockade in melanoma. New England Journal of Medicine. 2015;373:1984–1984. doi: 10.1056/NEJMc1508163. [DOI] [PubMed] [Google Scholar]
- 3.Van Allen EM, et al. Genomic correlates of response to CTLA-4 blockade in metastatic melanoma. Science. 2015;350:207–211. doi: 10.1126/science.aad0095. [DOI] [PMC free article] [PubMed] [Google Scholar]
- 4.Hugo W, et al. Genomic and transcriptomic features of response to anti-PD-1 therapy in metastatic melanoma. Cell. 2016;165:35–44. doi: 10.1016/j.cell.2016.02.065. [DOI] [PMC free article] [PubMed] [Google Scholar]
- 5.Rizvi NA, et al. Mutational landscape determines sensitivity to PD-1 blockade in non–small cell lung cancer. Science. 2015;348:124–128. doi: 10.1126/science.aaa1348. [DOI] [PMC free article] [PubMed] [Google Scholar]
- 6.Tran E, et al. Immunogenicity of somatic mutations in human gastrointestinal cancers. Science. 2015;350:1387–1390. doi: 10.1126/science.aad1253. [DOI] [PMC free article] [PubMed] [Google Scholar]
- 7.Le DT, et al. Mismatch-repair deficiency predicts response of solid tumors to PD-1 blockade. Science. 2017:aan6733. doi: 10.1126/science.aan6733. [DOI] [PMC free article] [PubMed] [Google Scholar]
- 8.Restifo NP, et al. Loss of functional beta2-microglobulin in metastatic melanomas from five patients receiving immunotherapy. Journal of the National Cancer Institute. 1996;88:100–108. doi: 10.1093/jnci/88.2.100. [DOI] [PMC free article] [PubMed] [Google Scholar]
- 9.Zaretsky JM, et al. Mutations associated with acquired resistance to PD-1 blockade in melanoma. New England Journal of Medicine. 2016;375:819–829. doi: 10.1056/NEJMoa1604958. [DOI] [PMC free article] [PubMed] [Google Scholar]
- 10.Wang T, et al. Identification and characterization of essential genes in the human genome. Science. 2015;350:1096–1101. doi: 10.1126/science.aac7041. [DOI] [PMC free article] [PubMed] [Google Scholar]
- 11.Hart T, et al. High-resolution CRISPR screens reveal fitness genes and genotype-specific cancer liabilities. Cell. 2015;163:1515–1526. doi: 10.1016/j.cell.2015.11.015. [DOI] [PubMed] [Google Scholar]
- 12.Shalem O, et al. Genome-scale CRISPR-Cas9 knockout screening in human cells. Science. 2014;343:84–87. doi: 10.1126/science.1247005. [DOI] [PMC free article] [PubMed] [Google Scholar]
- 13.Wang T, Wei JJ, Sabatini DM, Lander ES. Genetic screens in human cells using the CRISPR-Cas9 system. Science. 2014;343:80–84. doi: 10.1126/science.1246981. [DOI] [PMC free article] [PubMed] [Google Scholar]
- 14.Chen S, et al. Genome-wide CRISPR screen in a mouse model of tumor growth and metastasis. Cell. 2015;160:1246–1260. doi: 10.1016/j.cell.2015.02.038. [DOI] [PMC free article] [PubMed] [Google Scholar]
- 15.Rooney MS, Shukla SA, Wu CJ, Getz G, Hacohen N. Molecular and genetic properties of tumors associated with local immune cytolytic activity. Cell. 2015;160:48–61. doi: 10.1016/j.cell.2014.12.033. [DOI] [PMC free article] [PubMed] [Google Scholar]
- 16.Kvistborg P, et al. Anti–CTLA-4 therapy broadens the melanoma-reactive CD8+ T cell response. Science Translational Medicine. 2014;6:254ra128. doi: 10.1126/scitranslmed.3008918. [DOI] [PubMed] [Google Scholar]
- 17.Robbins PF, et al. Single and dual amino acid substitutions in TCR CDRs can enhance antigen-specific T cell functions. The Journal of Immunology. 2008;180:6116–6131. doi: 10.4049/jimmunol.180.9.6116. [DOI] [PMC free article] [PubMed] [Google Scholar]
- 18.Johnson LA, et al. Gene transfer of tumor-reactive TCR confers both high avidity and tumor reactivity to nonreactive peripheral blood mononuclear cells and tumor-infiltrating lymphocytes. The Journal of Immunology. 2006;177:6548–6559. doi: 10.4049/jimmunol.177.9.6548. [DOI] [PMC free article] [PubMed] [Google Scholar]
- 19.Robbins PF, et al. A pilot trial using lymphocytes genetically engineered with an NY-ESO-1–reactive T-cell receptor: long-term follow-up and correlates with response. Clinical Cancer Research. 2015;21:1019–1027. doi: 10.1158/1078-0432.CCR-14-2708. [DOI] [PMC free article] [PubMed] [Google Scholar]
- 20.Spiotto MT, Rowley DA, Schreiber H. Bystander elimination of antigen loss variants in established tumors. Nature medicine. 2004;10:294–298. doi: 10.1038/nm999. [DOI] [PubMed] [Google Scholar]
- 21.Sanjana NE, Shalem O, Zhang F. Improved vectors and genome-wide libraries for CRISPR screening. Nat Meth. 2014;11:783–784. doi: 10.1038/nmeth.3047. [DOI] [PMC free article] [PubMed] [Google Scholar]
- 22.Luo B, et al. Highly parallel identification of essential genes in cancer cells. Proceedings of the National Academy of Sciences. 2008;105:20380–20385. doi: 10.1073/pnas.0810485105. [DOI] [PMC free article] [PubMed] [Google Scholar]
- 23.Indraccolo S, et al. Identification of genes selectively regulated by IFNs in endothelial cells. The Journal of Immunology. 2007;178:1122–1135. doi: 10.4049/jimmunol.178.2.1122. [DOI] [PubMed] [Google Scholar]
- 24.Sanda C, et al. Differential gene induction by type I and type II interferons and their combination. Journal of Interferon & Cytokine Research. 2006;26:462–472. doi: 10.1089/jir.2006.26.462. [DOI] [PubMed] [Google Scholar]
- 25.Viemann D, et al. TNF induces distinct gene expression programs in microvascular and macrovascular human endothelial cells. Journal of Leukocyte Biology. 2006;80:174–185. doi: 10.1189/jlb.0905530. [DOI] [PubMed] [Google Scholar]
- 26.Klijn C, et al. A comprehensive transcriptional portrait of human cancer cell lines. Nat Biotech. 2015;33:306–312. doi: 10.1038/nbt.3080. [DOI] [PubMed] [Google Scholar]
- 27.Kan Z, et al. Diverse somatic mutation patterns and pathway alterations in human cancers. Nature. 2010;466:869–873. doi: 10.1038/nature09208. [DOI] [PubMed] [Google Scholar]
- 28.Roh W, et al. Integrated molecular analysis of tumor biopsies on sequential CTLA-4 and PD-1 blockade reveals markers of response and resistance. Science Translational Medicine. 2017;9:aah3560. doi: 10.1126/scitranslmed.aah3560. [DOI] [PMC free article] [PubMed] [Google Scholar]
- 29.Nathanson T, et al. Somatic mutations and neoepitope homology in melanomas treated with CTLA-4 blockade. Cancer immunology research. 2017;5:84–91. doi: 10.1158/2326-6066.CIR-16-0019. [DOI] [PMC free article] [PubMed] [Google Scholar]
- 30.O’Carroll AM, Lolait SJ, Harris LE, Pope GR. The apelin receptor APJ: journey from an orphan to a multifaceted regulator of homeostasis. Journal of Endocrinology. 2013;219:R13–R35. doi: 10.1530/JOE-13-0227. [DOI] [PubMed] [Google Scholar]
- 31.Stark C, et al. BioGRID: a general repository for interaction datasets. Nucleic Acids Research. 2006;34:D535–D539. doi: 10.1093/nar/gkj109. [DOI] [PMC free article] [PubMed] [Google Scholar]
- 32.Dunn GP, Koebel CM, Schreiber RD. Interferons, immunity and cancer immunoediting. Nat Rev Immunol. 2006;6:836–848. doi: 10.1038/nri1961. [DOI] [PubMed] [Google Scholar]
- 33.Overwijk WW, et al. Tumor regression and autoimmunity after reversal of a functionally tolerant state of self-reactive CD8+ T Cells. The Journal of Experimental Medicine. 2003;198:569–580. doi: 10.1084/jem.20030590. [DOI] [PMC free article] [PubMed] [Google Scholar]
- 34.Wang LX, et al. Low dose decitabine treatment induces CD80 expression in cancer cells and stimulates tumor specific cytotoxic T lymphocyte responses. PLoS ONE. 2013;8:e62924. doi: 10.1371/journal.pone.0062924. [DOI] [PMC free article] [PubMed] [Google Scholar]
- 35.Wrangle J, et al. Alterations of immune response of non-small cell lung cancer with Azacytidine. Oncotarget. 2013;4:2067–2079. doi: 10.18632/oncotarget.1542. [DOI] [PMC free article] [PubMed] [Google Scholar]
- 36.Marrero MB, et al. Direct stimulation of Jak/STAT pathway by the angiotensin II AT1 receptor. Nature. 1995;375:247–250. doi: 10.1038/375247a0. [DOI] [PubMed] [Google Scholar]
- 37.Kidoya H, et al. The apelin/APJ system induces maturation of the tumor vasculature and improves the efficiency of immune therapy. Oncogene. 2012;31:3254–3264. doi: 10.1038/onc.2011.489. [DOI] [PubMed] [Google Scholar]
- 38.Kammertoens T, et al. Tumour ischaemia by interferon-γ resembles physiological blood vessel regression. Nature. 2017;545:98–102. doi: 10.1038/nature22311. [DOI] [PMC free article] [PubMed] [Google Scholar]
- 39.Martin M. Cutadapt removes adapter sequences from high-throughput sequencing reads. 2011;17:10–12. [Google Scholar]
- 40.Langmead B, Trapnell C, Pop M, Salzberg SL. Ultrafast and memory-efficient alignment of short DNA sequences to the human genome. Genome Biology. 2009;10:1–10. doi: 10.1186/gb-2009-10-3-r25. [DOI] [PMC free article] [PubMed] [Google Scholar]
- 41.Wan YW, Allen GI, Liu Z. TCGA2STAT: simple TCGA data access for integrated statistical analysis in R. Bioinformatics. 2016;32:952–954. doi: 10.1093/bioinformatics/btv677. [DOI] [PubMed] [Google Scholar]
- 42.Gao J, et al. Integrative analysis of complex cancer genomics and clinical profiles using the cBioPortal. Science Signaling. 2013;6:pl1-pl1. doi: 10.1126/scisignal.2004088. [DOI] [PMC free article] [PubMed] [Google Scholar]
- 43.Cerami E, et al. The cBio Cancer Genomics Portal: An open platform for exploring multidimensional cancer genomics data. Cancer Discovery. 2012;2:401–404. doi: 10.1158/2159-8290.CD-12-0095. [DOI] [PMC free article] [PubMed] [Google Scholar]
- 44.Bolger AM, Lohse M, Usadel B. Trimmomatic: A flexible trimmer for Illumina sequence data. Bioinformatics. 2014;30:2114–20. doi: 10.1093/bioinformatics/btu170. [DOI] [PMC free article] [PubMed] [Google Scholar]
- 45.Langmead B, Salzberg SL. Fast gapped-read alignment with Bowtie 2. Nat Meth. 2012;9:357–359. doi: 10.1038/nmeth.1923. [DOI] [PMC free article] [PubMed] [Google Scholar]
- 46.Robbins PF, et al. Mining exomic sequencing data to identify mutated antigens recognized by adoptively transferred tumor-reactive T cells. Nature medicine. 2013;19:747–752. doi: 10.1038/nm.3161. [DOI] [PMC free article] [PubMed] [Google Scholar]
- 47.Kim D, et al. TopHat2: accurate alignment of transcriptomes in the presence of insertions, deletions and gene fusions. Genome Biology. 2013;14:R36–R36. doi: 10.1186/gb-2013-14-4-r36. [DOI] [PMC free article] [PubMed] [Google Scholar]
- 48.Trapnell C, et al. Differential gene and transcript expression analysis of RNA-seq experiments with TopHat and Cufflinks. Nature Protocols. 2012;7:562–578. doi: 10.1038/nprot.2012.016. [DOI] [PMC free article] [PubMed] [Google Scholar]
- 49.Noonan FP, et al. Melanoma induction by ultraviolet A but not ultraviolet B radiation requires melanin pigment. Nature Communications. 2012;3:884. doi: 10.1038/ncomms1893. [DOI] [PMC free article] [PubMed] [Google Scholar]
Associated Data
This section collects any data citations, data availability statements, or supplementary materials included in this article.
Supplementary Materials
Data Availability Statement
Data that support the findings of this study are available from the corresponding author upon reasonable request.


