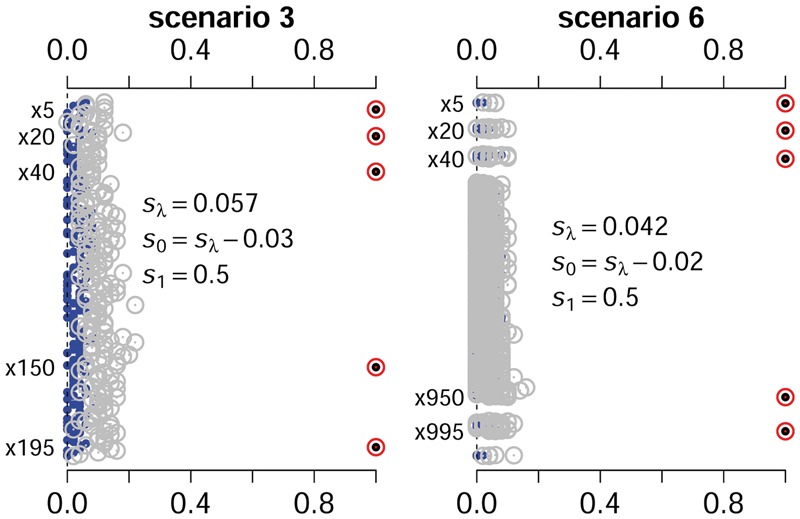
Fig. 3.

The inclusion proportions of the non-zero and zero coefficients in the model over the simulation replicates under scenarios 3 and 6. The points and cycles nearby the right part of the figure represent the proportions of non-zero coefficients for the spike-and-slab lasso Cox model and the lasso Cox model, respectively. The points and grey cycles nearby left axis represent the proportions of zero coefficients for the spike-and-slab lasso Cox model and the lasso Cox model, respectively
