Fig. 5.

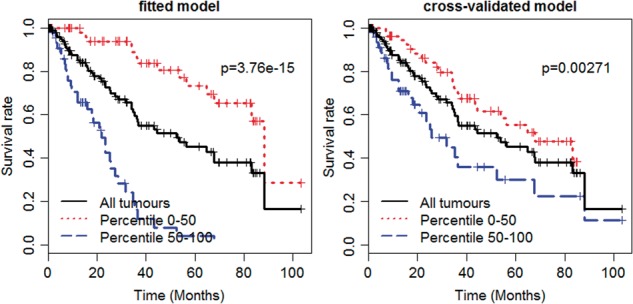
The Kaplan–Meier survival curves of the fitted spike-and-slab lasso Cox model (left panel) and the cross-validated models (right panel) for MDS dataset. The Log-rank tests are performed to compare the two survival curves and obtain P values

The Kaplan–Meier survival curves of the fitted spike-and-slab lasso Cox model (left panel) and the cross-validated models (right panel) for MDS dataset. The Log-rank tests are performed to compare the two survival curves and obtain P values