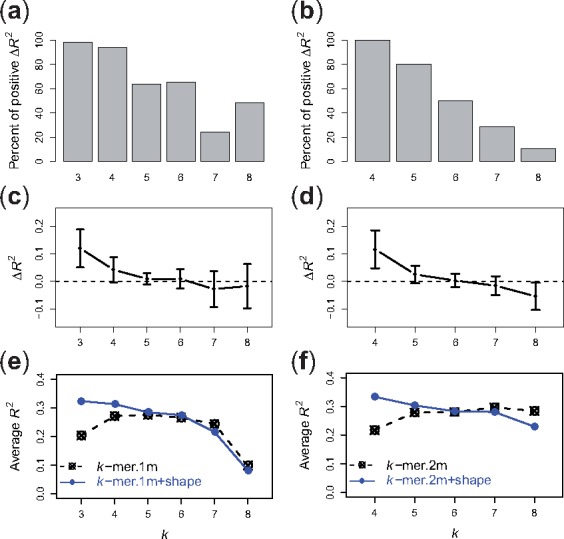
Fig. 4.

Comparison between di-mismatch and di-mismatch + shape models on uPBM datasets. (a) Percent of DREAM5 TF datasets that have higher R2 values using the di-mismatch + shape model than using the di-mismatch model, for and m = 1. (c) Differences of R2 values between the two models, for and m = 1. (e) R2 performance scores of various di-mismatch models (dashed line) and di-mismatch + shape models (solid line), for and m = 1. (b, d, f) Corresponding plots for di-mismatch paramters and m = 2
