Abstract
Purpose
Quantitative, multi-parametric MRI (mpMRI) methods may allow the assessment of renal injury and function in a sensitive and objective manner. This study aimed to evaluate an array of MRI methods that exploit endogenous contrasts including relaxation rates, pool size ratio (PSR) derived from quantitative magnetization transfer (qMT), chemical exchange saturation transfer (CEST), nuclear Overhauser enhancement (NOE) and apparent diffusion coefficient (ADC), for their sensitivity and specificity in detecting abnormal features associated with kidney disease in a murine model of unilateral ureter obstruction (UUO).
Methods
MRI scans were performed in anesthetized C57BL/6N mice 1, 3 or 6 days after UUO at 7T. Paraffin tissue sections were stained with Masson trichrome following MRI.
Results
Compared to contralateral kidneys, the cortices of UUO kidneys showed decreases of relaxation rates R1 and R2, PSR, NOE and ADC. No significant changes in CEST effects were observed for the cortical region of UUO kidneys. The MRI parametric changes in renal cortex are related to tubular cell death, tubular atrophy, tubular dilation, and urine retention, and interstitial fibrosis in the cortex of UUO kidneys.
Conclusion
Measurements of multiple MRI parameters provide comprehensive information about the molecular and cellular changes produced by UUO.
Keywords: Multi-parametric MRI (mpMRI), pool size ratio (PSR), chemical exchange saturation transfer (CEST), nuclear Overhauser enhancement (NOE), apparent diffusion coefficient (ADC), relaxation, unilateral ureter obstruction (UUO), renal injury
INTRODUCTION
Obstructive nephropathy is a primary source of renal impairment in infants and children (1). Animal models of unilateral ureter obstruction (UUO) have enabled the elucidation of the cellular and molecular events involved in obstructive renal injury. Of particular importance to this study, UUO in mice induces serial changes in renal structure and recapitulates key features of tubular dilation, tubular damage, apoptosis, and renal fibrosis (2,3). This model has been extensively studied using histological methods, and previous histological results demonstrate that the range of pathological features observed during UUO is valuable for interpreting changes detected by MRI (4,5).
Non-invasive MRI techniques have been important in evaluating the functional, structural, and metabolic integrity of the compromised kidney in a wide variety of renal pathologies (6–11). The application of non-invasive imaging methods in mice could be useful for the serial evaluation of disease progression, particularly given the importance of mouse models for the biological investigation of renal disease. Numerous studies have used contrast agents to assess renal physiology including blood flow, blood volume or glomerular filtration rates (12–14). However, the use of exogenous MRI contrast agents such as gadolinium-based agents in human studies should be limited because it may trigger the development of nephrogenic systemic fibrosis (15). Therefore, it is valuable to explore endogenous contrast mechanisms to assess renal properties. Previously only limited in vivo studies have applied quantitative MRI measures for evaluating murine renal diseases without contrast agent administration. Previous murine studies have investigated oxygen delivery using blood oxygenation level dependent MRI, along with microstructural features and bulk water transport using diffusion weighted MRI (5,9,16). Changes in renal cortical thickness and corticomedullary contrast via T1, T2, and magnetization transfer (MT) imaging have also been reported for renal diseases (4,17). While single metrics could provide information on one aspect of renal function and injury, multi-parametric MRI (mpMRI) methods may allow a more comprehensive assessment of renal disease in a more sensitive and objective manner. However, to date there have been few mpMRI studies that have investigated murine renal diseases. Thus this study aimed to evaluate an array of MRI methods that exploit endogenous contrasts including T1 and T2 relaxations, pool size ratio (PSR) obtained from quantitative magnetization transfer (qMT) imaging, chemical exchange saturation transfer (CEST) effects, nuclear Overhauser enhancement (NOE) effects, and apparent diffusion coefficient (ADC) obtained using diffusion weighted imaging (DWI), for their sensitivity and specificity in detecting abnormal features associated with kidney disease in a murine model of UUO.
Multiple endogenous MRI contrast mechanisms could provide a variety of information on renal morphology, tissue microstructure and/or composition. For example, the longitudinal and transverse relaxation rates (R1 and R2) of tissues depend on the macromolecular and water contents, and are often sensitive to cellular changes such as apoptosis and urine retention. ADC is sensitive to tissue cellularity (5). MT imaging is (18,19) sensitive to the influence of large and immobile macromolecules distributed within tissue that may change in conditions such as apoptosis and fibrosis (20–22). Simple magnetization transfer ratio (MTR) measures have been applied to assess changes in macromolecular composition (4,23,24). However, the sensitivity and reproducibility of MTR measures can be influenced by various experimental parameters. To increase specificity and sensitivity, qMT methods have been developed to measure intrinsic MT parameters such as PSR (the ratio of the macromolecular proton pool to the free water pool) independent of relaxation and exchange rates (25–27). Kidney disease may also be associated with changes in tissue metabolites such as glucose, glycogen, glycosaminoglycan, and creatine that may exhibit significant chemical exchange saturation transfer (CEST) effects in MRI. CEST has previously been used to study amide proton levels in brain and spinal cord (28–30), tissue pH (31,32) and glycogen deposition (33,34). Recently, this method has been applied to the detection of glucose/glycogen (35) and pH level (36) in kidneys of rodents. In addition, nuclear Overhauser enhancement (NOE) effects, from through-space dipolar couplings of non-exchangeable protons and water, may be detected in upfield CEST Z-spectra and may provide insight into injury and membrane changes (37,38).
The present study aims to explore the potential of the above non-invasive quantitative mpMRI for monitoring structural, cellular, and molecular properties changes of UUO kidneys.
METHODS
Animal preparation
All procedures were approved by the Institutional Animal Care and Use Committee of Vanderbilt University. For unilateral ureteral obstruction, fourteen 8-week-old C57BL/6N mice (Jackson Laboratory) were anesthetized with 2% isoflurane and their left kidneys were exposed through the site of a left flank incision. The ureter was obstructed completely near the renal pelvis using a 4-0 silk tie suture at two points. UUO mice (around 22 grams) were scanned on day 1, day 3 and day 6 following surgery.
In vivo imaging
MRI studies were performed on a 16-cm bore Varian DirectDrive horizontal 7T magnet with a volume coil. Anesthesia was induced and maintained with a 1.5%/98.5% isoflurane/oxygen mixture. A constant body temperature of 37.5 °C was maintained using heated air flow. A gradient echo sequence was employed for T1-weighted imaging (TR = 65 ms; TE = 2.25 ms; flip angle = 35°; number of excitations (NEX) = 8, resolution = 0.2x0.2x1 mm3). A fast spin-echo (FSE) sequence (TR = 5500 ms; RARE-factor = 4, resolution = 0.167x0.167x1 mm3) was used to achieve T2 contrast and calculate R2 (=1/T2) maps (multiple TE at 14, 42, 70, 96, 126 ms).
Quantitative MRI data were obtained from a single 1-mm axial slice incorporating both kidneys. QMT data were collected using a 2D MT-weighted spoiled gradient recalled-echo sequence (TR = 24 ms, flip angle = 7°, resolution = 0.167x0.167x1 mm3, NEX = 16). Gaussian-shaped saturation pulses (flip angles = 220° and 820°, pulse width = 10 ms) were used, with 7 or more different RF offsets between 1 and 80 kHz with a constant logarithmic interval. CEST acquisitions were obtained using a continuous wave (CW) 5.0 s irradiation pulse followed by spin-echo echo-planar-imaging (SE-EPI, 2 segments, TR = 7.5 s, TE = 17.6 ms, matrix of 64×64, resolution = 0.5x0.5x1 mm3). Z-spectra were acquired with RF offsets from −1500 Hz to 1500 Hz with an interval of 50 Hz and a saturation pulse amplitude Bcw = 1.0 μT (Sup. Fig. S1). Reference scans were performed at the beginning and the end of the acquisitions with RF offset = 100 kHz. DW imaging was performed by using the SE-EPI sequence (TR/TE=3000/38 ms, resolution 0.25x0.25x1 mm3), and diffusion gradients (duration/separation = 5/20 ms) were on all three axes with 11 b-values ranging from 0 to 1000 sec/mm2. In addition, two DWI scans were collected, each with an opposite gradient polarity, and averaged to eliminate the presence of gradient cross-terms that may bias ADC measurements. Fat saturation was applied at the RF offset −1042 Hz. An extra navigator echo per readout train was collected without any phase encoding prior to acquisition of the actual image data. This navigator echo was used to correct for phase variations, typically caused by motion. Respiration gating was also applied with 500-ms delay and 100-ms duration to synchronize data acquisition and reduce motion artifacts.
Histology
Kidneys were removed from euthanized mice (normal, and day 1, day 3, and day 6 after UUO surgery) and fixed overnight in 10% buffered formalin. Paraffin tissue sections were stained with Masson trichrome using standard procedures.
Data analysis
All imaging data were analyzed using MATLAB (MathWorks, Natick, MA, USA). All intra-session images used in quantification were coregistered using a rigid registration algorithm based on mutual information (39).
ADC maps were obtained from mono-exponential fitting to the data using only b-values >300 sec/mm2 to reduce intra-voxel incoherent motion (IVIM) effects in kidneys (5). We did not apply bi-exponential fitting using all eleven b-values in this work due to the uncertain impact of the inter-subject physiological variations on the high uncertainty of perfusion parameters (40), especially considering both blood and urine flow in kidneys. Longitudinal relaxation rate R1 was obtained using the dual-angle approach (41), while transverse relaxation rate R2 was obtained using exponential fitting.
Henkelman-Ramani’s model was used in qMT fitting to calculate PSR (25,42). The fitting quality at each pixel was evaluated by the root mean squares (RMS) of the residuals at all RF offsets.
Due to the overlap of peaks, the CEST spectrum was fit to six components over the offset range from −1500 to 1500 Hz. In addition to the four peaks (43) representing amide (3.5 ppm), amine (2.2 ppm), free water (0 ppm), and aliphatic peaks (−3.5 ppm), two additional peaks for hydroxyl (1.2 ppm) (35) and methyl from choline phospholipids (−1.6 ppm) (37,38) were added. In previous studies (35,37), CEST effect at 1.2 ppm RF offset and NOE effect around −1.6 ppm RF offset have shown specificity and sensitivity in detecting abnormal tissues, based on multiple-pool fitting algorithm. CEST Z-spectra were fit (35,37,43) to a 6-pool model consisting of Lorentzian peaks to estimate the magnitudes of CEST effects at 1.2, 2.2 and 3.5 ppm RF offsets, direct saturation (DS) effects at 0.0 ppm RF offset, and NOE effects at −1.6 and −3.5 ppm RF offsets.
High-resolution T1-weighted and T2-weighted images were used to select ROIs (regions of interests) including cortex, outer medulla (OM), inner medulla and papilla (IM+P), and pelvis with obstructed urine (4,13). In T1-weighted and T2-weighted images of murine kidneys, IM and papilla could not be differentiated, the contrast between cortex and outer strip of outer medulla (OSOM) is small, and the contrast between OSOM and inner strip of outer medulla (ISOM) is big (4,13). Pearson correlations between parameters derived from MRI were calculated. Student’s t-tests were used to compare the differences between measurements. FDR (false discovery rate) corrected p < 0.05 was considered significant.
RESULTS
Histological presentation of UUO-induced abnormal features
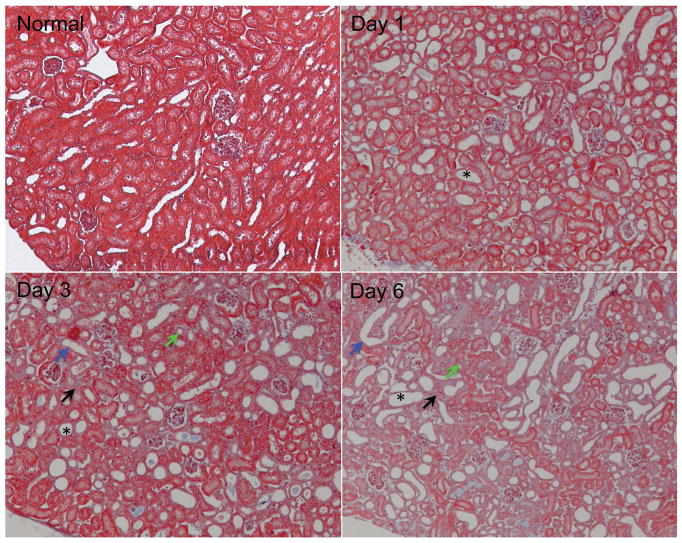
Serial Masson trichrome staining of UUO kidney cortex tissues revealed typical features of UUO renal disease (Fig. 1). The relative volume of kidney occupied by abnormal tubules increased dramatically, as indicated by tubular atrophy, tubular dilation, and destructive and altered morphology of renal tubules. Tubular dilation was observed from day 1. Tubular atrophy and tubules with denuded basement membranes were evident on day 3, while interstitial fibrosis showed up (light blue area indicated by black arrow in Fig. 1) at this stage. Interstitial fibrosis was evident 6 days after UUO, with serious tubular necrosis and pronounced membrane denudation. Previous histologic studies of UUO progression also revealed these abnormal features in the cortex of UUO kidneys (2–4,44).
Figure 1.
Representative histological sections from normal and UUO kidney cortices (Masson trichrome stain). The urine retention and tubular dilation substantially increased, as indicated by destructive morphology of renal tubules (*), tubular atrophy (green arrows), tubules with denuded basement membrane (blue arrows), and interstitial fibrosis (light blue areas indicated by black arrows).
Changes in ADC and relaxation rates
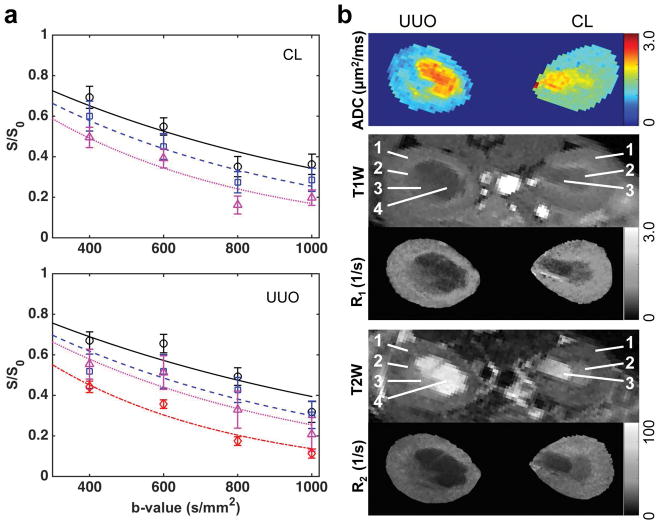
ADC and relaxation rates changed in UUO kidneys after surgery. For example, Figure 2 shows results of a mouse 3 days after UUO. The regional distributions of ADC values were compared intra- and inter- CL and UUO kidneys (Fig. 2a). In CL kidney, ADC values increased continuously from cortex to IM+P (1.247±0.126 (mean and standard deviation across voxels), 1.518±0.212 and 1.838±0.283 μm2/ms for cortex, OM, and IM+P respectively). In UUO kidney, although the regional trend of ADC values was maintained, ADC values decreased compared to CL kidney (0.949±0.130, 1.093±0.198 and 1.219±0.281 μm2/ms for cortex, OM, and IM+P respectively). Differences in changes of relaxation rates between CL and UUO kidneys were also observed, with UUO showing lower regional R1 and R2 (Fig. 2b). The pelvis expanded with collected urine after surgery, and showed hypointense signals in T1-weighted images, hyperintense signals in T2-weighted images, very high ADC values (2.337±0.235 μm2/ms, across voxels), and very long T1 (2.597±0.474 s) and T2 (97.4±11.6 ms) relaxation times. The cortical differences and their distributions between CL and UUO kidneys are compared in Figure 3. Compared to what was observed in CL cortex, regional mean ADC, R1 and R2 decreased in UUO cortex at this stage (Fig. 3).
Figure 2.
Representative mapping of ADC and relaxation. (a) ADC from fitting. The regional signals of cortex, OM, IM+P, and pelvis are indicated by circles, squares, triangles, and diamonds, respectively. The curves represent the mono-exponential fitting results. Only b-values > 300 s/mm2 were used in fitting. CL-contralateral, UUO-unilateral ureter obstruction. (b) ADC, R1 and R2 maps. T1W: T1-weighted, T2W: T2-weighted. ROIs were identified in T1W and T2W images. 1-cortex, 2-OM, 3-IM+P, 4-pelvis with obstructed urine. Data were from a mouse 3 days after UUO.
Figure 3.
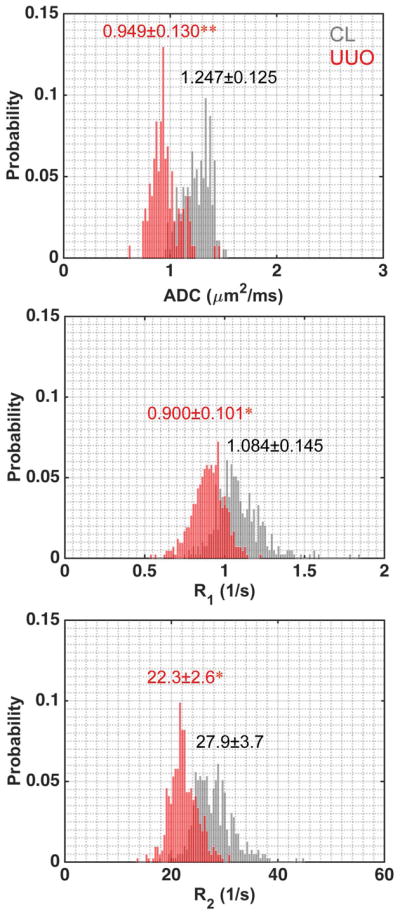
Comparison of representative cortical distributions of measured MRI parameters of CL and UUO kidneys. Cortical Mean ± SD (standard deviation) values across voxels were shown, with CL in gray and UUO in red. *p < 0.05, and **p < 0.01. Data were from a mouse 3 days after UUO.
QMT detected PSR changes in UUO kidney
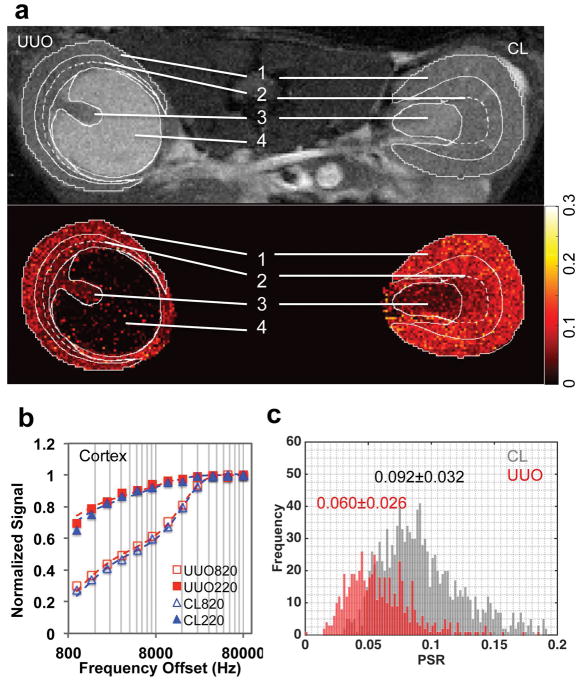
With MT saturation, IM+P appeared to be brighter than OM and cortex in CL kidney, while the pelvis showed hyperintense signal in UUO kidney after surgery (example shown for a mouse 6 days after UUO surgery, Fig. 4a and Sup. Fig. S2). Compared to the PSR map of CL kidney (Fig. 4a), UUO kidney showed a low PSR region for pelvis with obstructed urine. Figure 4b showed the fitting of the data obtained from selected voxels in CL and UUO cortices at different MT saturation powers (θsat = 220° and 820°) and 12 frequency offsets. UUO kidney showed decrease of PSR in renal cortex (Figs. 4a,c), compared to CL kidney. In CL kidney, PSR values decreased continuously from cortex to IM+P (0.102±0.019, 0.083±0.025 and 0.036±0.014 for cortex, OM, and IM+P respectively). In UUO kidney, the regional trend of PSR values was maintained, and PSR values decreased significantly in cortex and OM (0.057±0.014, 0.048±0.014 and 0.027±0.013 for cortex, OM, and IM+P respectively), compared to those of CL kidney.
Figure 4.
QMT imaging. (a) Image with magnetization transfer contrast (MTC) and PSR map. 1-cortex, 2-OM, 3-IM+P, 4-pelvis with obstructed urine. ROIs were defined in the respective T1-weighted image, and then applied to MTC image and PSR map (solid white outlines). The contrast between OSOM and ISOM is big, indicated by the dashed white outlines. (b) The fitting of the model to in vivo MT data of cortical tissues in the CL and UUO kidneys at two flip angles of 820° and 220°. Curves were normalized to maximum intensity. (c) Cortical PSR distributions across voxels in CL (gray) and UUO (red) kidneys, with regional Mean ± SD values of PSR shown. Data were from a mouse 6 days after UUO.
Z-spectra revealed changes in UUO kidneys
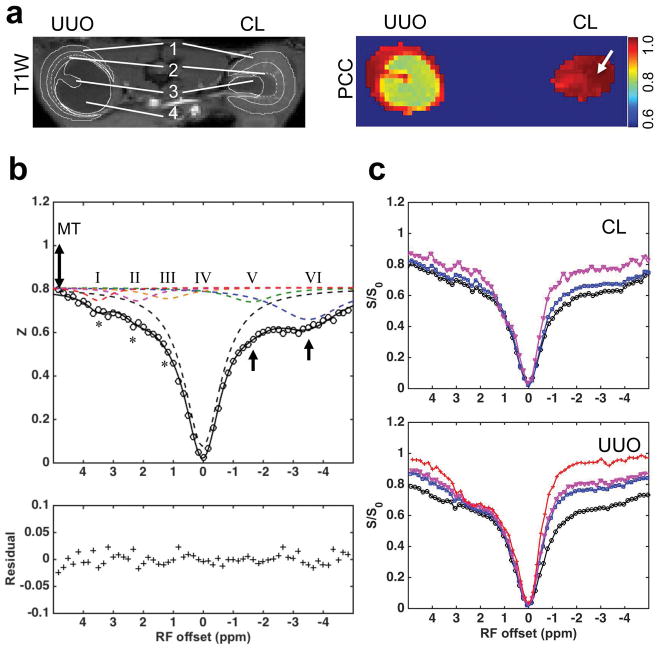
The characteristic regional features of Z-spectra for CL and UUO kidneys are shown in Figure 5 (example shown for a mouse 6 days after UUO surgery). The characteristic regular cortical Z-spectrum of CL kidney is shown in Figure 5b. CEST effects were observed at RF offsets around 1.2, 2.2 and 3.5 ppm (asterisks), which are generally from exchangeable hydroxyl (pool III), amine (pool II) and amide (pool I) protons in mobile molecules, respectively. Non-CEST features were also apparent in the Z-spectra of cortex in CL kidney, including contributions from semi-solid MT effects and possible intramolecular and intermolecular NOEs (pools V and VI in Fig. 5b). OM spectra differed from those of cortex, and IM+P showed much lower NOE and semi-solid MT effects than OM and cortex (Fig. 5c) in CL kidney.
Figure 5.
Renal Z-spectroscopic features of UUO. (a) T1-weighted image and PCC map showing Pearson correlation coefficient between Z-spectra at each voxel. The averaged Z-spectrum of CL cortex was selected as the seed for correlation analysis. ROIs were defined in T1-weighted image (solid white outlines). 1-cortex, 2-OM, 3-IM+P, 4-pelvis with obstructed urine. The contrast between OSOM and ISOM is big, indicated by the dashed white outlines. (b) Characteristic spectroscopic features of normal cortical tissue. Asterisks indicate CEST effects, 1-head arrows indicate NOE effects, and 2-head arrow indicates semi-solid MT effect. Pool I, II, III, IV, V and VI were separated from 6-peak Lorentzian fitting. (c) Comparison of the regional spectra in UUO and CL kidneys. Black circles: cortex, blue squares: OM, purple triangles: IM+P, and red crosses: pelvis with obstructed urine. Data were from a mouse 6 days after UUO.
CEST, NOE and solid MT effects were also observed in the averaged regional Z-spectra of cortex and OM in UUO kidneys (Fig. 5c and Table 1). The Z-spectra became more asymmetric from cortex to IM+P (Fig. 5c), and pelvis showed the most asymmetric Z-spectrum. While the regional signals were unaltered from 1 to 3 ppm RF offset, signals from 3 to 5 ppm, and from −5 to −1 ppm RF offset were higher in OM, IM+P and pelvis of UUO kidney. Model fitting revealed distinct regional changes of six pool amplitudes (Table 1). UUO cortex exhibited significant decreased amplitudes for pools V and VI (NOE effects) but increased amplitude for pool IV (DS effect) compared to those of CL cortex. However, it did not show evident amplitude changes for pools I–III (CEST effects). In contrast, OM, IM+P, and pelvis of UUO kidney showed significant amplitude changes for pools I–VI compared to those of CL tissues (Table 1).
Table 1.
Resolved pool amplitudes of regional spectra
| Pool RF offset |
I (3.5 ppm) | II (2.2 ppm) | III (1.2 ppm) | IV (0 ppm) | V (−1.6 ppm) | VI (−3.5 ppm) | |
|---|---|---|---|---|---|---|---|
| CL Kidney | Cortex | 0.0597 | 0.0613 | 0.0506 | 0.7133 | 0.0960 | 0.1413 |
| OM | 0.0670 | 0.0610 | 0.0566 | 0.7499 | 0.0571 | 0.1394 | |
| IM+P | 0.0583 | 0.0212 | 0.1066 | 0.7770 | 0.0349 | 0.0873 | |
| UUO Kidney | Cortex | 0.0587 | 0.0614 | 0.0513 | 0.7225* | 0.0647* | 0.0944* |
| OM | 0.0596* | 0.0758* | 0.0744* | 0.7559* | 0.0494* | 0.0901* | |
| IM+P | 0.0527* | 0.1297* | 0.1282* | 0.8474* | 0.0123* | 0.0693* | |
| Pelvis | 0.0452* | 0.1975* | 0.2655* | 0.9262* | 0.0136* | 0.0157* | |
Note: The pool amplitudes were from 6-pool model. CL – contralateral, UUO – unilateral ureter obstruction. Values for CL kidneys were used as control. The regional values of cortex, OM and IM+P in UUO kidney were compared to the related control values in CL kidney. The values of pelvis with obstructed urine in UUO kidney were compared to related values of tissues in CL kidney.
p < 0.05.
A pixel-by-pixel correlation analysis of the Z-spectra was used to evaluate regional differences in molecular composition (Fig. 5a). With the averaged Z-spectrum of kidney tissue selected as a reference, a correlation map was obtained for the global comparison of the features from Z-spectra. While the pixels in OM and cortex regions showed Pearson correlation coefficients (PCC) values close to 1, the regions for IM+P and pelvis showed lower PCC values (Fig. 5a), indicating quite different composition. These regions exhibited weaker correlation to kidney tissue perhaps because of higher levels of urine, which has much lower MT and NOE, but higher CEST effects from fast exchanging pools than those of kidney tissue (Fig. 5c).
Intra-subject multi-parametric mapping of UUO
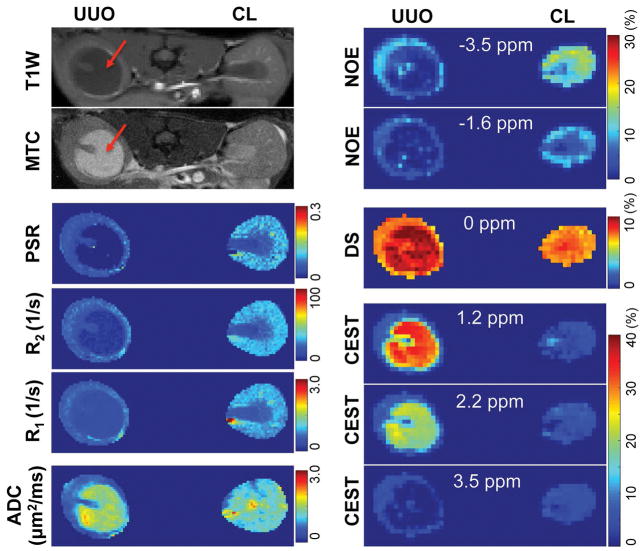
Figure 6 shows maps of the 6 peak amplitudes (as percentages) from pixel-by-pixel fitting of Z-spectra along with other MRI measures. On day 6 after surgery, all the MRI measures of the CL kidney appeared to be normal (Fig. 6). In contrast, the MRI measures of the UUO kidney showed evident changes. The expanded pelvis on the UUO side showed significantly smaller NOE effects, bigger DS effects, bigger CEST effects for fast exchanging pools (1.2 and 2.2 ppm RF offsets), lower CEST effects for slowly exchanging pools (3.5 ppm RF offset), lower relaxation rates, lower PSR and higher ADC than those of renal tissues. The cortical regions of UUO kidney also showed changes in most MRI measures except for CEST effects, compared to those of CL kidney.
Figure 6.
Multi-parametric maps of UUO mouse on day 6 after surgery. T1-weighted (T1W) and magnetization transfer contrast (MTC) images showed hypointensity and hyperintensity respectively for the pelvis with obstructed urine in UUO kidney (red arrows). NOE, DS and CEST effects were peak amplitudes from the fitting of CEST Z-spectra. RF offsets for NOE, DS, and CEST effects were indicated.
Unilateral cortical changes of multiple MRI measures
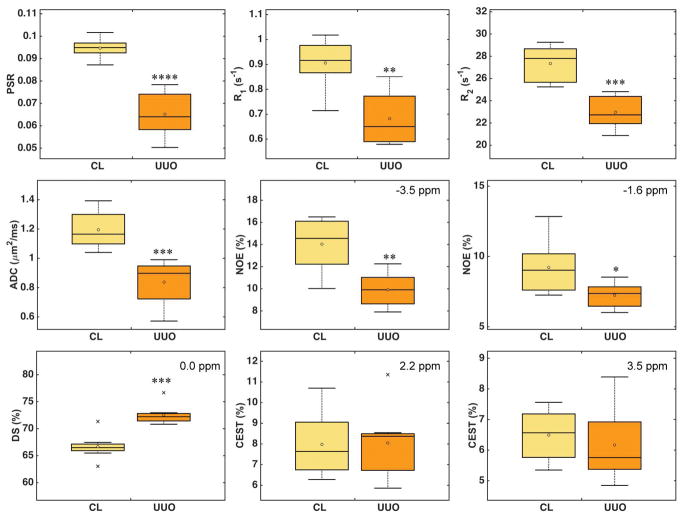
The cortical differences between UUO and CL kidneys day 6 after surgery (N=8) are compared in Figure 7 and Supporting Figure S3. PSR, R1, R2, ADC, and NOE showed significant decreases, while DS showed significant increase in UUO kidneys. Among all these MRI parameters, PSR showed the highest sensitivity, based on pairwise comparisons. Measures of ADC, R2 and DS were more sensitive than R1 and NOE in detecting UUO-associated changes. CEST effects increased slightly for fast exchanging pools (1.2 and 2.2 ppm RF offsets) and decreased for slowly exchanging pools (3.5 ppm RF offset) between the cortices of UUO and CL kidneys. However, these changes were not significant.
Figure 7.
Cortical MRI measures 6 days after UUO surgery. Boxplots show the comparison between CL and UUO kidneys. Middle lines indicate median and circles indicate mean values across subjects (N=8). RF offsets for NOE, DS, and CEST effects were indicated. *p < 0.05, **p < 5x10⁻³, ***p < 5x10⁻⁴, and ****p < 5x10⁻⁵ vs. CL measures.
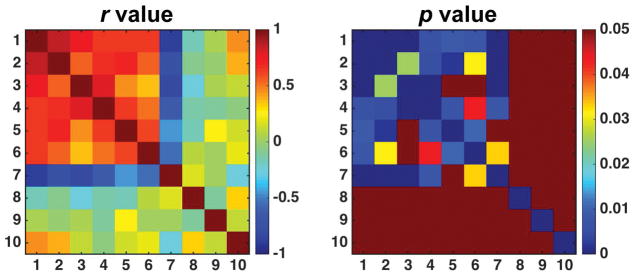
The correlations between cortical changes in different parameters were compared (Fig. 8). The cortical changes in PSR showed strong negative correlation with changes in DS (r = −0.899, p < 1x10⁻⁵), strong positive correlation with changes in R1 (r = 0.845, p < 1x10⁻⁴) and R2 (r = 0.759, p < 1x10⁻³), moderate positive correlations with NOE variations at −3.5 and −1.6 ppm RF offsets (r = 0.632 and r = 0.634 respectively, p < 0.01), and moderate positive correlation with ADC changes (r = 0.648, p < 0.01). No significant correlations were observed between cortical changes in CEST effects and other MRI parameters.
Figure 8.
Correlations between cortical changes in MRI parameters 6 days after UUO surgery. Correlation coefficient r is shown with respective p value. Note that p value in dark red is not significant (p ≥ 0.05). In the r and p plots, 1-PSR, 2-R1, 3-R2, 4-ADC, 5-NOE (-3.5 ppm), 6-NOE (-1.6 ppm), 7-DS (0.0 ppm), 8-CEST (1.2 ppm), 9-CEST (2.2 ppm), 10-CEST (3.5 ppm).
Longitudinal cortical changes of selected MRI parameters
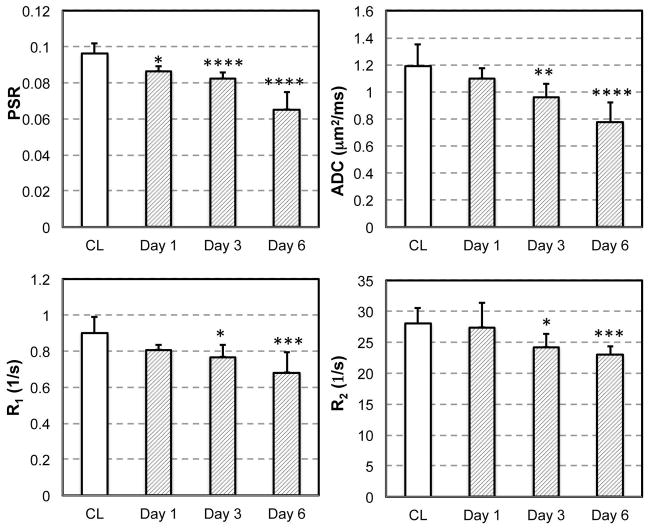
Because no evident changes were observed for CEST effects in the cortex of UUO kidneys on day 6 after surgery (Figs. 6 and 7), we did not apply CEST imaging of UUO mice at day 1 and day 3. Serial quantitative MRI imaging of UUO mice (day 1, 3 and 6) revealed dynamic cortical changes from day 1 to day 6 after surgery (Fig. 9). The cortical areas of CL kidneys remained unaltered over time, and were used as controls for comparison. On day 1, PSR showed evident changes in UUO cortex. On day 3, while PSR kept decreasing, the values of ADC, R1 and R2 also decreased significantly. Among these measures, PSR showed the highest sensitivity for detecting cortical changes on day 1 and 3 after the surgery. The MRI measures of PSR, ADC, R1 and R2 were all highly sensitive to the cortical changes of UUO kidneys on day 6. Longitudinally, PSR correlated significantly (p < 0.05) with other parameters such as R1, R2, and ADC, with correlation coefficients 0.838, 0.712, and 0.705 respectively.
Figure 9.
Temporal variations of selected MRI measures. CL cortical measures showed consistent values over time and were used as controls for comparison. *p < 0.05, **p < 1x10⁻², ***p < 1x10⁻³, and ****p < 1x10⁻⁴.
DISCUSSION
Regional distributions and correlations of changes in MRI parameters
The gradient of MRI parameters from cortex, OM to papilla (Fig. 6) is a consequence of distinct, ordered and directional microstructural differences, including vessels and tubules in kidneys. PSR is an indirect marker of macromolecular content of different regions in kidney, which is inversely related to tissue water content and T1, so it has a strong negative correlation with DS effect (Fig. 8). Relaxation rates usually depend directly on concentration of macromolecules such as proteins, so R1 and PSR are highly correlated (r = 0.845, p < 1x10⁻⁴). Similarly, R2 decreases as PSR decreases. The ADC value reflects the regional diffusivity of water, and is sensitive to cell density, and the dimensions and permeability of water compartments. Increased interstitial fibrosis, tubular necrosis and restricted urinary flow may be the causes of the observed ADC reduction. The positive correlations between ADC and PSR and R1 may indicate a reduction in cell permeability due to tubular atrophy with decreased overall macromolecular content. NOE effects are in general from the contents of cellular compounds such as macromolecules with aliphatic protons, phospholipids containing choline head groups (37,45), and mobile membrane proteins having α protons (43). The regional distributions of NOE effects (Fig. 6) in CL are related to the regional tissue and tubular organizations in normal kidneys, and are positively correlated with PSR. The cortical NOE decrease in UUO also follows the decrease in PSR, potentially reflects the tubular cell membrane denudation. This is consistent with previous studies that show NOE is strongly correlated with PSR or MTR (29,38). CEST effects are reported to be sensitive to the presence of mobile proteins/peptides or the by-products of amino acids from degradation of macromolecules. CEST effects are not significantly correlated with PSR changes after UUO, which indicates that they may be from different sources.
Interpretation of abnormal renal properties using MRI parameters
MRI measures are indirect indicators of tissue pathology, so considerations of the signal source and possible contributors are critical for the interpretation of the findings. Anatomically, the pelvis expanded while the cortex and OM shrank and urine retention became more serious as UUO progressed (4,44). In the pelvis of UUO kidneys, the high DS, and low R1, R2, PSR and NOE, and high ADC indicate low cellularity, low compositions of macromolecules, and less restricted water diffusion. The high CEST effects around 1.2 and 2.2 ppm RF offsets likely indicate urine accumulation in pelvis, given the fact that CEST effects from 1 to 3 ppm RF offset are associated with the constituents in urine (i.e. urea, creatine, and amino acid, etc.).
In the cortical region of UUO kidney, the PSR became lower compared to that in CL kidney on day 1, and showed a longitudinal decrease thereafter (Fig. 9). Decreased PSR indicates reduced macromolecular content. This may be related to the tubular dilation starting on day 1 and the subsequent apoptosis and tubular atrophy of local tissues in the UUO. Apoptosis produces changes at the molecular and cellular levels, including the breakdown of membranes and proteins. Urine retention and tubular dilation increases cortical water content. T2 prolongation could be related to a considerable increase in the extracellular water space, which presumably expands due to tubular dilation and atrophy. R1 decreases as the PSR decreases (r = 0.855), as the concentration of macromolecules decreases. Histological results (Fig. 1) indicate several factors that may contribute to the longitudinal ADC decrease. The ADC decrease on day 1 could be associated with obstructed urinary flow (Fig. 1) and decreased renal perfusion including tubular uptake (44), if ADC includes the effects of bulk fluid incoherent motions. The decrease of ADC from day 3 to day 6 could be due to both fibrosis (Fig. 1) and a further reduction of renal perfusion, when tubular necrosis became more serious. R1, R2, PSR and ADC values of the UUO cortex significantly differed from those of CL kidneys on UUO day 6, indicating severe cortical changes by day 6 after surgery. These observations underscore the importance of mpMRI for the study of pathogenesis after UUO.
Sensitivity and specificity of PSR measure
We have shown that several MRI parameters have high sensitivity for monitoring urine obstructed in the pelvis of UUO kidney. PSR, R1, R2, ADC, NOE and DS all showed significant cortical changes on day 6. However, CEST effects come from a relatively small portion of exchanging protons, and the sensitivities were relatively low for detecting cortical changes after UUO, though evident increases of CEST effects were observed for pelvis, IM+P, and OM regions of UUO kidneys on day 6. R1, R2, ADC and PSR were all sensitive for detecting cortical changes on UUO day 3, the middle stage during UUO progression.
Among MRI parameters measured, PSR showed the highest sensitivity for detecting cortical changes (Figs. 7 and 9). PSR is known to be a specific and reliable indicator of the content of macromolecules (21,46). PSR showed significant changes on day 1 before other measures, suggesting that PSR may provide an early biomarker of UUO induced pathology (Fig. 9). Tubular enlargement was the first abnormal cortical event (Fig. 1), associated with urine retention after UUO. This caused a significant decrease of PSR on day 1. Tubular membrane denuding and tubular atrophy became evident from day 1 to day 3 (Fig. 1). These events caused PSR to decrease further. Fibrosis appeared on day 3, with tubular atrophy, membrane denudation, and urine retention becoming more serious from day 3 to day 6. The net effect of these changes caused an even further decrease of PSR. From these findings, PSR may be the preferred imaging matric to reveal the abnormal cortical changes in early stages of UUO progression.
Advantages of mpMRI in investigating kidney disease
In principle, different MRI parameters reflect different aspects of tissue abnormalities. PSR reflects the level of macromolecules. CEST could be sensitive to metabolites. NOE is associated with the composition of mobile macromolecules such as membrane proteins and lipids. R1 and R2 provide the best regional contrasts in murine kidneys among all the measures (Fig. 6), and they also correlate with PSR for evaluating macromolecular level (Fig. 8). The combination of multiple MRI parameters provides comprehensive spatial and longitudinal information on renal morphology, tissue microstructure, and composition.
The observed differential multiple parametric patterns during UUO progression highlighted the fact that each stage exhibited its predominant pathological events and severity (Figs. 1 and 9). The number of MRI parameters with significant variations can reveal the complications of kidney disease. The significant cortical decrease of PSR alone on day 1 may indicate single abnormal event (tubular enlargement with urine accumulation). The detected changes in more parameters (PSR, R1, R2 and ADC) on day 3 are caused by additional pathological events (tubular atrophy and fibrosis, etc.). In addition, the severity of UUO progression can be indicated by the significance of the parametric changes (Fig. 9). Importantly, a combination of MRI measures enables great sensitivity for detecting changes in the cellular and molecular composition of kidneys, and provides comprehensive measures to evaluate the stages of kidney disease.
Challenges in quantitative MRI of murine kidney at high field
Even though the higher SNR available at high fields permits high resolution imaging, partial volume averaging still may have an impact on regional quantification in small mouse kidneys. In the renal cortex, measured changes in MRI parameters in each voxel reflect the net effect of a host of biological changes including tubular dilation, urine retention, denuded basement membranes, tubular atrophy, proliferation of myofibroblasts, and fibrosis (2,5). For example, tubular dilation, denudation of the basement membrane and tubular atrophy may decrease PSR values, while fibrosis may have the opposite effect, but only their integrated effects are detected. At different stages during the progression of kidney disease, specific events may dominate, and result in a decrease or increase of PSR.
CONCLUSIONS
Our results demonstrate that mpMRI measurements are reliable and sensitive for detecting changes in tissue properties in UUO kidneys. While PSR is more specific for characterizing urine retention, tubular atrophy and denuded basement membranes, ADC is more sensitive to urinary flow and fibrosis. The combination of qMT imaging with other MRI methods such as relaxation, DWI and CEST provides complementary information about the pathophysiological basis of UUO progression.
Supplementary Material
Supporting Figure S1. Representative CEST images collected at different RF offsets.
Supporting Figure S2. Representative raw qMT data.
Supporting Figure S3. Comparison of cortical CEST effects at 1.2 ppm RF offset between CL and UUO kidneys 6 days after UUO surgery (N=8).
Acknowledgments
We thank Mr. Fuxue Xin, Mr. Ken Wilkens, Dr. Daniel Colvin, Mr. Jarrod True, and Dr. Mark D. Does of the Vanderbilt University Institute of Imaging Science. This research is supported by NIH/NIDDK grants DK79341 and DK114809 for Vanderbilt O’Brien Mouse Kidney Physiology and Disease Center.
Footnotes
Additional supporting information may be found in the online version of this article.
References
- 1.Collins AJ, Foley R, Herzog C, Chavers B, Gilbertson D, Ishani A, Kasiske B, Liu J, Mau LW, McBean M, Murray A, St Peter W, Xue J, Fan Q, Guo H, Li Q, Li S, Li S, Peng Y, Qiu Y, Roberts T, Skeans M, Snyder J, Solid C, Wang C, Weinhandl E, Zaun D, Zhang R, Arko C, Chen SC, Dalleska F, Daniels F, Dunning S, Ebben J, Frazier E, Hanzlik C, Johnson R, Sheets D, Wang X, Forrest B, Constantini E, Everson S, Eggers P, Agodoa L. Excerpts from the United States Renal Data System 2007 annual data report. Am J Kidney Dis. 2008;51(1 Suppl 1):S1–320. doi: 10.1053/j.ajkd.2007.11.001. [DOI] [PubMed] [Google Scholar]
- 2.Cochrane AL, Kett MM, Samuel CS, Campanale NV, Anderson WP, Hume DA, Little MH, Bertram JF, Ricardo SD. Renal structural and functional repair in a mouse model of reversal of ureteral obstruction. J Am Soc Nephrol. 2005;16(12):3623–3630. doi: 10.1681/ASN.2004090771. [DOI] [PubMed] [Google Scholar]
- 3.Pat B, Yang T, Kong C, Watters D, Johnson DW, Gobe G. Activation of ERK in renal fibrosis after unilateral ureteral obstruction: modulation by antioxidants. Kidney Int. 2005;67(3):931–943. doi: 10.1111/j.1523-1755.2005.00157.x. [DOI] [PubMed] [Google Scholar]
- 4.Wang F, Jiang R, Takahashi K, Gore J, Harris RC, Takahashi T, Quarles CC. Longitudinal assessment of mouse renal injury using high-resolution anatomic and magnetization transfer MR imaging. Magnetic resonance imaging. 2014;32(9):1125–1132. doi: 10.1016/j.mri.2014.07.012. [DOI] [PMC free article] [PubMed] [Google Scholar]
- 5.Togao O, Doi S, Kuro-o M, Masaki T, Yorioka N, Takahashi M. Assessment of renal fibrosis with diffusion-weighted MR imaging: study with murine model of unilateral ureteral obstruction. Radiology. 2010;255(3):772–780. doi: 10.1148/radiol.10091735. [DOI] [PMC free article] [PubMed] [Google Scholar]
- 6.Michaely HJ, Sourbron S, Dietrich O, Attenberger U, Reiser MF, Schoenberg SO. Functional renal MR imaging: an overview. Abdom Imaging. 2007;32(6):758–771. doi: 10.1007/s00261-006-9150-8. [DOI] [PubMed] [Google Scholar]
- 7.Takahashi T, Wang F, Quarles CC. Current MRI techniques for the assessment of renal disease. Current opinion in nephrology and hypertension. 2015;24(3):217–223. doi: 10.1097/MNH.0000000000000122. [DOI] [PMC free article] [PubMed] [Google Scholar]
- 8.Xie L, Bennett KM, Liu C, Johnson GA, Zhang JL, Lee VS. MRI tools for assessment of microstructure and nephron function of the kidney. Am J Physiol Renal Physiol. 2016;311(6):F1109–F1124. doi: 10.1152/ajprenal.00134.2016. [DOI] [PMC free article] [PubMed] [Google Scholar]
- 9.Niendorf T, Pohlmann A, Arakelyan K, Flemming B, Cantow K, Hentschel J, Grosenick D, Ladwig M, Reimann H, Klix S, Waiczies S, Seeliger E. How bold is blood oxygenation level-dependent (BOLD) magnetic resonance imaging of the kidney? Opportunities, challenges and future directions. Acta Physiol. 2015;213(1):19–38. doi: 10.1111/apha.12393. [DOI] [PubMed] [Google Scholar]
- 10.Pohlmann A, Arakelyan K, Hentschel J, Cantow K, Flemming B, Ladwig M, Waiczies S, Seeliger E, Niendorf T. Detailing the relation between renal T2* and renal tissue pO2 using an integrated approach of parametric magnetic resonance imaging and invasive physiological measurements. Invest Radiol. 2014;49(8):547–560. doi: 10.1097/RLI.0000000000000054. [DOI] [PubMed] [Google Scholar]
- 11.Zhang JL, Rusinek H, Chandarana H, Lee VS. Functional MRI of the kidneys. J Magn Reson Imaging. 2013;37(2):282–293. doi: 10.1002/jmri.23717. [DOI] [PMC free article] [PubMed] [Google Scholar]
- 12.Kobayashi H, Jo SK, Kawamoto S, Yasuda H, Hu X, Knopp MV, Brechbiel MW, Choyke PL, Star RA. Polyamine dendrimer-based MRI contrast agents for functional kidney imaging to diagnose acute renal failure. J Magn Reson Imaging. 2004;20(3):512–518. doi: 10.1002/jmri.20147. [DOI] [PubMed] [Google Scholar]
- 13.Wang F, Jiang RT, Tantawy MN, Borza DB, Takahashi K, Gore JC, Harris RC, Takahashi T, Quarles CC. Repeatability and sensitivity of high resolution blood volume mapping in mouse kidney disease. J Magn Reson Imaging. 2014;39(4):866–871. doi: 10.1002/jmri.24242. [DOI] [PMC free article] [PubMed] [Google Scholar]
- 14.Dear JW, Kobayashi H, Brechbiel MW, Star RA. Imaging acute renal failure with polyamine dendrimer-based MRI contrast agents. Nephron Clin Pract. 2006;103(2):c45–49. doi: 10.1159/000090608. [DOI] [PubMed] [Google Scholar]
- 15.Perazella MA. Current status of gadolinium toxicity in patients with kidney disease. Clin J Am Soc Nephrol. 2009;4(2):461–469. doi: 10.2215/CJN.06011108. [DOI] [PubMed] [Google Scholar]
- 16.Prasad P, Li LP, Halter S, Cabray J, Ye M, Batlle D. Evaluation of renal hypoxia in diabetic mice by BOLD MRI. Invest Radiol. 2010;45(12):819–822. doi: 10.1097/RLI.0b013e3181ec9b02. [DOI] [PMC free article] [PubMed] [Google Scholar]
- 17.Mounier-Vehier C, Lions C, Devos P, Jaboureck O, Willoteaux S, Carre A, Beregi JP. Cortical thickness: An early morphological marker of atherosclerotic renal disease. Kidney Int. 2002;61(2):591–598. doi: 10.1046/j.1523-1755.2002.00167.x. [DOI] [PubMed] [Google Scholar]
- 18.Wolff SD, Balaban RS. Magnetization transfer contrast (MTC) and tissue water proton relaxation in vivo. Magn Reson Med. 1989;10(1):135–144. doi: 10.1002/mrm.1910100113. [DOI] [PubMed] [Google Scholar]
- 19.Henkelman RM, Stanisz GJ, Graham SJ. Magnetization transfer in MRI: a review. NMR in biomedicine. 2001;14(2):57–64. doi: 10.1002/nbm.683. [DOI] [PubMed] [Google Scholar]
- 20.Adler J, Swanson SD, Schmiedlin-Ren P, Higgins PD, Golembeski CP, Polydorides AD, McKenna BJ, Hussain HK, Verrot TM, Zimmermann EM. Magnetization transfer helps detect intestinal fibrosis in an animal model of Crohn disease. Radiology. 2011;259(1):127–135. doi: 10.1148/radiol.10091648. [DOI] [PMC free article] [PubMed] [Google Scholar]
- 21.Wang F, Li K, Mishra A, Gochberg D, Min Chen L, Gore JC. Longitudinal assessment of spinal cord injuries in nonhuman primates with quantitative magnetization transfer. Magn Reson Med. 2016;75(4):1685–1696. doi: 10.1002/mrm.25725. [DOI] [PMC free article] [PubMed] [Google Scholar]
- 22.Bailey C, Desmond KL, Czarnota GJ, Stanisz GJ. Quantitative magnetization transfer studies of apoptotic cell death. Magn Reson Med. 2011;66(1):264–269. doi: 10.1002/mrm.22820. [DOI] [PubMed] [Google Scholar]
- 23.Bosch CS, Ackerman JJH, Tilton RG, Shalwitz RA. In vivo NMR imaging and spectroscopic investigation of renal pathology in lean and obese rat kidneys. Magn Reson Med. 1993;29(3):335–344. doi: 10.1002/mrm.1910290309. [DOI] [PubMed] [Google Scholar]
- 24.Kline TL, Irazabal MV, Ebrahimi B, Hopp K, Udoji KN, Warner JD, Korfiatis P, Mishra PK, Macura SI, Venkatesh SK, Lerman LO, Harris PC, Torres VE, King BF, Erickson BJ. Utilizing magnetization transfer imaging to investigate tissue remodeling in a murine model of autosomal dominant polycystic kidney disease. Magn Reson Med. 2016;75(4):1466–1473. doi: 10.1002/mrm.25701. [DOI] [PMC free article] [PubMed] [Google Scholar]
- 25.Henkelman RM, Huang X, Xiang QS, Stanisz GJ, Swanson SD, Bronskill MJ. Quantitative interpretation of magnetization transfer. Magn Reson Med. 1993;29(6):759–766. doi: 10.1002/mrm.1910290607. [DOI] [PubMed] [Google Scholar]
- 26.Sled JG, Pike GB. Quantitative interpretation of magnetization transfer in spoiled gradient echo MRI sequences. J Magn Reson. 2000;145(1):24–36. doi: 10.1006/jmre.2000.2059. [DOI] [PubMed] [Google Scholar]
- 27.Gochberg DF, Gore JC. Quantitative imaging of magnetization transfer using an inversion recovery sequence. Magn Reson Med. 2003;49(3):501–505. doi: 10.1002/mrm.10386. [DOI] [PubMed] [Google Scholar]
- 28.Zhou JY, Blakeley JO, Hua J, Kim M, Laterra J, Pomper MG, van Zijl PCM. Practical data acquisition method for human brain tumor amide proton transfer (APT) imaging. Magn Reson Med. 2008;60(4):842–849. doi: 10.1002/mrm.21712. [DOI] [PMC free article] [PubMed] [Google Scholar]
- 29.Wang F, Qi HX, Zu Z, Mishra A, Tang C, Gore JC, Chen LM. Multiparametric MRI reveals dynamic changes in molecular signatures of injured spinal cord in monkeys. Magn Reson Med. 2015;74(4):1125–1137. doi: 10.1002/mrm.25488. [DOI] [PMC free article] [PubMed] [Google Scholar]
- 30.Wang F, Zu Z, Wu R, Wu TL, Gore JC, Chen LM. MRI evaluation of regional and longitudinal changes in Z-spectra of injured spinal cord of monkeys. Magn Reson Med. 2017 doi: 10.1002/mrm.26756. [DOI] [PMC free article] [PubMed] [Google Scholar]
- 31.Sun PZ, Sorensen AG. Imaging pH using the chemical exchange saturation transfer (CEST) MRI: Correction of concomitant RF irradiation effects to quantify CEST MRI for chemical exchange rate and pH. Magn Reson Med. 2008;60(2):390–397. doi: 10.1002/mrm.21653. [DOI] [PubMed] [Google Scholar]
- 32.Jin T, Wang P, Zong XP, Kim SG. MR imaging of the amide-proton transfer effect and the pH-insensitive nuclear overhauser effect at 9. 4 T. Magn Reson Med. 2013;69(3):760–770. doi: 10.1002/mrm.24315. [DOI] [PMC free article] [PubMed] [Google Scholar]
- 33.van Zijl PC, Jones CK, Ren J, Malloy CR, Sherry AD. MRI detection of glycogen in vivo by using chemical exchange saturation transfer imaging (glycoCEST) Proc Natl Acad Sci USA. 2007;104(11):4359–4364. doi: 10.1073/pnas.0700281104. [DOI] [PMC free article] [PubMed] [Google Scholar]
- 34.Ren JM, Marshall BA, Gulve EA, Gao JP, Johnson DW, Holloszy JO, Mueckler M. Evidence from transgenic mice that glucose-transport is rate-limiting for glycogen deposition and glycolysis in skeletal-muscle. J Biol Chem. 1993;268(22):16113–16115. [PubMed] [Google Scholar]
- 35.Wang F, Kopylov D, Zu Z, Takahashi K, Wang S, Quarles CC, Gore JC, Harris RC, Takahashi T. Mapping murine diabetic kidney disease using chemical exchange saturation transfer MRI. Magn Reson Med. 2016;75(4):1685–1695. doi: 10.1002/mrm.26045. [DOI] [PMC free article] [PubMed] [Google Scholar]
- 36.Longo DL, Busato A, Lanzardo S, Antico F, Aime S. Imaging the pH evolution of an acute kidney injury model by means of iopamidol, a MRI-CEST pH-responsive contrast agent. Magn Reson Med. 2013;70(3):859–864. doi: 10.1002/mrm.24513. [DOI] [PubMed] [Google Scholar]
- 37.Zhang XY, Wang F, Afzal A, Xu JZ, Gore JC, Gochberg DF, Zu ZL. A new NOE-mediated MT signal at around-1. 6 ppm for detecting ischemic stroke in rat brain. Magnetic resonance imaging. 2016;34(8):1100–1106. doi: 10.1016/j.mri.2016.05.002. [DOI] [PMC free article] [PubMed] [Google Scholar]
- 38.Zhang XY, Wang F, Jin T, Xu J, Xie J, Gochberg DF, Gore JC, Zu Z. MR imaging of a novel NOE-mediated magnetization transfer with water in rat brain at 9.4 T. Magn Reson Med. 2016 doi: 10.1002/mrm.26396. [DOI] [PMC free article] [PubMed] [Google Scholar]
- 39.Pluim JPW, Maintz JBA, Viergever MA. Mutual-information-based registration of medical images: A survey. IEEE Trans Med Imaging. 2003;22(8):986–1004. doi: 10.1109/TMI.2003.815867. [DOI] [PubMed] [Google Scholar]
- 40.Bane O, Wagner M, Zhang JL, Dyvorne HA, Orton M, Rusinek H, Taouli B. Assessment of renal function using intravoxel incoherent motion diffusion-weighted imaging and dynamic contrast-enhanced MRI. J Magn Reson Imaging. 2016;44(2):317–326. doi: 10.1002/jmri.25171. [DOI] [PMC free article] [PubMed] [Google Scholar]
- 41.Smith SA, Edden RA, Farrell JA, Barker PB, Van Zijl PC. Measurement of T1 and T2 in the cervical spinal cord at 3 tesla. Magn Reson Med. 2008;60(1):213–219. doi: 10.1002/mrm.21596. [DOI] [PMC free article] [PubMed] [Google Scholar]
- 42.Ramani A, Dalton C, Miller DH, Tofts PS, Barker GJ. Precise estimate of fundamental in-vivo MT parameters in human brain in clinically feasible times. Magnetic resonance imaging. 2002;20(10):721–731. doi: 10.1016/s0730-725x(02)00598-2. [DOI] [PubMed] [Google Scholar]
- 43.Desmond KL, Moosvi F, Stanisz GJ. Mapping of amide, amine, and aliphatic peaks in the CEST spectra of murine xenografts at 7 T. Magn Reson Med. 2014;71(5):1841–1853. doi: 10.1002/mrm.24822. [DOI] [PubMed] [Google Scholar]
- 44.Tantawy MN, Jiang R, Wang F, Takahashi K, Peterson TE, Zemel D, Hao CM, Fujita H, Harris RC, Quarles CC, Takahashi T. Assessment of renal function in mice with unilateral ureteral obstruction using 99mTc-MAG3 dynamic scintigraphy. BMC Nephrol. 2012;13:168. doi: 10.1186/1471-2369-13-168. [DOI] [PMC free article] [PubMed] [Google Scholar]
- 45.Jonas J, Winter R, Grandinetti PJ, Driscoll D. High-pressure 2D NOESY experiments on phospholipid-vesicles. J Magn Reson. 1990;87(3):536–547. [Google Scholar]
- 46.Janve VA, Zu Z, Yao SY, Li K, Zhang FL, Wilson KJ, Ou X, Does MD, Subramaniam S, Gochberg DF. The radial diffusivity and magnetization transfer pool size ratio are sensitive markers for demyelination in a rat model of type III multiple sclerosis (MS) lesions. Neuroimage. 2013;74:298–305. doi: 10.1016/j.neuroimage.2013.02.034. [DOI] [PMC free article] [PubMed] [Google Scholar]
Associated Data
This section collects any data citations, data availability statements, or supplementary materials included in this article.
Supplementary Materials
Supporting Figure S1. Representative CEST images collected at different RF offsets.
Supporting Figure S2. Representative raw qMT data.
Supporting Figure S3. Comparison of cortical CEST effects at 1.2 ppm RF offset between CL and UUO kidneys 6 days after UUO surgery (N=8).


