Abstract
Semiconductor quantum dots (QDs) are attractive for a wide range of applications such as displays, light-emitting devices, and sensors due to their properties such as tunable fluorescence wavelength, high brightness, and narrow bandwidth. Most of the applications require precise patterning of QDs with targeted properties on solid-state substrates. Herein, we have developed a haptic-interfaced bubble printing (HIBP) technique to enable high-resolution (510 nm) high-throughput (>104 μm s−1) patterning of QDs with strong emission tunability and to significantly enhance the accessibility of the technique via a smartphone device. The scalability and versatility of the HIBP are demonstrated in our arbitrary patterning of QDs on plasmonic substrates. A detailed study of plasmonic and photothermal interactions is performed via programmed stage movements to realize tunability of the emission wavelength and lifetime. Finally, the influence of the hand movement on the properties of the printed QDs in terms of emission wavelength tuning from yellow to blue is established. This work provides a single-step macroscale platform to manipulate nanoscale properties at high resolution and high throughput.
Graphical abstract
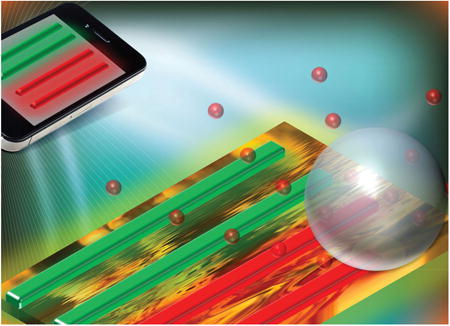
Translation of quantum dots (QDs) into many applications requires precise patterning of QDs with targeted properties on solid-state substrates. Haptic-interfaced bubble printing technique enables high-resolution (510 nm) high-throughput (>104 μm s−1) patterning of QDs with a strong emission tunability.
Introduction
Colloidal semiconductor quantum dots (QDs) have shown tremendous scientific and technological impact. For example, QDs exhibit exceptional optoelectronic properties due to their size-dependent quantum confinement effect, which enables tunable light emission with narrow bandwidth and high brightness.1–3 One can further enhance the optical performances of QDs by positioning them in the proximity of plasmonic substrates, leading to improved emission rates and directionality.4 In addition, the development of bulk solution-phase synthesis of QDs in both aqueous and non-aqueous solvents has significantly enhanced their applicability.5–7 So far, QDs have been explored for various applications such as light-emitting devices,8 displays,9 photovoltaics,10 biosensing,11 lasers,12 and photodetectors.13
The applications can be greatly improved by the capability of fabricating spatially addressable patterns of QDs with precisely tuned properties.14,15 Chen et al. achieved laser-induced tunability of optical properties of self-assembled films of QDs.16 However, with the self-assembly process, it is challenging to achieve site-specific deposition of QDs on the substrates. Due o their simplicity, additive nature, and real-time configurability via digital control,17 direct-write techniques such as inkjet printing, electrohydrodynamic jet printing, and gravure printing have been explored to realize the site-specific deposition of QDs with high throughput and material saving. However, these traditional printing techniques have their resolution limited at the micrometer scale due to technological issues such as ink coalescence and oversizing.18 In addition, tedious multi-step synthesis and deposition are needed to pattern QDs of variable optical properties on the same substrates, as required for some of the applications.19 Hence, the development of a widely accessible printing technique with sub-micrometer resolution and fluorescence-tuning capability is highly desired to expand the applications of QDs.
In this work, we have developed and applied a haptic-interfaced bubble printing (HIBP) technique for free-form patterning and fluorescence tuning of QDs on plasmonic substrates. Bubble printing exploits the photothermal heating of the substrates to generate bubbles, which capture and immobilize the QDs at the substrate–solution interfaces via coordinated actions of Marangoni convection, surface tension, van der Waals interaction, and thermal adhesion.20 The integration of a haptic interface into printing techniques caters to the engineering demands for precise and interactive processes at the micro- and nanoscale.21 In our case, we integrate the printing process with a smartphone to achieve the haptic operation. Specifically, we have applied HIBP to achieve site-specific patterning of QDs on plasmonic substrates consisting of Au nanoislands (AuNI). The effects of printing onditions on the emission characteristics of the patterned QDs in terms of emission wavelength and lifetime are studied based on both programmed stage control and haptic operation. By optimizing the printing parameters, we demonstrate simultaneous high resolution (510 nm linewidth) and high throughput (>104 μm s−1) HIBP, with the QD emission wavelengths tuned across the visible spectrum. The haptic integration provides a single-step macroscale platform to manipulate properties at the nanoscale.
Experimental
Quantum dot synthesis
The water-soluble CdSe/CdS core/shell QDs with red (615 nm) and yellow (565 nm) emission were synthesized based on a recently reported method (Fig. 1a).22 The synthesized QDs were purified and stored in chloroform. The QD concentrations were determined using the extinction coefficients.23,24 An amphiphilic polymer (PMAO-PEG) (molar ratio of PMAO: PEG was 1:10) was obtained from the overnight reaction of poly(maleic anhydride-alt-1-octadecene) (PMAO, Mn = 30 000–50 000, Aldrich) and amino poly(ethylene glycol) methyl ether (mPEG-NH2, MW 6000) in chloroform. The QDs and PMAO-PEG were mixed and stirred in chloroform for one hour at room temperature (molar ratio of QD: PMAO-PEG was 1: 10). An equal amount of water and chloroform was added, and chloroform was gradually removed via rotary evaporation at room temperature, leading to clear and colored solution of water-soluble QDs. An ultracentrifuge (Beckman Coulter Optima L-80XP) was used to further concentrate and remove excess amphiphilic polymer.
Fig. 1.
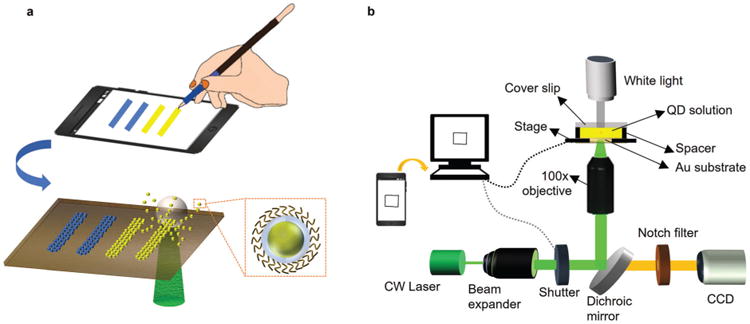
Haptic-interfaced bubble printing: (a) Illustration of haptic-interfaced bubble printing (HIBP). QDs in a single aqueous suspension can be immobilized on the substrate to exhibit variable emission wavelengths based on the hand movement over the smartphone screen, which in turn is replicated in the printing process. The bottom inset shows a magnified view of the CdSe/CdS QD along with an amphiphilic coating of PMAO-PEG. (b) Schematic representation of the experimental setup for the haptic-interfaced bubble printing.
Bubble printing and haptic interfacing
The printing was performed by programmed translation of a plasmonic substrate located on an automated optical stage. To prepare the plasmonic substrate, a 4 nm Au thin film was eposited on a glass substrate using thermal deposition (Denton Thermal evaporator), and the sample was subsequently annealed at 550 °C for 2 hours. The printing process was achieved using a Prior Proscan scientific stage (x–y resolution = 14 nm) in conjunction with a motorized flipper (ThorLabs MFF102, 500 ms response time) that performed the function of a shutter. A custom-written LabView code guided the stage along the predetermined coordinates and an on/off shutter status.
To achieve haptic operation, an android app registered the coordinates and the shutter status, which were subsequently imported into the LabView code. The mobile app was built on the Android Studio platform using Java, and it is compatible with all Android OS phones and tablets.
Characterization techniques
The fluorescence images were obtained using a Zeiss LSM 710 microscope with a 405 nm excitation source. All patterned samples were washed with DI water and dried with nitrogen gas before we performed the characterization. The composite images without any emission filters were generated via the wavelength-integrated coloring feature in the Zeiss ZEN software, thereby depicting the actual emission color of the printed QDs. The fluorescence lifetime of the QDs was measured via time-correlated single photon counting (TCSPC), using a femtosecond titanium:sapphire laser tuned to 800 nm (∼200 fs) (Mira 900, Coherent), galvo scanning mirrors (6215H, Cambridge Tech.), and a GaAsP photomultiplier tube (PMT) (H7422PA-40, Hamamatsu) in a nondescanned detection scheme. The output current of the PMT was amplified using a preamplifier with 2 GHz cutoff (HFAC-26, Becker and Hickl GmbH). The amplified pulses from the PMTs were sent to the TCSPC module (SPC-150, Becker and Hickl GmbH). A silicone oil-immersion lens with NA of 1.3 (UPLSAPO60X, Olympus) was used. The fluorescence lifetime was recorded with a 20 ps time resolution, a pixel integration time of 5 ms and an incident ower of 1 mW. A least-squares method using the model of a single exponential decay convolved with a Gaussian impulse function was utilized to perform lifetime fitting. High fitting quality was ensured by removing data points with less than 500 photons, and the fittings with χ2 values less than 2 were discarded. Atomic force microscopy (AFM) images were taken using a Park Scientific AFM under non-contact mode.
Results and discussion
Fig. 1a illustrates that HIBP can utilize a single QD solution to pattern QDs with variable emission characteristics on the plasmonic substrate. A laser beam focused with a 100× oil objective is used to print the QDs over a plasmonic substrate, which is positioned on an automated stage (Fig. 1b). The capture and immobilization of the QDs benefit from the plasmon-enhanced photothermal response of the AuNI substrate.20,25 Briefly, upon incidence of a continuous wave laser beam (532 nm) on the AuNI substrate, the reemitted energy from the resonant AuNI via non-radiative Landau damping leads to overheating of water molecules to generate mesobubbles over the substrate surface. The Marangoni convection arising from the temperature gradient creates a convective drag force towards the bubble surface. The QDs are subsequently trapped via multi-force balance of vapor-liquid pressure difference, drag force and surface tension, and eventually immobilized on the substrate due to van der Waals interaction and thermal adhesion.
The large-area printing of QDs becomes feasible due to the high stability and low equilibration time (∼10−4 s) of the sub-micron bubble26 and the uniform temperature increase over the AuNI substrate.27 The printing of arbitrary patterns of QDs is achieved through computer-controlled translation of the automated optical stage that holds the substrate. The printing is switched on and off using a motorized shutter, which reduces the incident laser power below the threshold power in the off state and results in bubble dissolution.
To enable the haptic operation of the bubble printing, we utilize a smartphone app and define the desired hand-drawn atterns over the display. The app presents a plain drawing space, a colored pallet, as well as buttons to save, erase/undo, and start a new pattern (Fig. S1, ESI†). We utilize Android's built-in coordinate system to register the haptic pattern and touch event to populate the vector coordinate and shutter matrix (Fig. S2 and Video S1, ESI†). The app-registered data are transferred to the custom-written LabView code to direct the printing process.
As an example, an inward spiral pattern of red QDs (Fig. 2a) was fabricated by the HIBP. The printed spiral has an overall dimension of ∼30 μm and sub-micron linewidth. We can further perform scaling when translating the pattern from the smartphone coordinate system based on its resolution (2560 × 1440) to the actual print coordinates (in μm). The sub-micron resolution of HIBP enables us to control the dimensions of the printed QDs over a large range from a few micrometers to tens of micrometers. Based on the shapes hand-drawn over the smartphone (Fig. 2b) and the scaling factors ranging from 20× to 40×, we replicate the patterns of red QDs with different dimensions from 35 μm × 12 μm to 68 μm × 25 μm. Higher downscaling factors lead to smaller dimensions. The scalability of the pattern dimensions is useful for many applications such as multi-sensor integration with each sensor fabricated at a different dimension for enhanced performance.28 The bright-field images of the QD patterns in Fig. 2 are shown in Fig. S3 (ESI†).
Fig. 2.
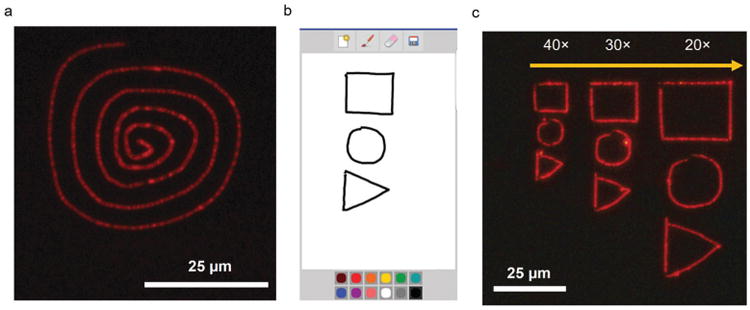
Haptic printing and pattern scalability: (a) a hand-drawn spiral pattern over the smartphone is printed using red QDs on a plasmonic substrate. The fluorescence image of the spiral under the tetramethylrhodamine (TRITC) channel is shown. (b) A snapshot of the basic shapes drawn on the smartphone screen. (c) HIBP of the pattern in (b) using red QDs at different downscaling factors.
To provide guidance on fluorescence tuning of QDs in HIBP, we have shown that the bubble-printing process and the properties of the resulting QD patterns primarily depend on the interplay of three parameters: (i) stage translation speed, (ii) stage hold time, and (iii) line spacing in the patterns. We have systematically studied the influence of stage translation speed and line spacing on the fluorescence properties of yellow QDs patterned on the plasmonic substrate. As shown in Fig. 3a, three patterns consisting of parallel lines with gradually decreasing line spacing from 4 μm to 0.5 μm were fabricated at stage speeds of 1 μm s−1, 6 μm s−1 and 104 μm s−1 (the highest speed), respectively. The printed QDs can achieve sub-micron line-widths down to 510 nm (Fig. S4, ESI†). From the fluorescence images in Fig. 3a, we can see that the emission of QDs makes a shift from the original yellow to blue color with decreasing stage speed and line spacing. The QDs printed with the lowest stage speed (1 μm s−1) exhibit blue emission irrespective of the line space. At an intermediate stage speed of 6 μm s−1, the effect of line spacing on the fluorescence wavelength is evident, with blue emission occurring at the lowest space of 0.5 μm.
Fig. 3.
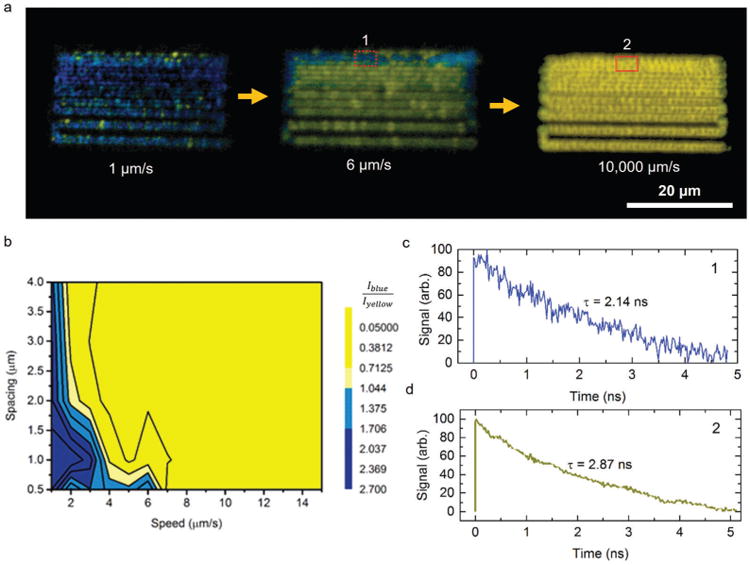
Effects of stage speed and line spacing on the emission characteristics of the printed QDs on the plasmonic substrates: (a) Merged fluorescence images of patterns of yellow QDs printed with various stage speeds and line spacing. For each pattern, the line spacing decreases from 4 μm to 0.5 μm (from bottom to top). The blue shifts occur at lower stage speeds and smaller line spacing. (b) A contour plot of the ratio of the peak intensities for the blue (450–495 nm) and yellow (560–595 nm) light as a function of stage speed and line spacing. (c and d) Fluorescence lifetime of the printed QD at the region marked as 1 and 2 in (a). The lifetime decreases at smaller line spacing and slower stage speeds.
We attribute the spectral shifts to the oxidation of QDs during the bubble printing. Due to the resonant heating upon laser irradiation, the temperature at the plasmonic nanoparticle surfaces can reach >100 °C.20 Such elevated temperatures can lead to photo-oxidation of the printed QDs, which reduces the effective size of the QDs and thus causes a spectral blue-shift.29,30 The rapid photo-oxidation process can limit the introduction of multiple non-radiative states on the QD surfaces, minimizing the influence on the quantum yield and brightness of the QDs.29 The bubble printing at the lowest stage speed (1 μm s−1) has the maximum laser-heating effect and the photo-oxidation is sufficient to have the QDs emit blue light irrespective of the line space. For the bubble printing at an intermediate stage speed of 6 μm s−1, the blue emission occurs at the lowest space of 0.5 μm because the increased laser exposure from double scanning increases the photo-oxidation of the QDs. With higher stage speeds, the exposure time of the printed QDs to the laser heating isn't long enough to cause significant photo-oxidation (Video S2, ESI†). Fig. 3b shows a contour plot of the ratio of the peak intensities for blue (450–495 nm) and yellow (560–595 nm) light as a function of stage speed and line spacing. We can see that fine-tuning of the emission color of the printed QDs is possible by controlling the stage speed and line spacing.
We have further characterized the spontaneous emission rate of the printed QDs on plasmonic substrates by time-resolved fluorescence spectroscopy. As shown in Fig. 3c and d, the printing of QDs with a low speed resulted in a shorter lifetime (τ = 2.14 ns) compared to the ultra-fast printing (τ = 2.87 ns). The reduction in lifetime is attributed to the decrease in QD size in the low-speed printing, which has been reported previously.31,32 In the smaller QD, a higher degree of overlap between the electron and hole wave functions leads to faster electron–hole recombination and thus a shorter lifetime.33
The reduction in the radiative lifetime from τ = 7.50 ns for QDs drop-cast on glass substrates (Fig. S5a, ESI†) to τ ≈ 2.14 ns for the printed QDs (Fig. 3c) can be attributed to a combination of the oxidation of QDs and Purcell effect originating from the plasmonic substrate's proximity to the QDs.34 The high-speed HIBP-printed QDs (τ = 2.87 ns) had a comparable lifetime to QDs drop-cast on AuNI (τ ≈ 3.20 ns) (Fig. S5b, ESI†), with the additional reduction arising from the strong adhesion of QDs and thus the shorter QD–AuNI separation. The strong adhesion of the QDs to the substrate is further demonstrated by the consistency of the fluorescence images before and after sonication of the sample in DI water for 5 min (Fig. S6, ESI†). We further performed the lifetime measurements at various regions (with different line spacing) of the QD pattern by ultra-fast bubble printing (Fig. 4). We can see that there is a negligible change (standard deviation ≈ 0.01 ns) in the lifetime at various line spacing. In this case, the photo-oxidation of the QDs is minimal and the increase in the spontaneous emission rate is primarily due to the Purcell effect. The lifetime tuning of the QDs in the bubble printing can be utilized to encode optical security devices and to study biological processes.35
Fig. 4.
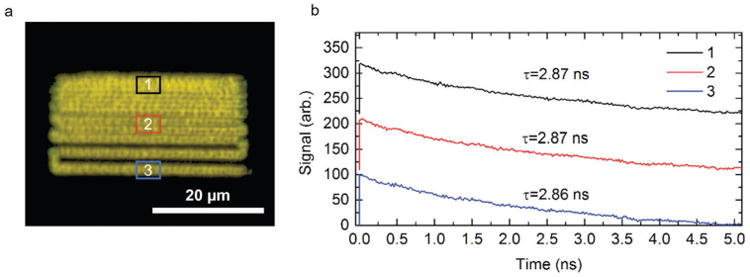
Fluorescence lifetime measurements at various regions (with different line spacing) of the patterned QDs on the plasmonic substrate by ultra-fast bubble printing. (a) Fluorescence image of the QD pattern printed at an ultra-high speed of 104 μm s−1. (b) Fluorescence lifetime of the QDs at the regions marked by 1, 2 and 3 in (a), with a y-offset.
Following the establishment of the process–structure–property relationship for the patterned QDs by bubble printing, we move on to demonstrate the fluorescence tuning of the printed QDs with the haptic operation. The density of coordinates in the coordinate matrix input into the LabView program is based on the speed of the hand movement over the smartphone display. Fig. 5a shows that the coordinate density is increased from 0.2 coordinate per μm to 10 coordinates per μm when the speed of the hand movement is decreased. The increase in the coordinate density is manifested as a decrease in the printing speed since the stage has an inherent hold time at each coordinate. Therefore, blue emission is observed from the QDs patterned at a coordinate density of > 7 coordinates per μm, which leads to an effective stage speed of <3 μm s−1 (Fig. 5b). This observation is consistent with the contour plot in Fig. 3b. Fig. 5c shows the corresponding fluorescence spectra for the lines of QDs in Fig. 5b. There is initially a minimal blue shift in the peak wavelength, followed by prominent blue shift for the three slowest hand-written lines. In addition, the spectrum broadens at the slower hand movement due to the continued photo-oxidation.30
Fig. 5.
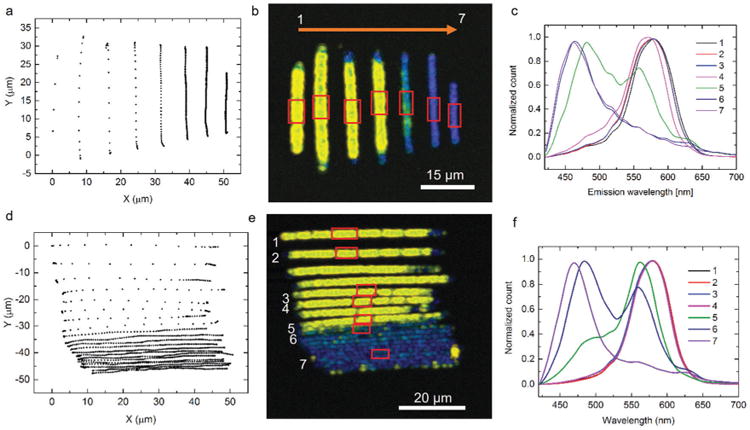
Fluorescence tuning of the patterned QDs on plasmonic substrates by HIBP: (a) the registered coordinates from the smartphone based on hand-drawn lines with decreasing hand movement speed (from left to right). (b) Fluorescence image of the corresponding patterns of yellow QDs by HIBP based on the hand-drawn lines in (a). Blue emission occurs from the printed QDs at the slower hand movement. (c) Fluorescence spectra of the corresponding marked regions on the lines of QDs in (b). (d) The registered coordinates from the smartphone based on hand-drawn patterns combining the variations of hand movement speed and line spacing. (e) Fluorescence image of the corresponding patterns of yellow QDs by HIBP based on the hand-drawn lines in (d). (f) Fluorescence spectra recorded from the marked regions in (e). The rectangles in (b) and (e) indicate the regions from which the fluorescence spectra are recorded. The numbers in (b) and (e) correspond to those in (c) and (f), respectively.
We further combine hand movement speed with line spacing in the hand-drawn patterns to tune the QD fluorescence. Fig. 5d shows the coordinates with a simultaneous decrease in the hand movement speed and line spacing upon moving away from the origin along the y-axis. From the fluorescence image in Fig. 5e, we can see that blue emission starts to appear at the slower movement speed. With the reduced line spacing that leads to double exposure of the QDs to the laser beam, the blue emission is observed at a relatively low coordinate density of 4 coordinates per mm (compared to > 7 coordinates per mm in Fig. 5b). The blue shift is also evidenced from the fluorescence spectra (Fig. 5f) taken at various locations in the QD pattern. Thus, we can pattern the QDs and tune their site-specific emission properties at the sub-microscale level by simply controlling hand movement over the smartphone display.
Conclusion
We have developed and applied HIBP to achieve versatile patterning of QDs on plasmonic substrates. An android app was utilized as a platform to register haptic movements as coordinates and to direct the printing process in a free form. HIBP has achieved a high printing speed (> 104 μm s−1), high resolution (∼510 nm) and high pattern scalability, as well as the ability to simultaneously tune the fluorescence properties of the printed QDs. The tuning of fluorescence wavelength and lifetime of the QDs is achieved by controlling the plasmonic and photothermal effects in the HIBP. HIBP is readily applied to pattern other types of colloidal particles. By providing a highly accessible tool to manipulate matter at the nanoscale, HIBP can significantly advance research and education in nanoscience and nanotechnology.
Supplementary Material
Acknowledgments
The authors acknowledge the financial support of the Beckman Young Investigator Program, and Dr William W. Yu for providing the quantum dots. We also thank Mr Xiaolei Peng, Ms Ashwini Venkatesh, and Ms Priyanka Khante for helpful discussions.
Footnotes
Electronic supplementary information (ESI) available. See DOI: 10.1039/c7tc00454k
References
- 1.Li XQ, Wu YW, Steel D, Gammon D, Stievater TH, Katzer DS, Park D, Piermarocchi C, Sham LJ. Science. 2003;301:809–811. doi: 10.1126/science.1083800. [DOI] [PubMed] [Google Scholar]
- 2.Vanmaekelbergh D, Liljeroth P. Chem Soc Rev. 2005;34:299–312. doi: 10.1039/b314945p. [DOI] [PubMed] [Google Scholar]
- 3.Kim JY, Voznyy O, Zhitomirsky D, Sargent EH. Adv Mater. 2013;25:4986–5010. doi: 10.1002/adma.201301947. [DOI] [PubMed] [Google Scholar]
- 4.Pietryga JM, Park YS, Lim JH, Fidler AF, Bae WK, Brovelli S, Klimov VI. Chem Rev. 2016;116:10513–10622. doi: 10.1021/acs.chemrev.6b00169. [DOI] [PubMed] [Google Scholar]
- 5.Yin YD, Talapin D. Chem Soc Rev. 2013;42:2484–2487. doi: 10.1039/c3cs90011h. [DOI] [PubMed] [Google Scholar]
- 6.Yu WW, Peng XG. Angew Chem, Int Ed. 2002;41:2368–2371. doi: 10.1002/1521-3773(20020703)41:13<2368::AID-ANIE2368>3.0.CO;2-G. [DOI] [PubMed] [Google Scholar]
- 7.Cassette E, Helle M, Bezdetnaya L, Marchal F, Dubertret B, Pons T. Adv Drug Delivery Rev. 2013;65:719–731. doi: 10.1016/j.addr.2012.08.016. [DOI] [PubMed] [Google Scholar]
- 8.Mashford BS, Stevenson M, Popovic Z, Hamilton C, Zhou ZQ, Breen C, Steckel J, Bulovic V, Bawendi M, Coe-Sullivan S, Kazlas PT. Nat Photonics. 2013;7:407–412. [Google Scholar]
- 9.Kim TH, Cho KS, Lee EK, Lee SJ, Chae J, Kim JW, Kim DH, Kwon JY, Amaratunga G, Lee SY, Choi BL, Kuk Y, Kim JM, Kim K. Nat Photonics. 2011;5:176–182. [Google Scholar]
- 10.Lan XZ, Masala S, Sargent EH. Nat Mater. 2014;13:233–240. doi: 10.1038/nmat3816. [DOI] [PubMed] [Google Scholar]
- 11.Medintz IL, Clapp AR, Mattoussi H, Goldman ER, Fisher B, Mauro JM. Nat Mater. 2003;2:630–638. doi: 10.1038/nmat961. [DOI] [PubMed] [Google Scholar]
- 12.Lee AD, Jiang Q, Tang MC, Zhang YY, Seeds AJ, Liu HY. IEEE J Sel Top Quantum Electron. 2013;19:1901107. [Google Scholar]
- 13.Konstantatos G, Howard I, Fischer A, Hoogland S, Clifford J, Klem E, Levina L, Sargent EH. Nature. 2006;442:180–183. doi: 10.1038/nature04855. [DOI] [PubMed] [Google Scholar]
- 14.Sapsford KE, Pons T, Medintz IL, Mattoussi H. Sensors. 2006;6:925–953. [Google Scholar]
- 15.Zhang L, Chen C, Li WJ, Gao GH, Gong P, Cai LT. ACS Appl Mater Interfaces. 2016;8:13187–13191. doi: 10.1021/acsami.6b03795. [DOI] [PubMed] [Google Scholar]
- 16.Chen JX, Chan YH, Yang TL, Wark SE, Son DH, Batteas JD. J Am Chem Soc. 2009;131:18204–18205. doi: 10.1021/ja906837s. [DOI] [PubMed] [Google Scholar]
- 17.Singh M, Haverinen HM, Dhagat P, Jabbour GE. Adv Mater. 2010;22:673–685. doi: 10.1002/adma.200901141. [DOI] [PubMed] [Google Scholar]
- 18.Castrejon-Pita JR, Baxter WRS, Morgan J, Temple S, Martin GD, Hutchings IM. Atomization Sprays. 2013;23:541–565. [Google Scholar]
- 19.Medintz IL, Uyeda HT, Goldman ER, Mattoussi H. Nat Mater. 2005;4:435–446. doi: 10.1038/nmat1390. [DOI] [PubMed] [Google Scholar]
- 20.Lin LH, Peng XL, Mao ZM, Li W, Yogeesh MN, Rajeeva BB, Perillo EP, Dunn AK, Akinwande D, Zheng YB. Nano Lett. 2016;16:701–708. doi: 10.1021/acs.nanolett.5b04524. [DOI] [PMC free article] [PubMed] [Google Scholar]
- 21.Sun J, Liu Y, Ritchie JM, Luo X. Proc Inst Mech Eng, Part E. 2015;229:290–298. [Google Scholar]
- 22.Yu WW, Chang E, Falkner JC, Zhang J, Ali-Somali AM, Sayes CM, Jones J, Drezek R, Colvin VL. J Am Chem Soc. 2007;129:2871–2879. doi: 10.1021/ja067184n. [DOI] [PubMed] [Google Scholar]
- 23.Yu WW, Qu L, Guo W, Peng X. Chem Mater. 2003;15:2854–2860. [Google Scholar]
- 24.Yu WW, Qu L, Guo W, Peng X. Chem Mater. 2004;16:560. [Google Scholar]
- 25.Baffou G, Polleux J, Rigneault H, Monneret S. J Phys Chem C. 2014;118:4890–4898. [Google Scholar]
- 26.Liu XM, Bao L, Dipalo M, De Angelis F, Zhang XH. Sci Rep. 2015;5:18515. doi: 10.1038/srep18515. [DOI] [PMC free article] [PubMed] [Google Scholar]
- 27.Baffou G, Quidant R, de Abajo FJG. ACS Nano. 2010;4:709–716. doi: 10.1021/nn901144d. [DOI] [PubMed] [Google Scholar]
- 28.Pang C, Zhao Z, Zhang JG, Shi L, Du LD, Fang Z, Liu YH. 4th IEEE International Conference on Nano/Micro Engineered and Molecular Systems, vols 1 and 2; 2009. pp. 270–273. [DOI] [Google Scholar]
- 29.Wang XY, Zhang JY, Nazzal A, Xiao M. Appl Phys Lett. 2003;83:162–164. [Google Scholar]
- 30.Shcherbatyuk GV, Inman RH, Ghosh S. J Appl Phys. 2011;110:053518. [Google Scholar]
- 31.Kongkanand A, Tvrdy K, Takechi K, Kuno M, Kamat PV. J Am Chem Soc. 2008;130:4007–4015. doi: 10.1021/ja0782706. [DOI] [PubMed] [Google Scholar]
- 32.Wang CH, Chen TT, Chen YF, Ho ML, Lai CW, Chou PT. Nanotechnology. 2008;19:115702. doi: 10.1088/0957-4484/19/11/115702. [DOI] [PubMed] [Google Scholar]
- 33.Tvrdy K, Frantsuzov PA, Kamat PV. Proc Natl Acad Sci U S A. 2011;108:29–34. doi: 10.1073/pnas.1011972107. [DOI] [PMC free article] [PubMed] [Google Scholar]
- 34.Hoang TB, Akselrod GM, Argyropoulos C, Huang JN, Smith DR, Mikkelsen MH. Nat Commun. 2015;6:7788. doi: 10.1038/ncomms8788. [DOI] [PMC free article] [PubMed] [Google Scholar]
- 35.Zhang L, Chen C, Li W, Gao G, Gong P, Cai L. ACS Appl Mater Interfaces. 2016;8:13187–13191. doi: 10.1021/acsami.6b03795. [DOI] [PubMed] [Google Scholar]
Associated Data
This section collects any data citations, data availability statements, or supplementary materials included in this article.


