Abstract
Boiling histotripsy is a method of focused ultrasound surgery that noninvasively applies millisecond-length pulses with high-amplitude shock fronts to generate liquefied lesions in tissue. Such a technique requires unique outputs compared to a focused ultrasound thermal therapy apparatus, particularly to achieve high in situ pressure levels through intervening tissue. This article describes the design and characterization of a system capable of producing the necessary pressure to transcutaneously administer boiling histotripsy therapy through clinically relevant overlying tissue paths using pulses with duration up to 10 ms. A high-voltage electronic pulser was constructed to drive a 1-MHz focused ultrasound transducer to produce shock waves with amplitude capable of generating boiling within the pulse duration in tissue. The system output was characterized by numerical modeling with the 3D Westervelt equation using boundary conditions established by acoustic holography measurements of the source field. Such simulations were found to be in agreement with directly measured focal waveforms. An existing derating method for nonlinear therapeutic fields was used to estimate in situ pressure levels at different tissue depths. The system was tested in ex vivo bovine liver samples to create boiling histotripsy lesions at depths up to 7 cm. Lesions were also created through excised porcine body wall (skin, adipose, muscle) with 3–5 cm thickness. These results indicate that the system is capable of producing the necessary output for transcutaneous ablation with boiling histotripsy.
Index Terms: High intensity focused ultrasound (HIFU), hyperthermia and surgery, system & device design, biological effects & dosimetry, medical transducers
I. Introduction
High intensity focused ultrasound (HIFU) is a promising therapeutic modality for treatment of tumors [2–5]. Noninvasive HIFU methods employ a transducer that is acoustically coupled to the skin to generate and focus ultrasound to a targeted tissue structure in the body through aberrating and attenuating intervening tissue layers.
Most HIFU applications presently rely on a thermal ablative effect. Given sufficient focusing, conversion of the acoustic wave to thermal energy through absorption and the resulting temperature rise can be spatially localized to ablate the intended tissue through thermal denaturation of proteins. Benefits of such a method are its noninvasive mechanism of action, the ability to treat most tissue types, and requirement of relatively low acoustic pressure amplitudes that can be reliably generated by piezoelectric sources. However, thermal HIFU also has limitations in its precision, speed, and availability of real-time imaging. Blood perfusion can result in undertreating a targeted volume, and areas adjacent to the intended treatment site can be ablated due to thermal diffusion [6]. Such problems require that the rate and pattern of heat deposition is carefully controlled. Additional treatment planning is also needed to ensure that no prefocal or postfocal structures, such as ribs or skull, are overheated [7, 8]. Large vessels near the target tissue potentially affect the outcome as well, by acting as a thermal sink that cools the immediate surroundings [9, 10]. Real-time monitoring of HIFU treatment is most reliable using magnetic resonance imaging (MRI), but the limited spatial and temporal resolution of MRI necessitate slow heating rates and therefore long treatment times on the order of hours for sizeable tumors.
Another prominent effect of HIFU is the generation of bubbles through boiling or cavitation at the focus. Bubble expansion, motion, and interactions with the incident wave field can serve to concentrate stress on the tissue sufficient to cause mechanical disintegration, a process referred to as ‘histotripsy’ [11–14]. The histologic characteristics of histotripsy lesions are a homogenization of tissue structure on a subcellular level [15–17] and disorganization of tissue structures[18] without apparent thermal necrosis. Macroscopic effects include liquefaction of parenchymal tissue [19, 20] or erosion of tougher tissue structures [21, 22], often accompanied by minor bleeding into the lesion volume in an in vivo scenario [23, 24]. The boundaries of the lesions are usually well-defined; the inside of the volume displays complete homogenization, while just a few cell lengths away, tissue appears completely viable [15, 25]. Peripheral cavitation activity outside of the focal volume can cause small, isolated areas of hemorrhagic injury surrounding the main lesion [26].
The above description applies to two separate methods of histotripsy: one based on millisecond-long pulses that result in rapid heating and boiling of the tissue within each pulse (boiling histotripsy or BH) [27, 28] and the other based on repeated microsecond-long pulses that result in formation and collapse of a cavitation cloud (cavitation-based histotripsy) [19, 29]. While each appears to produce similar biological and mechanical effects on the tissue, the described mechanisms of bubble formation are quite distinct [12, 30–32]. There may be significant clinical advantages to using each method [14]. For instance, generating cavitation in histotripsy is more easily achieved at low frequencies that can provide better depth penetration, while generating rapid heating through ultrasound absorption and boiling for BH are accomplished more readily with higher frequencies that can be more precisely focused.
Although BH has been demonstrated feasible in both ex vivo tissue and in vivo, work to date has been accomplished by exposing a target organ with no intervening tissue [24]. One reason behind this approach is the need to accurately identify the in situ exposure levels that cause tissue liquefaction. Another reason is the limited capabilities of most HIFU power electronics and transducers. Performing transcutaneous BH requires the generation of ultrasound pulses with in situ shock amplitudes as great as 100 MPa that are sustained for ∼10 ms so that localized boiling is initiated during each pulse [12].
In this article, we describe the development and testing of a system capable of producing BH lesions through clinically relevant tissue paths. A pulsed power amplifier design [33] previously developed for cavitation-based histotripsy was modified to provide necessary pulsed power output over the durations needed for BH. In addition, a BH transducer was designed to produce high-amplitude shock fronts at the focus and withstand high output levels. The transducer was fabricated using a methodology for robust design and construction of focused transducers [34]. Characterization of the overall acoustic output of the system was performed using a combined measurement and modeling technique in its most accurate formulation [35]. In this approach, acoustic holography measurements were used to define boundary conditions for the modeling [36]. The nonlinear acoustic field was then simulated using the Westervelt equation [37, 38]. Beyond system characterization, we demonstrate that lesions can be made through different tissue thicknesses in liver and through porcine abdominal wall. As such, this work represents a step toward performing BH treatments to targeted tissue sites in deep-seated abdominal organs such as liver or kidney.
II. Methods
A. Driving Electronics
An electronic transducer driving system was designed and constructed based on a half-bridge class-D amplifier previously developed for HIFU applications including cavitation-based histotripsy (Fig. 1) [33]. The system is composed of 1) a field-programmable gate array (FPGA) board that produces digital unipolar, low-voltage waveforms (DE1, Altera, San Jose, California), 2) an amplifier board that converts the FPGA signal to high voltage, 3) low- and high-voltage supplies that power the amplifier board, and 4) an electrical tuning network at the amplifier output to transform the transducer impedance driven by the amplifier. This design can be duplicated in parallel sets to create multiple output channels, each with a low impedance of ∼1 Ω. Any load with substantially higher impedance can be driven with good efficiency. The amplifier output stage is powered by a controllable DC voltage supply with a range VDC = 0 – 400 V.
Fig. 1.
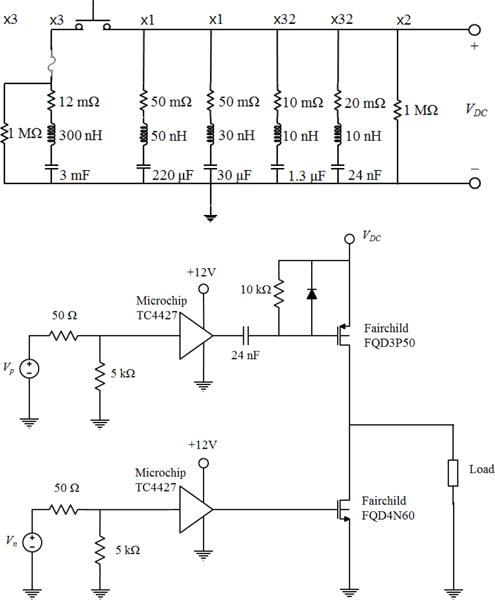
(Top) The electrical schematic for the capacitor array, including parasitic values for the capacitors. The array is connected between high-voltage (VDC) and ground. The multiplier above each series RLC indicates the number of parallel units used in the full array. (Bottom) A schematic of one unit of the amplifier system. The complete amplifier comprises 8 channels and each channel consists of 4 identical units in parallel between the input signals (Vn, Vp) and the output to the load.
In its original design, the amplifier is capable of producing large peak power output and voltage levels to drive transducers to produce high surface pressure. A limitation of this configuration is that it can only produce such power output for short bursts (< 100 cycles at 1 MHz). For longer burst durations, the energy stored by the on-board capacitors is diminished and the voltage level declines. Because of the large instantaneous currents demanded to produce high power levels (which may be >100 A), the high voltage power supply cannot respond quickly enough or supply the current necessary to recharge the capacitors as a burst is being produced.
To achieve longer bursts, a capacitor array was installed in parallel with the high-voltage supply to store the necessary energy to produce long bursts. A schematic of the system is shown in Figure 1. The capacitor array was designed to store sufficient energy to emit a 10,000-cycle burst from a therapy transducer with a parallel impedance down to ∼ 2 Ω while not reducing the voltage across the capacitors more than 10%. An energy storage capacitance of ∼9 mF was chosen, comprising 3 film capacitors.
The capacitors and their associated self-inductance create a resonance that is evident as fluctuation of the voltage on the power supply during a burst. As a result, these fluctuations can cause unintended behavior of the board by transient overvoltage of the transistors on the amplifier board. Thus, smaller bypass capacitors were installed in parallel to create a tuned array with a low impedance over the frequency range of 100 Hz to 10 MHz (Figure 1). Damping resistors were added to each of the three largest capacitor values to minimize resonances between them and minimize oscillations of the supply. For simplicity, damping was not included on the two smallest capacitor values which had many parallel units, and this was not found to limit the operation up to the maximum driving power. For higher power operation, damping resistors on all capacitors may be needed. Under the present configuration, the impedance of the power supply was <0.2 Ω over the range 100 Hz to 10 MHz.
B. Transducer
A 1-MHz transducer for boiling histotripsy was designed and fabricated to produce lesions through overlying tissue. The transducer frequency and geometry were selected based on preliminary simulations to generate high-amplitude shocks through attenuating media. The transducer F-number ∼ 1 was selected based on a recently developed design method to generate shock amplitudes at the focus of 75 – 120 MPa sufficient to initiate boiling in less than 10 ms [1, 12]. Overall, the transducer comprises seven flat discs made from a low-loss piezoceramic material (SM111, Steiner and Martins Inc, Miami, FL), each 50 mm in diameter by 2.1 mm thick. The size of the elements was chosen so that an array with a high focal gain could be constructed while minimizing complexity. The elements are arranged in a housing constructed based on a rapid prototyping method [34]. The housing has an overall aperture of 14.7 cm, made with 7 elements with integrated lenses that focus the field of each element. The transducers had a common focal length of 14 cm (Fig. 2). The linear focusing gain of the transducer at 1 MHz is G = pF/p0=63, where pF is the focal pressure amplitude and p0 is characteristic initial pressure at the array elements defined as p0 = u0ρ0c0 assuming their uniform vibration velocity u0.
Fig. 2.
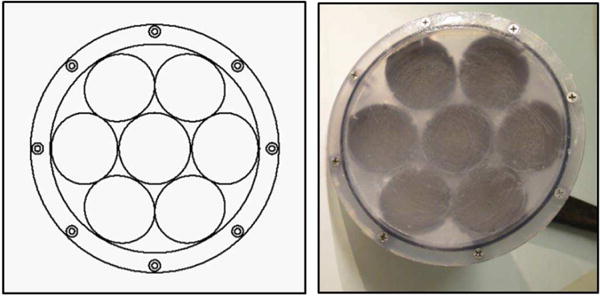
(Left) Diagram of the transducer radiating surface, showing the arrangement of the 7 elements. (Right) Photograph of the assembled transducer.
This transducer design approach was adopted because fabrication of large single piezoceramic elements is challenging and such elements are not readily available from most manufacturers. To align the element foci, each housing lens has a plano-concave elliptical shape with its center positioned on a spherical surface that has a radius of curvature equal to the transducer focal length of 14 cm. The housing was fabricated by a stereolithography apparatus (Viper Si2, 3D Systems, Atlanta GA), using a proprietary photopolymer (Accura 60, 3D Systems, Atlanta GA). The acoustic properties of the lens and housing material are similar to other engineering plastics, with sound speed of 2540 m/s, density of 1200 kg/m3, and attenuation of 3.6 dB/cm at 1 MHz [39].
A quarter-wavelength matching layer of tungsten-filled epoxy with impedance ZML = 6.8 MRayl [34] was formed between the flat circular elements and the planar surface of the lenses. The matching layer increases the bandwidth of the transducer and reduces the dynamic stresses generated in the elements. The reduced element stresses allow the transducer to generate greater surface pressures without mechanical failure of the elements, which is an important quality for the peak pressures required for histotripsy [34, 39]. In addition, the matching layer is dispensed as a liquid and serves as an adhesive bond between the piezoceramic element and the planar lens surface. Cables were then attached to the individual elements and the housing was sealed to be waterproof.
After fabrication of the transducer was completed, a passive L-bridge electrical network was designed for each transducer element to transform the element impedance to approximately 10 Ω, making the parallel impedance of all seven elements ∼1.4 Ω. Note that the amplifier channel output impedance is considerably lower at ∼1 Ω. The purpose of the network therefore was not to match the amplifier impedance, but rather to lower the impedance and increase the power that can be applied to each element. Although the power could be further raised by matching each element to a lower impedance, the losses in the amplifier increase dramatically as the element impedance approaches the amplifier output impedance. Operating under such conditions would significantly increase the likelihood of a failure.
The amplifier was characterized while driving the transducer to measure the power output capabilities. The power was obtained by direct measurement of the voltage waveforms at the amplifier output with a high voltage probe (PPE2KV, Teledyne-Lecroy, Chestnut Ridge, NY) and the current waveforms out of the amplifier, as captured for each channel by a high power inductive current probe (Pearson Electronics, Palo Alto, CA).
C. Hydrophone Measurements
The acoustic output was characterized by a combination of measurements and modeling following the method described by Kreider et al. [35]. Holographic pressure measurements were conducted at low power output using a capsule hydrophone with nominal sensitivity at 1 MHz of 4.23×10⁻⁷ V/Pa (HGL-0200 with AH-2020 preamplifier, Onda Corporation, Sunnyvale, CA). These measurements were used to reconstruct transducer vibrations. This vibrational pattern was scaled in amplitude and used as a boundary condition for nonlinear modeling at increasing power outputs. The modeling results were validated by comparing the nonlinear waveforms in the focal region at varying output levels with direct measurements using a fiber optic hydrophone [40] (FOPH 2000, RP Acoustics, Leutenbach, Germany).
For all hydrophone measurements, the transducer was mounted in a tank of deionized water, which was degassed to a dissolved oxygen level <20% of saturation. During measurements, each hydrophone was mounted on a 3-axis motorized positioning system (Velmex Inc., Bloomfield, NY) with the sensing region facing the ultrasound beam. One axis of the positioner was aligned to be parallel to the acoustic axis of the transducer. Pressure waveforms were captured by a digital storage oscilloscope (DSO-X 3034A, Keysight Technologies, Inc., Santa Rosa, CA), which was triggered in synchrony with the generation of acoustic pulses by the transducer.
Low-pressure measurements comprised 2D holography scans in a plane transverse to the acoustic axis, validation line scans made near the focus at low output levels, and single-point measurements made close to the transducer over a range of different output levels. For holography measurements, the hydrophone was first aligned with the peak pressure maximum of the linear field, then moved 55 mm from the focus toward the transducer along the acoustic axis. Different holograms were recorded with this point at the center of a 2D square region of the scan plane and used to characterize transducer behavior while driving all elements, only the central element, or only one peripheral element. In all cases, the elements were driven with VDC = 5 V. The scans covered a 120 × 120 mm area with steps of 0.75 mm between the measurements. Holograms were defined as a distribution of the pressure magnitude and phase at the operating frequency of 1 MHz measured at each point of the scanning grid. Although the ring-up time of the transducer was about 3 acoustic cycles, measurements were based on 10 cycles of the steady-state waveform beginning after about 30 cycles, which allowed the signals from all the transducer points to arrive to the hydrophone and thus to mimic correctly the steady-state CW regime. One-dimensional beam profiles were also measured for each of the 3 principal axes through the focus in order to validate linear field modeling results with holographically reconstructed boundary conditions.
For single-point measurements near the transducer, the hydrophone was moved 80 mm toward the transducer from the position of the peak pressure maximum. At this location, a series of waveforms was recorded for driving voltages ranging between VDC = 2.5 − 150 V. The amplitude of each measured waveform at 1 MHz was calculated again using 10 cycles of the steady-state waveform. The linearity of the measured waveforms was quantified as the ratio of the pressure amplitude at the second harmonic to that at the fundamental frequency, being equal to 0.14 at the highest measured output level. As described in further detail below, model boundary conditions were defined based on the pattern of source vibrations represented by the hologram measured under linear conditions; corresponding source pressures for a given output level were then scaled based on these single-point measurements.
For direct measurement of focal waveforms at high pressures, the fiber optic probe hydrophone (FOPH) was positioned at the location of the greatest value of the peak positive pressure at VDC = 50 V, which corresponded to the beginning of shock formation, and remained at the same location as waveforms were acquired at different power outputs. Collected waveforms were captured as an average of 128 waveforms and then deconvolved based on a manufacturer-provided impulse response for the FOPH [40, 41]. One-dimensional beam profiles for the peak positive and peak negative pressures in acoustic waveform were also recorded at VDC = 50 V for each of the 3 principal axes through the focus.
D. Nonlinear Acoustic Field Modeling
Numerical modeling of the HIFU fields generated in water was performed using the Westervelt equation. This equation has been shown to provide an accurate model to simulate nonlinear acoustic fields of strongly focused HIFU arrays [35]. The equation includes effects of nonlinearity, diffraction, and absorption generalized for frequency dependence of absorption in tissue [42]. Detailed description of the numerical algorithm has been presented in an earlier paper [37]. Here a brief summary of the simulations is provided.
To model forward propagation of the ultrasound beam generated by the transducer, the Westervelt equation was rewritten in a retarded coordinate system:
| (1) |
Here p is the acoustic pressure, z is the spatial coordinate along the beam axis, and τ= t – z/c0 is the retarded time, where t is the time. In addition, ∇2denotes the full Laplacian ∂2/∂x2 + ∂2/∂y2 + ∂2/∂z2, where x and y are spatial coordinates perpendicular to the axial coordinate z. Physical parameters ρ0, c0, β, and δ are the density, ambient sound speed, coefficient of nonlinearity, and diffusivity of sound in the propagation medium, respectively.
Equation (1) is generalized for modeling in tissue by including an additional operator Lt(p) that governs the linear dependence of absorption with frequency and the corresponding dispersion relationship for sound speed:
| (2) |
Here α(f0) is the absorption coefficient in tissue at the operating frequency f0 = 1 MHz of the transducer.
The boundary condition to the model was determined from holography measurements of the vibration pattern of the surface of the array [35, 43, 44]. The hologram measured in water in the plane z = 85 mm was linearly back projected to a source hologram in the plane z = 0 using the angular spectrum method. Note that the coordinate z = 0 corresponds to the apex of the surface on which transducer elements were positioned within the housing. To account for different output power levels, this source hologram was scaled in accordance with the single-point measurements made near the transducer [35]. The conversion coefficient between the voltage and pressure was determined by matching the peak positive and peak negative pressures of the simulated and measured focal waveforms by the FOPH at the focus for low source output (quasilinear conditions). Acoustic power calculated from the hologram measured at VDC = 5 V using this conversion coefficient was 2.6 W for all operating elements, 0.41 W for the center element only, and 0.45 W for a peripheral element only. Using these boundary conditions, nonlinear forward propagation simulations were launched starting from z = 0 for a range of different output levels.
In simulations, the Westervelt equation was solved following the method of fractional steps with an operator splitting procedure of second-order accuracy [45–47]. Equation (1) was divided into several simpler equations to define operators for diffraction, nonlinearity, and absorption. For each propagation step Δz, these equations were solved sequentially according to the second-order splitting scheme described by Tavakkoli et al. [45]. To obtain numerical solutions to these split operators, the acoustic field was represented in either the time domain or the frequency domain in the form of a finite Fourier series expansion of harmonic components. Transitions between the time and frequency domains were accomplished using fast Fourier transform (FFT) routines from the FFTW Library.
The diffraction operator was calculated for each harmonic component with the angular spectrum method. In this method, the complex pressure amplitude of the nth harmonic in the transverse plane at axial position z was transformed by FFT into a two-dimensional spectrum with spatial frequencies (kx,ky). In this notation, the spectrum represents complex amplitudes of plane waves that form the total field pn(z). The angular spectrum components at the next propagation step z + Δz were calculated by multiplying the spectrum at distance z by the corresponding plane wave propagator:
| (3) |
where kn = nω/c0 is the wavenumber of the nth harmonic.
The nonlinear operator was calculated using one of two algorithms. At small distances from the source, the integration was performed in the frequency domain using a fourth-order Runge–Kutta method for the set of nonlinear coupled equations for harmonic amplitudes:
| (4) |
where is the complex conjugate of harmonic amplitude pm [48]. The method is efficient when the number of harmonics N is relatively small because the computational costs are proportional to N2. To improve efficiency, additional harmonics were introduced gradually so that the amplitude of the highest harmonic in use is maintained at a threshold value of 10−6 p0, where p0 is the pressure amplitude at the source. As the steepness of the waveform increased and more harmonics were required, the nonlinear algorithm was adapted to use a conservative time-domain Godunov-type scheme [49]. The switch to the Godunov-type scheme was made at a distance z where the amplitude of the tenth harmonic exceeded 1% of the amplitude at the fundamental frequency. This value was chosen for computational efficiency, as it is the approximate level at which the Runge-Kutta method becomes slower than the Godunov-type scheme. The number of operations in the latter algorithm is proportional to the number of time points, so the simulations are more efficient for strongly distorted waveforms with many harmonics.
The main reason to switch to the Godunov-type scheme is its ability to automatically handle waveforms with shocks with high accuracy. When a shock forms, the Godunov-type scheme automatically provides 2–3 time grid points per shock [49]. To provide more control over the width of the shock (rise time), a mechanism of adaptive artificial absorption was implemented. As it is known from the general theory of nonlinear acoustic waves, the Taylor shock thickness depends on the diffusivity of the propagation medium [38]. Thus, to maintain the shock rise time at a given fixed level τsh, the diffusivity coefficient in the Westervelt equation (1) was increased at each spatial grid node by an additional artificial value δa introduced according to the following equation:
| (5) |
where Δpsh is the pressure jump across the shock defined as a difference between 0.1 and 0.9 levels of the peak positive pressure. Equation 5 corresponds to the exact analytic solution to the Burgers equation for the Taylor step-shock front[38]. The artificial diffusivity is therefore a spatial function determined by the presence and magnitude of the shock in the waveform at each spatial location. The shock thickness τsh was set to be equal to 7 steps of the time grid. The absorption and dispersion operator was then calculated in the frequency domain using an exact solution for each harmonic
| (6) |
where ωn is the angular frequency of the nth harmonic.
When shocks are present in weakly attenuating media, heating is primarily due to shock wave dissipation rather than linear attenuation [12]. An estimate for focal heating can be obtained from the pressure waveform based on the shock amplitude by
| (7) |
This expression is used to obtain an estimate for time-to-boil by tb = ΔT cv/qs, where ΔT is the necessary change in temperature to achieve boiling (in this case 80°C) and cv is the heat capacity. For modeling in water, the values of the physical parameters were chosen according to the experimental conditions: ρ0 = 998 kg/m3, c0 = 1485 m/s, β = 3.5, δ = 4.33 · 10−6 m2/s.
To derate pressure measurements acquired in water to in situ pressures when focusing at the depth L in liver, the source output voltage V was increased to compensate absorption losses following the previously proposed derating method: Vtissue = Vwater · exp (α(f0)L), where the attenuation was varied between α(f0) = 0.08−0.1 cm−1 or 0.7–0.9 dB/cm for the operating frequency f0 = 1 MHz [50].
E. Lesion generation in tissue
As a representative target tissue for boiling histotripsy, fresh bovine liver was acquired from a local abattoir and placed immediately in a bag on ice for transport. After 1 hour, the liver was cut into sections approximately 10 cm × 10 cm with thicknesses varying from 3–8 cm. These samples were placed in an open container of phosphate-buffered saline (PBS) and transferred to a bell jar degassing system evacuated to a pressure of ∼17 kPa. Samples were left under vacuum for at least 1 hour prior to use in experiments.
Following unrelated experiments for which all procedures were preapproved by our institutional animal care and use committee, fresh abdominal body wall sections were procured from porcine subjects. Body wall sections consisting of skin, fat, muscle, and fascia were excised en bloc. The body wall sections had a total thickness of 3–5 cm. Excised tissues were immediately submerged in a PBS solution and placed under vacuum in the bell jar for at least 1 hour prior to experiments.
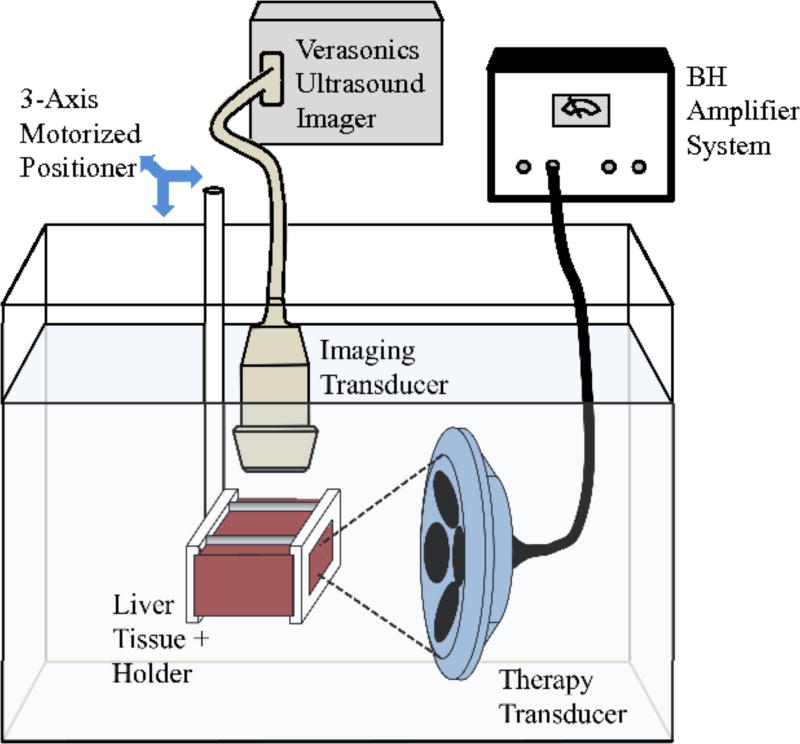
All experiments were conducted within 12 hours of sample preparation. To deliver BH exposures, the transducer was positioned in a degassed water bath, and the liver section was held in an acrylonitrile butadiene styrene (ABS) cage with openings that allowed direct contact of the liver sample with the surrounding water bath (Fig. 3). The transducer focus was aligned in the liver with the focus at a depth of either 18, 35, 50, 60, or 70 mm from the surface proximal to the transducer. An ultrasound imaging system (V1, Verasonics, Kirkland, WA) with a P4-2 imaging probe was aligned to visualize the axial-lateral plane of the therapy transducer in the vicinity of the focus in the liver sample and identify echogenicity in the focal region indicative of boiling [24, 51]. The focal area cannot be visualized during the pulse because of acoustic interference between the therapy output and imager, instead, echogenicity due to vapor bubbles remaining in the focal area is observed between the pulses.
Fig. 3.
Experimental apparatus for positioning the ex vivo liver tissue, therapy transducer, and imaging probe for identification of boiling. Transverse dimensions of tissue samples were the same (10 × 10 cm) with difference thicknesses up to 8 cm.
For experiments with the body wall, focal pressure waveforms were recorded with and without the intervening wall using the FOPH positioned in water at the focus, i.e., at the location of the greatest value of the peak positive pressure at VDC = 50 V as described in Section C. The body wall was placed between the array and the FOPH perpendicular to the array axis with the skin side facing the transducer and the fascial surface of the sample positioned at about 10 – 15 mm distance from the hydrophone. VDC was increased to compensate for losses in the body wall; the position of the FOPH was slightly adjusted for finding the maximum of the peak positive pressure, and the pressure waveforms were acquired in this location for the increasing power level. Scaling coefficient for the voltage was determined by measuring pressure amplitude at the focus at VDC = 10 V with and without the presence of the body wall. After waveform measurements were acquired, a liver sample was substituted for the FOPH, positioned adjacent to the body wall fascial surface.
To determine the in situ pressure levels at which boiling histotripsy lesions could be generated at each depth in liver, sonications were performed at different pressure outputs from the transducer. For each sonication, the transducer was set to output 60 acoustic pulses with a pulse duration of 10 ms (10,000 cycles) and a pulse repetition frequency (PRF) of 1 Hz. After a given exposure, the focus was translated laterally by 10 mm and a new exposure was performed at a different pressure amplitude. After all sonications in a sample were complete, the tissue was sectioned to locate and photograph the tissue at each location where an exposure occurred.
III. Results
A. Transducer and Driving System
The electrical driving system voltage and current output were measured to each element. The amplifier was operable up to a maximum level of VDC = 400 V, which translated to ∼1 kVpp across each of the seven elements after the impedance-transforming network. The corresponding pulse-average electrical power at this level was 25.9 kW. The amplifier draws current from the capacitors to provide this power during a pulse. As the power supply is not able to directly deliver ∼65A needed throughout the pulse at the highest power levels, VDC declines over the pulse duration. For this transducer, the voltage drop on the supply was approximately 14% over 10 ms. Some drop is unavoidable with such a configuration, although a higher capacitance or higher-current high-voltage power supply would be able to further minimize this change. The voltage waveform at the output of the amplifier was a unipolar square wave consisting of 104 cycles with 1 μs period, but the waveform at the transducer element input was nearly sinusoidal with the impedance-transforming network in line which lowers the fundamental impedance and raises the electrical impedance of the harmonics (Fig. 4). However, some harmonic content was present that was not completely filtered by the network. The largest harmonic signals in the voltage waveform were present at 3 MHz (−38 dB relative to the amplitude of the fundamental frequency) and 5 MHz (−25 dB). These harmonics were further filtered by the electromechanical response of the piezoelectric transducer elements: The focal acoustic waveform measured at the focus at lowest output amplitude of VDC = 2.5 V possessed a 5th harmonic component that was −60 dB relative to the fundamental frequency amplitude. Numerical simulation with a pure 1-MHz harmonic boundary condition at this output level predicted a −108 dB level for the 5th harmonic at the focus. Most of the super-harmonic amplitude in the measurements can therefore be attributed to driving electronics rather than to nonlinear acoustic propagation.
Fig. 4.

An example electrical impedance plot (a) for the center element with matching network. Change in the real (b) and imaginary (c) unmatched impedance of each element at 1 MHz over 1000 days.
Transducer electrical impedance measurements were recorded directly after fabrication, and then again at 600 days and 1000 days after fabrication. Over this time period, the transducer was used in boiling histotripsy experiments including several where it was driven at the maximum amplifier output. The electrical impedance of each element remained fairly constant over this time period. The relative impedance change for the 7 elements was 5±2%.The maximum change in any element was 12% (Fig. 4). Some variability in the transducer impedance is expected as piezoceramics are known to age by a similar amount [52]. These results indicate that the transducer is able to withstand driving the elements in this manner (up to 263 W/cm2 pulse average electrical intensity), and maintain a general degree of stability over a period of several years. It is difficult to determine the total operating time of the transducer over this period because it has been used in several studies. We estimate an average of 1 hour of active operation per week at a ≤3% duty factor.
B. Acoustic Field Characterization
A method combining measurements and modeling was performed to characterize the acoustic output of the system under nearly continuous-wave operation (ms-long pulses). Holography measurements were conducted at low output levels (VDC = 5V) to determine boundary conditions for modeling and elucidate how individual transducer elements vibrate. Holograms were measured for three different operating conditions: driving all elements with the same phase, driving only the central element, and driving only a single peripheral element. From the measured hologram for each condition, a source hologram was reconstructed to visualize the pattern of transducer vibrations (Fig. 5).
Fig. 5.
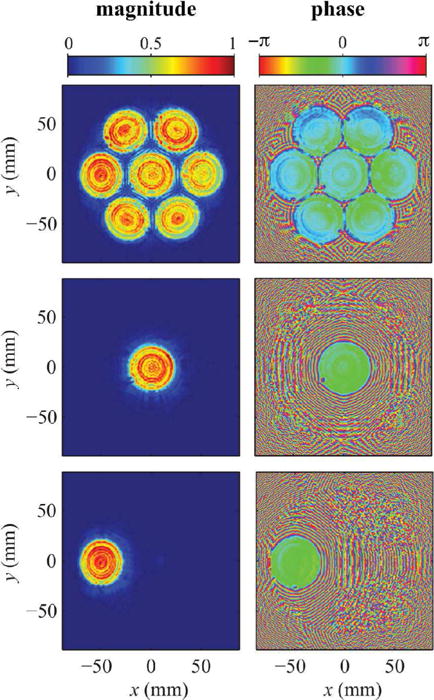
Source holograms reconstructed from low pressure measurements captured while operating the entire transducer (top), the center element only (middle), and a single peripheral element (bottom). Plotted pressure magnitudes were normalized by the maximum value, while phase is shown in radians. Note that these holograms were reconstructed on a spherical surface just in front of the housing to visualize transducer vibrations without needing to account distortions introduced by the integral lenses.
In the reconstructed source holograms, detailed features of the transducer vibrations can be readily identified. In both magnitude and phase plots, each transducer element is shown to vibrate in an axially symmetric, but non-uniform pattern. In addition, the phase plots in particular show a “dead” spot at the edge of each element where a solder connection was made. The holograms corresponding to operating conditions involving a single element demonstrate that little cross talk between elements occurs. However, the phase plot with all elements driven is axisymmetric about the central element in a way that suggests some interaction between elements.
To validate the method, the linear field measured with all elements operating was projected from the hologram and compared to pressure amplitudes measured independently at low power in the focal region of the beam. Results of this comparison are depicted in Fig. 6, which demonstrates that the hologram can serve as a model boundary condition that accurately captures the linear field in three dimensions. Discrepancies between the holographic representation and independent measurements of the focal region of the beam were on the order of 5% or less, within the uncertainty of the hydrophone calibration [44]. While the main diffraction lobe is symmetric in x and y directions in the focal plane, some difference is observed in the position of side lobes in the transverse structure of the beam due to asymmetry of the 7-element design of the array. In the x direction, which corresponds to the horizontal coordinate in Fig. 5 three elements of the array, the side lobes of ∼6% peak intensity are present nearest to the main focal peak at 2.5 mm from the axis. In the y direction, the horizontal coordinate in Fig. 5 crossing the central element of the array and passing between its outer elements, the side lobes of the same level are present at longer distance of 4 mm from the axis.
Fig. 6.
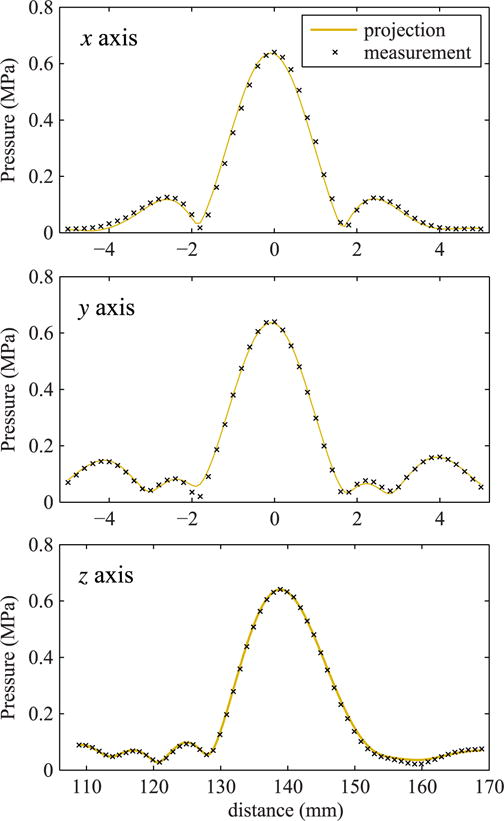
Comparison of beam scans over the main three axes in the focal region of the beam in water as measured directly at a low power level and linearly projected from the hologram measured with all elements operating. For this comparison, the projected field was scaled to reflect a 5.0 V output level for holography measurements versus a 2.5 V level for direct focal measurements. The z axis corresponds to the axis of beam propagation, while the x and y axes lie in the focal plane.
To extend the holography results for setting a boundary condition to nonlinear modeling, holography measurements were backpropagated to the plane z = 0 at which simulations start. Near-field pressure measurements conducted over a range of output levels were found to vary linearly with the transducer excitation voltage. The boundary condition therefore was scaled in magnitude proportionally to the voltage output level. The coefficient for linear scaling the holography data to acoustic pressure was determined as 3.51 ×10⁻⁷ V/Pa by matching peak pressures simulated and measured by FOPH at the focus in quasilinear regime of focusing. Using this scaling approach, driving voltages from 2.5–200 V yielded acoustic power levels from 0.72–4400 W. Various quantities that characterize the array output are given in Table 1. Characteristic value of intensity at the array elements were estimated assuming their uniform vibration and pressure and corresponding pressure level was calculated in a plane wave approximation.
TABLE I.
Values for comparison of output, including power supply voltage (VDC), measured peak-peak voltage on the transducer (Vpp), pulse-average acoustic power (Ppa), estimated surface pressure and intensity (p0 and I0), and peak focal pressure amplitudes (p+ and p−).
| VDC(V) | Vpp(V) | Ppa(W) | p0 (kPa) | I0 (W/m2) | p+ (kPa) | p− (kPa) |
|---|---|---|---|---|---|---|
| 2.5 | 6.3 | 0.72 | 12 | 48 | 763 | 718 |
| 5 | 12.6 | 2.8 | 24 | 192 | 1575 | 1397 |
| 10 | 25.3 | 11.2 | 48 | 767 | 3374 | 2650 |
| 50 | 126.3 | 271 | 238 | 19180 | 53003 | 96956 |
| 70 | 176.8 | 525 | 333 | 37600 | 76638 | 12149 |
| 75 | 189.4 | 593 | 358 | 43150 | 79705 | 12711 |
| 100 | 252.5 | 1063 | 477 | 76700 | 89813 | 15120 |
| 150 | 378.8 | 2346 | 715 | 172600 | 101289 | 18833 |
| 200 | 505 | 4400 | 954 | 306800 | 108161 | 21689 |
As shown in Fig. 7, representative waveforms, simulated and measured with the FOPH at the focus z = 140.9 mm agree very well at output levels that correspond to three different degrees of shock formation at the focus.
Fig. 7.
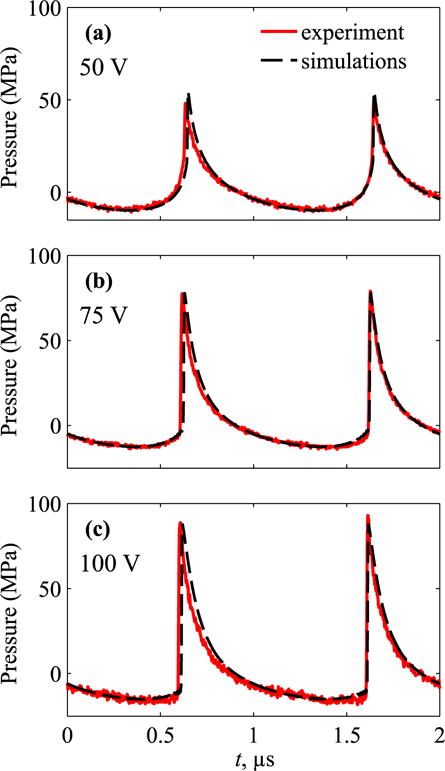
Pressure waveforms, measured and simulated at the focus at VDC = (a) 50 V, (b) 75 V, and (c) 100 V. The lowest voltage corresponds to the beginning of shock formation, 75 V is close to the condition that peak positive pressure is equal to the shock amplitude [1], and 100 V is near the beginning of acoustic saturation in water.
At VDC = 50 V (Fig. 7a) the shock has formed close to the positive peak of the waveform. The output of 75 V (Fig. 7b) corresponds to the regime of focusing when a “developed shock” has been established, which is indicated by the maximum ratio of the shock amplitude in the focal waveform to the initial pressure output at the transducer surface [1]. At this point, the shock amplitude is equal to the peak positive pressure. The shock amplitude is defined as a pressure jump between the time points at the threshold level of 0.025 from the maximum value of time derivative of the waveform [1]. By this definition, heat deposition calculated directly from modeling and Equation (7) yield the same values. With further increase of the output, 100 V (Fig. 7c), the bottom of the shock front shifts to negative pressure and therefore the shock amplitude becomes higher than the peak positive pressure.
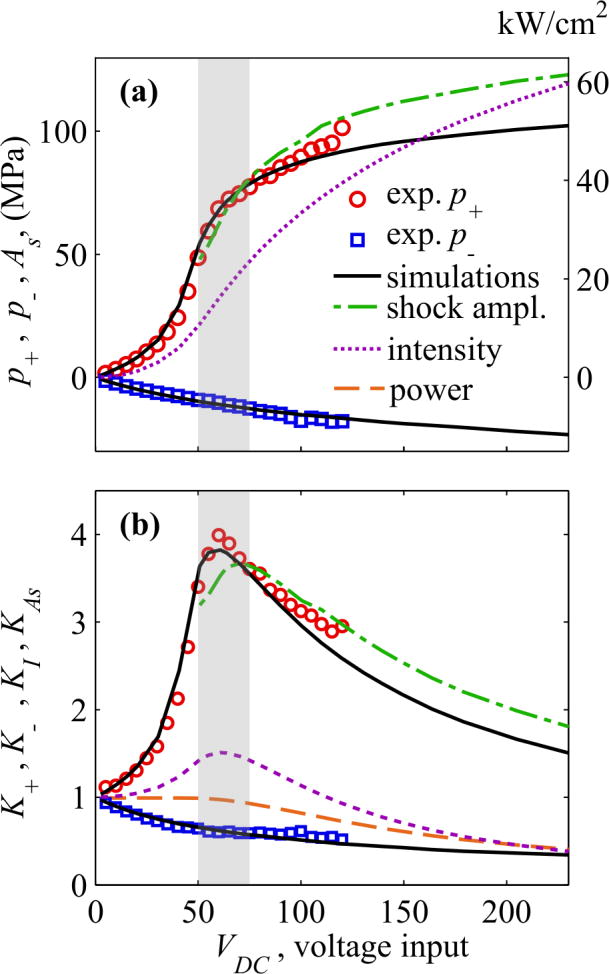
Comparative data and specific features of behavior of the total beam power, peak pressures, shock amplitude, and intensity at the focus over operational source output are depicted in detail in Fig. 8. The absolute value of the peak negative pressure (p−) grows with the source output (Fig. 8a), but slower than in the case of linear focusing [53]. This is illustrated by decreasing of the focusing gain K - relative to its linear value (Fig. 8b). For the peak positive pressure (p+), its magnitude and the focusing gain first grow with the source output until the shock first forms at the focus at VDC ∼ 50V (Fig. 7a). Further increase of the output yields to formation of the shock slightly prefocally leading to dissipation at the shock fronts while propagating to the focus and thus decrease of focusing gains and total power of the beam. VDC = 75 V corresponds to formation of fully developed shock at the focus. Maximum steepness of the curves for the focal intensity and peak positive pressure (Fig. 8a) and maximum of their focusing gains are observed in between these outputs VDC = 50 – 75 V [53].
Fig. 8.
(a) Peak pressures in acoustic waveform at the focus, measured (circles) and simulated (solid curves) at increasing transducer voltage. (b) - Change in the focusing gain for the peak pressures, measured (circles) and simulated (solid black line), normalized to the linear focusing gain. Corresponding simulation data are also shown for the shock amplitude (dashed green line), focal intensity (dashed purple line), and total beam power (thick dashed red line). The grey rectangular area indicates the source outputs at which a shock front forms (50 V) and at which developed shock is achieved (75 V). While focal measurements were limited to voltages below 125 V, simulations were possible to higher outputs within operational capabilities of the system.
At still greater output levels, saturation due to prefocal absorption at the shock occurs. A corresponding decrease of the total beam power and focusing gains for peak positive pressure, focal intensity, and shock amplitude is observed, as illustrated in Fig. 8b. The difference in the magnitudes of peak positive and negative pressures becomes smaller indicating less asymmetry of the focal waveform. Under this condition shocks form in the prefocal region, although with substantially lower amplitude (<10 MPa) compared to the focal volume.
Fig. 9 depicts distributions of peak pressures and intensity on the beam axis and two transverse axes in the focal plane for several characteristic values of VDC. Axial locations of the maxima of peak pressures shift noticeably from the focus z = 140.9 mm with increase of the source output (Fig. 9a). The maximum moves beyond the focus for p+ and toward the transducer for p−. The maximum reachable peak pressure values are 8% higher than at the geometric focus for p+ and 5% - for p− at 200 V output. This focal shift is not significant for intensity with less than 1% difference at the focus and at the maximum (Fig. 9d). Unequal values of the peak pressures at distances 100 – 120 mm for VDC = 200 V indicate that nonlinear effects become significant prior to the focus at these high output levels.
Fig. 9.
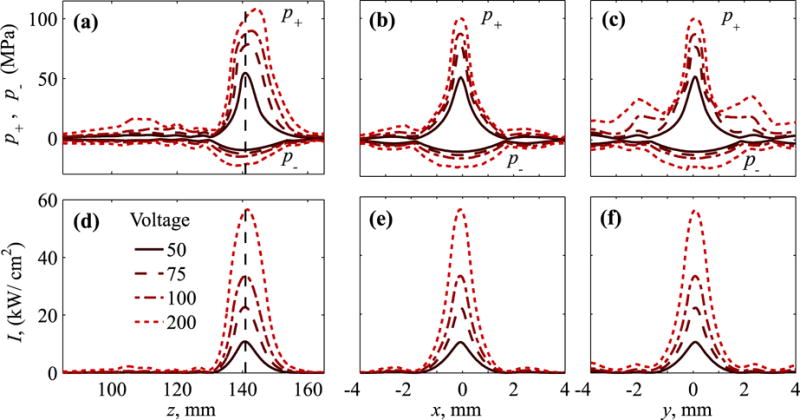
Distributions of the (a–c) peak positive, p+, and peak negative, p−, pressures and (d–f) intensity over beam axis (left frames) and in two perpendicular axes in the focal plane, x (center) and y (right) at increasing VDC = 50 − 200 V. Dashed vertical lines correspond to the location of the focus, z = 140.9 mm defined as a maximum of the peak positive pressure at 50 V.
As illustrated in Fig. 6, an asymmetric element distribution results in differences in the side lobes along x and y. This asymmetry is noticeably stronger for p+ at high output. Greater level of side lobes, adjacent to the focal lobe, is observed in y direction as compared to the x direction (Fig. 9b,c). Although noticeable, this effect is much weaker for intensity (Fig. 9e,f).
C. Lesions in liver
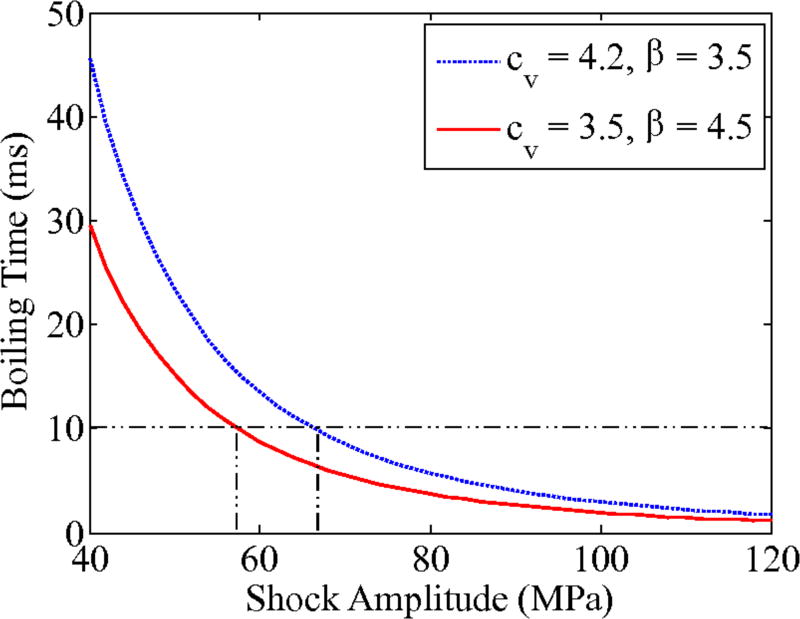
Source outputs to generate BH lesions in liver were estimated based on the analytic solution for shock wave heating (Equation 7) and properties of liver within the range of typical values [54]. Properties of water [cv = 4.2 × 10⁶ J/(°C m3) and β = 3.5] were chosen for estimation of the maximum shock amplitude, and for liver [cv = 3.5 × 10⁶ J/(°C m3) and β = 4.5] for the minimum shock amplitude. Fig. 10 indicates that for these two sets of values, boiling can be achieved in less than a pulse duration of 10 ms for in situ shock amplitudes of 58 – 66 MPa, corresponding to VDC = 66 – 72 V.
Fig. 10.
Calculated time-to-boil based on the analytic solution for shock-wave heating with cv = 4.2 × 10⁶J/(°C m3) and β = 3.5 (dashed blue line) and cv = 3.5 × 10⁶J/(°C m3) and β = 4.5 (solid red line). The figure indicates that boiling can be achieved in 10 ms (maximum pulse duration) for in situ shock amplitudes 58 – 66 MPa.
Liver samples were exposed to BH pulses at different depths of focusing and source outputs to identify a threshold for generating mechanical lesions. For experiments at 18 mm depth, exposures did not result in any grossly identifiable thermal or mechanical effect in the tissue when VDC ≤ 50 V. At a pressure level just above the predicted shock formation in tissue (VDC = 60 V), lesions were formed only in some exposures. The lesions displayed liquefaction of the tissue indicative of histotripsy, and tended to be relatively small with 1–2 mm lateral extent (Fig. 11, top). At greater pressure amplitudes for which boiling was predicted in tissue in less than 10 ms (VDC ≥ 70), large mechanical lesions were consistently formed (Fig. 11, bottom). These lesions had a tadpole shape, with a larger round shape ‘head’ region of about 5 mm diameter. Distal to this, a ‘tail’ was formed of only ∼1 mm width. This lesion geometry is consistent with previous observations of BH lesions at different frequencies[28].
Fig. 11.
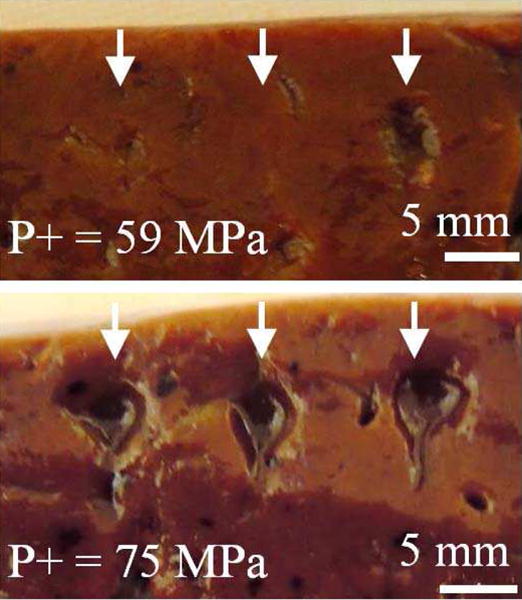
Photos of lesions at a shallow depth of focusing (18 mm) in liver. At outputs level near shock-forming conditions (top, VDC = 60 V), lesions form occasionally, while at greater source output (bottom, VDC = 70 V), corresponding to in situ shock amplitude sufficient to induce boiling in 10 ms, large, consistent lesions are observed.
Fig. 12 shows the probability of lesion formation at 18 mm focusing depth vs. VDC. Theoretically, it would be expected that a lesion will form when the shock-induced heating causes boiling faster than the duration of the pulse (10 ms), which corresponds to the estimated range of voltages VDC = 66 – 72 V depending on the tissue characteristics. These cases correspond to the maximum and minimum shock amplitudes that would occur at the derated outputs. Small differences in tissue properties may cause significant changes for the in situ shock amplitude. Thus, we considered a range of values for cv, β, and the effective attenuation αe between 0.7 and 0.9 dB/cm.
Fig. 12.
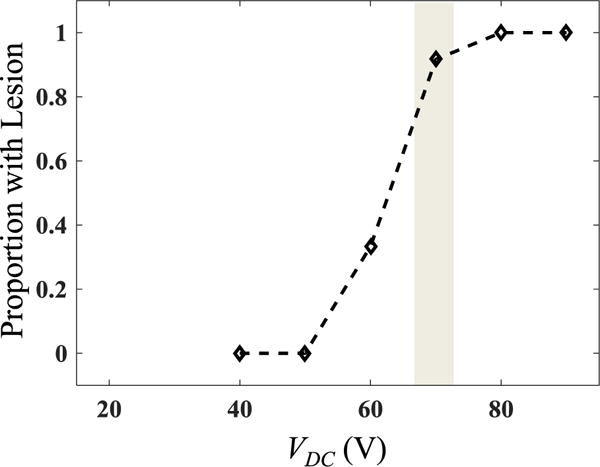
Experimental data for proportion of exposures at different driving voltages VDC that resulted in a lesion (n = 9–18 for each voltage level). The grey area corresponds to the range of voltages at which estimated boiling time is 10 ms at 18 mm depth in tissue, depending on tissue properties.
A total of 34 exposures were performed for greater depths between 35 mm – 70 mm to identify the minimum pressure levels needed to induce boiling. Under these conditions, the source driving voltage needed to form a lesion increased with depth (Fig. 13). The lowest values VDC at which boiling occurs for each depth were 60, 85, 100, 105, and 130 V at depths of 18, 35, 50, 60, and 70 mm depth, respectively. These values correspond to estimated in situ shock amplitudes between 57–78 MPa for αe = 0.7 dB/cm and between 53–71 MPa for αe = 0.9 dB/cm. Similar to experiments at 18 mm, certain pressure levels only caused boiling for a fraction of the identical exposures. For all cases at which boiling was visualized on US imaging, mechanical damage was observed on gross inspection at the site of the exposure. As can be seen in Fig. 13, most of these values are bracketed by the boiling range estimated from calculations.
Fig. 13.
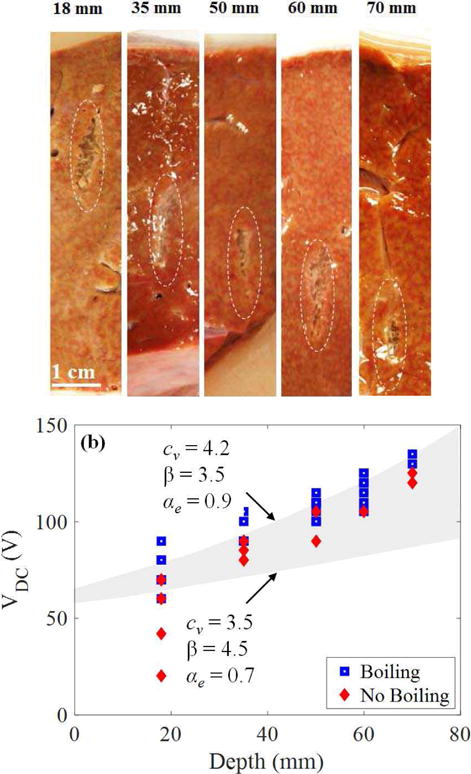
(a) Example lesions generated in liver through different thicknesses of tissue between 18 – 70 mm. Lesions contain a similar appearance of mechanical liquefaction of the tissue without thermal necrosis. (b) Data showing occurrence of boiling in tissue for different transducer driving voltages and depths. The grey-shaded area encompasses the range between lower and upper bounds for the predicted derating curves based on time-to-boil calculations. Boiling is expected to occur when VDC is greater or equal to a threshold estimated in the grey region.
Lesions were also generated in porcineex vivo liver samples through body wall sections (n = 4 body wall samples). Fig. 14 shows representative FOPH measurements of the peak focal pressures in water at different VDC with and without a 4-cm thick abdominal wall section. Also shown are comparative focal waveforms with the voltage adjusted to obtain the same peak positive pressure amplitudes when focusing in water and in the presence of the body wall. Under these conditions, the nonlinear waveform distortion is stronger and shock amplitude is somewhat larger because of the higher value of β in tissue compared to water. Similar peak pressure levels were achieved through the body wall when the voltage was adjusted for losses. Measurements indicated a derating factor, obtained from the ratio of pressures measured at quasilinear conditions (10 V) with and without body wall in place, to be 0.76 dB/cm or 0.068 Np/cm at 1 MHz. These experiments confirm previous results that inhomogeneities of the body wall do not prevent shock formation [12] in tissue and demonstrate the capability of the system to generate BH lesions in clinically relevant situations.
Fig. 14.
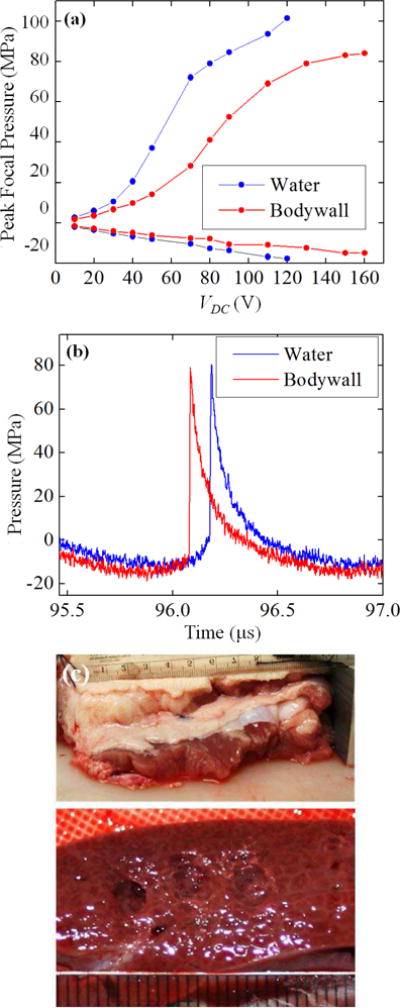
(a) Dependence of the peak focal pressures measured in water by FOPH in the absence (solid curve) and presence (dashed curve) of the porcine body wall of 4 cm thickness, placed 1.5 cm in front of the focus versus input voltage. (b) Focal waveforms corresponding to the threshold of BH lesion formation in porcine liver without the body wall in place (VDC = 80 V) and with body wall (VDC = 150 V). (c) Photograph of the body wall (top) and the BH lesions formed in porcine liver through the body wall at 150 V(bottom).
IV. Discussion
The transducer and electronics described in this article demonstrate a step towards a boiling histotripsy system that can effectively perform transcutaneous mechanical tissue ablation. While previous efforts have examined the morphologic and histologic characteristics of BH lesions [15], these studies were performed without intervening tissue using commercial linear amplifiers. However, few amplifiers of this type are available in the frequency and power range needed for transcutaneous boiling histotripsy. The design in this article used a switching amplifier to achieve high pulsed power levels with minimal cost and weight, with a tradeoff of some harmonic distortion. The results of the present study show that BH lesions can be produced through significant thicknesses of tissue and inhomogeneous layers for clinical applications that treat deep-seated tissue structures such as liver or kidney tumors.
A challenge with performing boiling histotripsy lies in achieving the sufficiently high in situ shock amplitudes for the duration required to generate boiling within milliseconds. Time-to-boil is proportionate to the cube of shock amplitude and inversely proportionate to the operating frequency of the transducer. Recent studies have shown that characteristic shock amplitudes at the focus are controlled by the F-number of the transducer [1]. Lower F-number transducers produce shocks with greater amplitude. For transducers of F-number = 1, the amplitude of the developed shock is about 76 MPa. In the earlier study, with such a transducer operated at 2 MHz, Canney et al. found that boiling in excised liver can be reached in 5 ms at a derated shock amplitude of 70 MPa and corresponding in situ intensity of 20 kW/cm2. As heating rate corresponds to the rate at which shocks are applied, it is therefore expected that the time-to-boil at 1 MHz would be twice as long for the same shock amplitude. In the present study, at 1 MHz, lesions were repeatedly generated within 10 ms at in situ shock amplitude of 65 MPa and focal intensities of 17 kW/cm2, in accordance with the anticipated heating. These data provide further evidence that such calculations can provide a good estimate of necessary outputs to achieve boiling in considering future BH designs.
Characterization of the system was performed using a previously developed method combining measurements and modeling [35]. Holography was used to reconstruct the distribution of vibrational velocity at the surface of the transducer [44]. This distribution was used as a boundary condition to nonlinear modeling. Then simulations were performed to characterize nonlinear ultrasound fields generated by the transducer at increasing output levels. Modeling results were validated with independent focal measurements of pressure waveforms. While measurements were possible up to 9% of the highest system power because of cavitation, simulations provided characterization data within the whole operational power range. The holography data also serves to visualize the vibrational pattern of the transducer to ensure the quality of its fabrication.
With the introduction of larger attenuating tissue paths the necessary transducer surface pressure (and power output) increases substantially while the focal pressure requirements remain the same. For instance, the pulse-average acoustic power needed to repeatedly create a lesion at 18 mm depth was 525 W, while the acoustic power needed at 70 mm depth was 1.86 kW. Lesion generation through 4-cm porcine body wall required 2.48 kW. Clinical HIFU systems have been primarily focused on thermal ablation, which requires greater time-averaged power but lower peak power than that in histotripsy. At the present no clinically available systems can output such power levels for sustained pulses, and therefore the amplifier here offers a method to investigate generation of lesions by BH ex vivo and in vivo. The amplifier, the basis for which was proposed by Umemura [55] and modified by Hall and Cain [33], forms the foundation of a system to generate high peak power output. The additional capacitive energy storage was engineered to allow longer pulse durations consistent with the range needed for BH. The transducer’s key features were the appropriate F-number and focal gain to achieve specific shock amplitudes, and the design that is mechanically robust, using a matching layer and lens configuration. The consistency of the transducer output over its lifetime of nearly 3 years indicates that the transducers can also be made to perform reliably. Given these results, the present system is an acceptable prototype for research. However, the lack of in-line image guidance and coupling capabilities preclude it as a clinically viable instrument. Future efforts will focus on translating these results into a system for preclinical and clinical trials.
We hypothesized that shock development progresses in a qualitatively similar manner through tissue compared with water, such that the same shocked waveform can be generated in both situations by adjusting the output of the ultrasound source using a previously developed derating approach to compensate for losses while propagating through tissue [50]. The peak focal pressure follows a similar curve vs. surface pressure, but the curve is extended such that a given value of peak focal pressure occurs at a higher surface pressure. The data collected by generating lesions in liver at different depths, as well as hydrophone measurements through body wall layers support such a relationship. Modeling with the Westervelt equation indicated a trend in the presence of tissue with αe = 0.7 − 0.9 dB/cm/MHz. This range of values is based on previous experiences measuring highly focused waveforms through liver samples, although does not reflect the true plane-wave attenuation in the sample as the actual path lengths of the beam to the focus vary with focusing angle. While the predictive value of such a method may provide an initial estimate of the necessary transducer output needed for a given treatment, it will be practically difficult to predict a priori what the effective attenuation will be through a complex tissue path such as the body wall in vivo. With multiple layers, aberration would introduce an additional derating factor. However, these losses can be compensated by further increase of the output power, as shown with the body wall example, provided the losses are not too great. In addition, as shock amplitude changes slowly with transducer output after a developed shock is formed, operating at higher outputs levels can be beneficial for reliable lesion generation. Nonetheless, based on the modeling and measurements recorded in this study, one could reasonably expect to test transducer output and proceed stepwise to reach a threshold using ultrasound image feedback to reach boiling.
V. Conclusion
Boiling histotripsy has been previously performed in samples without intervening tissue. Here we demonstrated a system, including a high-power pulsed amplifier and 1 MHz therapy transducer for BH that can generate lesions through significant depths of tissue including propagation through the body wall. In situ pressure levels at which boiling and lesions were detected in liver samples agreed well with predicted time-to-boil based on characterization of the shock-wave field generated by the system and tissue heating. Generation of lesions at different tissue depths required increased power levels that could be fit to a derating scheme for highly focused HIFU beams. With 7 cm focal depth in liver tissue, BH lesions could be generated at 11% of the maximum acoustic power output of the transducer. Propagation through inhomogeneous porcine body wall required operating at 14% of the system power capabilities and did not prevent formation of shock fronts and generation of BH lesions. These results demonstrate the system’s capability to perform BH through clinically relevant tissue paths.
Acknowledgments
We appreciate the help of our colleagues at UW in Urology, the Center for Industrial and Medical Ultrasound, and Gastroenterology. Simulations were performed on the “Lomonosov” cluster of the Moscow State University supercomputer center. Disclosure: Dr. A. Maxwell and Dr. M. Bailey have financial interests with SonoMotion, Inc.
This work is supported by NIH NIBIB EB007643, K01 EB015745 and NIH NIDDK P01 DK43881, K01 DK104854, and T32 DK007779, Russian Science Foundation 14-12-00974, and NSBRI through NASA NCC 9-58.
Biographies

Adam D. Maxwell received a B.S. degree in electrical engineering from University of Washington in 2006, an M.S. degree in electrical engineering in 2007, and a Ph.D. in biomedical engineering in 2012, both from the University of Michigan. From 2012 to 2014, he was a postdoctoral fellow in the Department of Urology at the University of Washington. He is currently a Research Assistant Professor in the same department. His research involves development of image-guided ultrasound therapies including focused ultrasound for mechanical tissue ablation (histotripsy) and lithotripsy.
Petr V. Yuldashev received an M.S. degree in physics in 2008 and a Ph.D. degree in acoustics in 2011 from Moscow State University (MSU), Moscow, Russia. He also received a Ph.D. degree in acoustics from École Centrale de Lyon (ECL), Ecully, France, according to the double Ph.D. program of the French Government. After graduation from the Ph.D. program, he was appointed by Moscow State University and currently is a Senior Research Fellow in the Department of General Physics and Condensed Matter Physics of the Physics Faculty of MSU. He also is affiliated with the Department of Fluid Mechanics, Acoustics, and Energetics of ECL to work on the propagation of shock waves in a turbulent atmosphere and the utilization of nonlinear acoustics effects to calibrate high-frequency broadband microphones. His research interests pertain to nonlinear acoustics, shock wave focusing, nonlinear wave propagation in inhomogeneous media, sonic booms, nonlinear modeling, and shadowgraphy measurement methods for acoustic phenomena
Wayne Kreider earned B.S. and M.S. degrees in engineering mechanics at Virginia Tech, Blacksburg, VA, in 1993 and 1995, respectively. He worked as an engineer at the Naval Surface Warfare Center, Dahlgren, VA, from 1996 to 1997, and at Dominion Engineering Inc., Reston, VA, from 1997 to 2001. In 2000, he became a licensed Professional Engineer in the Commonwealth of Virginia. Much of his work during this time focused on the development and qualification of ultrasonic cleaning technologies for steam generators and fuel in nuclear power plants. Since 2001, he has worked at the Center for Industrial and Medical Ultrasound in the Applied Physics Laboratory (APL) at the University of Washington in Seattle as a student (Ph.D., 2008, bioengineering), a Research Associate, and a Senior Engineer (since 2012). His research interests include acoustic cavitation, transport processes in oscillating bubbles, therapeutic ultrasound, and ultrasound metrology. Related to the characterization of intense ultrasound fields, he is a U.S. delegate to the International Electrotechnical Commission (IEC) as a member of Technical Committee 87, Working Group 6 (since 2015). Also, as a member of the Acoustical Society of America (ASA), he serves on the Committee on Standards as a technical representative (since 2013).

Tatiana D. Khokhlova received her Ph.D. degree in physics in 2008 from Moscow State University (MSU), Moscow, Russia. After graduation from the Ph.D. program Dr. Khokhlova moved to the University of Washington (UW) in Seattle for postdoctoral training at Applied Physics Laboratory, and then completed a research fellowship at the Department of Medicine, UW. Dr. Khokhlova is currently Research Assistant Professor at the Department of Medicine, UW. Her research interests are in physical acoustics, therapeutic ultrasound and photoacoustic imaging.
George R. Schade completed his undergraduate and M.D. degrees at The University of Chicago. He then completed his Urology residency at the University of Michigan where he developed an interest in therapeutic ultrasound. Following residency, he moved to the University of Washington, where he completed a Society of Urologic Oncology fellowship and then joined the faculty, as an Assistant Professor in the Department of Urology. He is a practicing Urologic Oncologist who aims to develop diagnostic and therapeutic ultrasound to improve the care of patients with Urologic cancers.
Timothy L. Hall received his PhD from the University of Michigan, Ann Arbor in 2007. He is one of the original developers of histotripsy ultrasound therapy. His major research interests are in instrumentation for acoustics and lithotripsy and furthering medical applications for histotripsy.
Oleg A. Sapozhnikov received his M.S. degree in physics in 1985 and Ph.D. and D.Sc. degrees in acoustics in 1988 and 2008, respectively, from Moscow State University (MSU), Moscow, Russia. After graduation from the Ph.D. program he was appointed by Moscow State University and currently is a Professor in the Department of Acoustics of the Physics Faculty of MSU. Starting from 1996, Prof. Sapozhnikov is also affiliated with the Center for Industrial and Medical Ultrasound in the Applied Physics Laboratory (APL) at the University of Washington in Seattle. His research interests are in the fields of physical acoustics, nonlinear wave phenomena, medical ultrasound including shock wave lithotripsy, high intensity focused ultrasound, and ultrasound-based imaging. He has been awarded by M.V. Lomonosov Prize in Physics (1991), a Prize of the European Academy for Young Russian Scientists (1994), and an Early Career Award of the International Commission for Acoustics (2004). He is a Member of the International Society for Therapeutic Ultrasound (since 2001); a Member of the Board of the International Congress on Ultrasonics (since 2008); a Head of the “Physical Ultrasound” division of the Scientific Council on Acoustics of the Russian Academy of Sciences (since 2009); and a Fellow (since 2009) and an Associate Editor of the Journal of the Acoustical Society of America (since 2007).

Michael R. Bailey received his B.S. degree in 1991 from Yale and his M.S. and Ph.D. degrees in 1994 and 1997, respectively, from the University of Texas at Austin, all in mechanical engineering. He is currently a Senior Principal Engineer at the Applied Research Laboratory, an Associate Professor of Mechanical Engineering, and Adjunct Associate Professor of Urology at the University of Washington. His research interests include cavitation, shock wave lithotripsy, HIFU, and ultrasound imaging; currently his energy is focused on developing ultrasound-based technology to reposition kidney stones. He has been a Fellow of the Acoustical Society of America (ASA) since 2007 and currently serves on the ASA Executive Council. He served on the Board of the International Society for Therapeutic Ultrasound (ISTU) from 2009 to 2012, the Bioeffects Committee of the American Institute for Ultrasound in Medicine from 2006 to 2012, and the Biomedical Acoustics Technical Committee of the ASA from 2005 to 2008. He received Early Career Awards from ASA in 2004 and ISTU in 2008.

Vera A. Khokhlova received her M.S. degree in physics in 1986 and Ph.D. and D.Sc. degrees in acoustics in 1991 and 2012, respectively, from Moscow State University (MSU), Moscow, Russia. After graduation from the Ph.D. program she was appointed by the Moscow State University and currently is an Associate Professor at the Department of Acoustics of the Physics Faculty of MSU. Starting from 1995 she is also affiliated with the Center for Industrial and Medical Ultrasound of the Applied Physics Laboratory (APL) at the University of Washington in Seattle. Her research interests are in the field of nonlinear acoustics, therapeutic ultrasound including metrology and bioeffects of high intensity focused ultrasound fields, shock wave focusing, nonlinear wave propagation in inhomogeneous media, and nonlinear modeling. She is a Fellow (since 2008) and has served as a Member of the Executive Council of the Acoustical Society of America (2012–2015); a Member of the Board of the International Society for Therapeutic Ultrasound (2004 – 2008, 2011 – 2014), a Member of the “Physical Ultrasound” division of the Scientific Council on Acoustics of the Russian Academy of Sciences (since 2009), and an Associate Editor of the IEEE Transactions on UFFC (since 2013).
Contributor Information
Adam D. Maxwell, Dept. of Urology, University of Washington School of Medicine, Seattle, WA.
Petr V. Yuldashev, Physics Faculty, M.V. Lomonosov Moscow State University, Moscow, Russia
Wayne Kreider, Center for Industrial and Medical Ultrasound, Applied Physics Laboratory, University of Washington, Seattle, WA.
Tatiana D. Khokhlova, Dept. of Gastroenterology, University of Washington School of Medicine, Seattle, WA
George R. Schade, Dept. of Urology, University of Washington School of Medicine, Seattle, WA
Timothy L. Hall, Dept. of Biomedical Engineering, University of Michigan, Ann Arbor, MI
Oleg A. Sapozhnikov, Center for Industrial and Medical Ultrasound, Applied Physics Laboratory, University of Washington, Seattle, WA; Physics Faculty, M.V. Lomonosov Moscow State University, Moscow, Russia
Michael R. Bailey, Center for Industrial and Medical Ultrasound, Applied Physics Laboratory, University of Washington, Seattle, WA
Vera A. Khokhlova, Center for Industrial and Medical Ultrasound, Applied Physics Laboratory, University of Washington, Seattle, WA; Physics Faculty, M.V. Lomonosov Moscow State University, Moscow, Russia
References
- 1.Rosnitskiy PB, Yuldashev PV, Khokhlova VA. Effect of the angular aperture of medical ultrasound transducers on the parameters of nonlinear ultrasound field with shocks at the focus. Acoust Phys. 2015;61:301–307. [Google Scholar]
- 2.Kennedy JE, Wu F, ter Haar GR, Gleeson FV, Phillips RR, Middleton MR, Cranston D. High-intensity focused ultrasound for the treatment of liver tumours. Ultrasonics. 2004;42:931–5. doi: 10.1016/j.ultras.2004.01.089. [DOI] [PubMed] [Google Scholar]
- 3.Wu F, Wang ZB, Chen WZ, Zhu H, Bai J, Zou JZ, Li KQ, Jin CB, Xie FL, Su HB. Extracorporeal high intensity focused ultrasound ablation in the treatment of patients with large hepatocellular carcinoma. Ann Surg Oncol. 2004;11:1061–9. doi: 10.1245/ASO.2004.02.026. [DOI] [PubMed] [Google Scholar]
- 4.Chaussy C, Thuroff S. High-intensity focused ultrasound in the management of prostate cancer. Expert Rev Med Devices. 2010;7:209–17. doi: 10.1586/erd.09.66. [DOI] [PubMed] [Google Scholar]
- 5.Hsiao Y-H, Kuo S-J, Tsai H-D, Chou M-C, Yeh G-P. Clinical application of high-intensity focused ultrasound in cancer therapy. J Cancer. 2016;7:225–231. doi: 10.7150/jca.13906. [DOI] [PMC free article] [PubMed] [Google Scholar]
- 6.Zhou Y, Kargl SG, Hwang JH. The effect of the scanning pathway in high-intensity focused ultrasound therapy on lesion production. Ultrasound Med Biol. 2011;37:1457–1468. doi: 10.1016/j.ultrasmedbio.2011.05.848. [DOI] [PubMed] [Google Scholar]
- 7.Jung SE, Cho SH, Jang JH, Han JY. High-intensity focused ultrasound ablation in hepatic and pancreatic cancer: Complications. Abdom Imaging. 2011;36:185–95. doi: 10.1007/s00261-010-9628-2. [DOI] [PubMed] [Google Scholar]
- 8.Quesson B, Laurent C, Maclair G, de Senneville BD, Mougenot C, Ries M, Carteret T, Rullier A, Moonen CT. Real-time volumetric mri thermometry of focused ultrasound ablation in vivo: A feasibility study in pig liver and kidney. NMR Biomed. 2011;24:145–53. doi: 10.1002/nbm.1563. [DOI] [PubMed] [Google Scholar]
- 9.Dasgupta S, Banerjee RK, Hariharan P, Myers MR. Beam localization in hifu temperature measurements using thermocouples, with application to cooling by large blood vessels. Ultrasonics. 2011;51:171–80. doi: 10.1016/j.ultras.2010.07.007. [DOI] [PubMed] [Google Scholar]
- 10.Hariharan P, Myers MR, Banerjee RK. Hifu procedures at moderate intensities–effect of large blood vessels. Phys Med Biol. 2007;52:3493–513. doi: 10.1088/0031-9155/52/12/011. [DOI] [PubMed] [Google Scholar]
- 11.Kieran K, Hall TL, Parsons JE, Wolf JS, Jr, Fowlkes JB, Cain CA, Roberts WW. Refining histotripsy: Defining the parameter space for the creation of nonthermal lesions with high intensity, pulsed focused ultrasound of the in vitro kidney. J Urology. 2007;178:672–676. doi: 10.1016/j.juro.2007.03.093. [DOI] [PubMed] [Google Scholar]
- 12.Canney MS, Khokhlova VA, Bessonova OV, Bailey MR, Crum LA. Shock-induced heating and millisecond boiling in gels and tissue due to high intensity focused ultrasound. Ultrasound Med Biol. 2010;36:250–267. doi: 10.1016/j.ultrasmedbio.2009.09.010. [DOI] [PMC free article] [PubMed] [Google Scholar]
- 13.Hoogenboom M, Eikelenboom D, den Brok MH, Heerschap A, Futterer JJ, Adema GJ. Mechanical high-intensity focused ultrasound destruction of soft tissue: Working mechanisms and physiologic effects. Ultrasound Med Biol. 2015;41:1500–17. doi: 10.1016/j.ultrasmedbio.2015.02.006. [DOI] [PubMed] [Google Scholar]
- 14.Khokhlova VA, Fowlkes JB, Roberts WW, Schade GR, Xu Z, Khokhlova TD, Hall TL, Maxwell AD, Wang YN, Cain CA. Histotripsy methods in mechanical disintegration of tissue: Towards clinical applications. Int J Hyperthermia. 2015;31:145–62. doi: 10.3109/02656736.2015.1007538. [DOI] [PMC free article] [PubMed] [Google Scholar]
- 15.Wang Y-N, Khokhlova T, Bailey M, Hwang JH, Khokhlova V. Histological and biochemical analysis of mechanical and thermal bioeffects in boiling histotripsy lesions induced by high intensity focused ultrasound. Ultrasound Med Biol. 2013;39:424–438. doi: 10.1016/j.ultrasmedbio.2012.10.012. [DOI] [PMC free article] [PubMed] [Google Scholar]
- 16.Winterroth F, Xu Z, Wang T-Y, Wilkinson JE, Fowlkes JB, Roberts WW, Cain CA. Examining and analyzing subcellular morphology of renal tissue treated by histotripsy. Ultrasound Med Biol. 37:78–86. doi: 10.1016/j.ultrasmedbio.2010.10.002. [DOI] [PMC free article] [PubMed] [Google Scholar]
- 17.Xu Z, Fan Z, Hall TL, Winterroth F, Fowlkes JB, Cain CA. Size measurement of tissue debris particles generated from pulsed ultrasound cavitational therapy-histotripsy. Ultrasound Med Biol. 2009;35:245–55. doi: 10.1016/j.ultrasmedbio.2008.09.002. [DOI] [PMC free article] [PubMed] [Google Scholar]
- 18.Schade GR, Styn NR, Hall TL, Roberts WW. Endoscopic assessment and prediction of prostate urethral disintegration after histotripsy treatment in a canine model. J Endourol. 2012;26:183–9. doi: 10.1089/end.2011.0349. [DOI] [PMC free article] [PubMed] [Google Scholar]
- 19.Roberts WW, Hall TL, Ives K, Wolf JJS, Fowlkes JB, Cain CA. Pulsed cavitational ultrasound: A noninvasive technology for controlled tissue ablation (histotripsy) in the rabbit kidney. J Urology. 2006;175:734–738. doi: 10.1016/S0022-5347(05)00141-2. [DOI] [PubMed] [Google Scholar]
- 20.Khokhlova TD, Canney MS, Khokhlova VA, Sapozhnikov OA, Crum LA, Bailey MR. Controlled tissue emulsification produced by high intensity focused ultrasound shock waves and millisecond boiling. J Acoust Soc Am. 2011;130:3498–510. doi: 10.1121/1.3626152. [DOI] [PMC free article] [PubMed] [Google Scholar]
- 21.Maxwell AD, Hsi RS, Bailey MR, Casale P, Lendvay TS. Noninvasive ureterocele puncture using pulsed focused ultrasound: An in vitro study. J Endourol. 2014;28:342–6. doi: 10.1089/end.2013.0528. [DOI] [PMC free article] [PubMed] [Google Scholar]
- 22.Vlaisavljevich E, Kim Y, Owens G, Roberts W, Cain C, Xu Z. Effects of tissue mechanical properties on susceptibility to histotripsy-induced tissue damage. Phys Med Biol. 2014;59:253–70. doi: 10.1088/0031-9155/59/2/253. [DOI] [PMC free article] [PubMed] [Google Scholar]
- 23.Hall TL, Kieran K, Ives K, Fowlkes JB, Cain CA, Roberts WW. Histotripsy of rabbit renal tissue in vivo: Temporal histologic trends. J Endourol. 2007;21:1159–66. doi: 10.1089/end.2007.9915. [DOI] [PubMed] [Google Scholar]
- 24.Khokhlova TD, Wang YN, Simon JC, Cunitz BW, Starr F, Paun M, Crum LA, Bailey MR, Khokhlova VA. Ultrasound-guided tissue fractionation by high intensity focused ultrasound in an in vivo porcine liver model. Proc Natl Acad Sci U S A. 2014 Jun 3;111:8161–6. doi: 10.1073/pnas.1318355111. [DOI] [PMC free article] [PubMed] [Google Scholar]
- 25.Xu Z, Ludomirsky A, Eun LY, Hall TL, Tran BC, Fowlkes JB, Cain CA. Controlled ultrasound tissue erosion. IEEE Trans Ultrason Ferroelectr Freq Control. 2004 Jun;51:726–36. doi: 10.1109/tuffc.2004.1308731. [DOI] [PMC free article] [PubMed] [Google Scholar]
- 26.Maxwell AD, Cain CA, Duryea AP, Yuan L, Gurm HS, Xu Z. Noninvasive thrombolysis using pulsed ultrasound cavitation therapy - histotripsy. Ultrasound Med Biol. 2009;35:1982–1994. doi: 10.1016/j.ultrasmedbio.2009.07.001. [DOI] [PMC free article] [PubMed] [Google Scholar]
- 27.Canney MS, Khokhlova VA, Bessonova OV, Bailey MR, Crum LA. Shock-induced heating and millisecond boiling in gels and tissue due to high intensity focused ultrasound. Ultrasound Med Biol. 2010;36:250–67. doi: 10.1016/j.ultrasmedbio.2009.09.010. [DOI] [PMC free article] [PubMed] [Google Scholar]
- 28.Khokhlova TD, Canney MS, Khokhlova VA, Sapozhnikov OA, Crum LA, Bailey MR. Controlled tissue emulsification produced by high intensity focused ultrasound shock waves and millisecond boiling. J Acoust Soc Am. 2011;130:3498–3510. doi: 10.1121/1.3626152. [DOI] [PMC free article] [PubMed] [Google Scholar]
- 29.Parsons JE, Cain CA, Abrams GD, Fowlkes JB. Pulsed cavitational ultrasound therapy for controlled tissue homogenization. Ultrasound Med Biol. 2006;32:115–129. doi: 10.1016/j.ultrasmedbio.2005.09.005. [DOI] [PubMed] [Google Scholar]
- 30.Maxwell AD, Wang T-Y, Cain CA, Fowlkes JB, Sapozhnikov OA, Bailey MR, Xu Z. Cavitation clouds created by shock scattering from bubbles during histotripsy. J Acoust Soc Am. 2011;130:1888–1989. doi: 10.1121/1.3625239. [DOI] [PMC free article] [PubMed] [Google Scholar]
- 31.Xu Z, Fowlkes JB, Rothman ED, Levin AM, Cain CA. Controlled ultrasound tissue erosion: The role of dynamic interaction between insonation and microbubble activity. J Acoust Soc Am. 2005;117:424–435. doi: 10.1121/1.1828551. [DOI] [PMC free article] [PubMed] [Google Scholar]
- 32.Simon JC, Sapozhnikov OA, Khokhlova VA, Wang YN, Crum LA, Bailey MR. Ultrasonic atomization of tissue and its role in tissue fractionation by high intensity focused ultrasound. Phys Med Biol. 2012;57:8061–78. doi: 10.1088/0031-9155/57/23/8061. [DOI] [PMC free article] [PubMed] [Google Scholar]
- 33.Hall T, Cain C. A low cost compact 512 channel therapeutic ultrasound system for transcutaneous ultrasound surgery. AIP Conf Proc. 2006;829:445–449. [Google Scholar]
- 34.Kim Y, Maxwell AD, Hall TL, Xu Z, Lin KW, Cain CA. Rapid prototyping fabrication of focused ultrasound transducers. IEEE Trans Ultrason Ferroelectr Freq Control. 2014;61:1559–74. doi: 10.1109/TUFFC.2014.3070. [DOI] [PubMed] [Google Scholar]
- 35.Kreider W, Yuldashev PV, Sapozhnikov OA, Farr N, Partanen A, Bailey MR, Khokhlova VA. Characterization of a multi-element clinical hifu system using acoustic holography and nonlinear modeling. IEEE Trans Ultrason Ferroelectr Freq Control. 2013;60 doi: 10.1109/TUFFC.2013.2750. [DOI] [PMC free article] [PubMed] [Google Scholar]
- 36.Sapozhnikov OA, Pishchal’nikov YA, Morozov AV. Reconstruction of the normal velocity distribution on the surface of an ultrasonic transducer from the acoustic pressure measured on a reference surface. Acoust Phys. 2003;49:354–360. [Google Scholar]
- 37.Yuldashev PV, Khokhlova VA. Simulation of three-dimensional nonlinear fields of ultrasound therapeutic arrays. Acoust Phys. 2011;57:334–343. doi: 10.1134/S1063771011030213. [DOI] [PMC free article] [PubMed] [Google Scholar]
- 38.Hamilton MF, Blackstock DT. Nonlinear acoustics. San Diego: Academic Press; 1998. [Google Scholar]
- 39.Maxwell AD. PhD Dissertation. Biomedical Engineering, University of Michigan; Ann Arbor: 2012. Noninvasive thrombolysis using histotripsy pulsed ultrasound cavitation therapy. [Google Scholar]
- 40.Staudenraus J, Eisenmenger W. Fibre-optic probe hydrophone for ultrasonic and shock-wave measurements in water. Ultrasonics. 1993;31:267–273. [Google Scholar]
- 41.Canney MS, Bailey MR, Crum LA, Khokhlova VA, Sapozhnikov OA. Acoustic characterization of high intensity focused ultrasound fields: A combined measurement and modeling approach. J Acoust Soc Am. 2008;124:2406–2420. doi: 10.1121/1.2967836. [DOI] [PMC free article] [PubMed] [Google Scholar]
- 42.Yuldashev PV, Shmeleva SM, Ilyin SA, Sapozhnikov OA, Gavrilov LR, Khokhlova VA. The role of acoustic nonlinearity in tissue heating behind a rib cage using a high-intensity focused ultrasound phased array. Phys Med Biol. 2013;58:2537–59. doi: 10.1088/0031-9155/58/8/2537. [DOI] [PMC free article] [PubMed] [Google Scholar]
- 43.Sapozhnikov OA, Ponomarev AE, Smagin MA. Transient acoustic holography for reconstructing the particle velocity of the surface of an acoustic transducer. Acoust Phys. 2006;52:324–330. [Google Scholar]
- 44.Sapozhnikov OA, Tsysar SA, Khokhlova VA, Kreider W. Acoustic holography as a metrological tool for characterizing medical ultrasound sources and fields. J Acoust Soc Am. 2015;138:1515–1532. doi: 10.1121/1.4928396. [DOI] [PMC free article] [PubMed] [Google Scholar]
- 45.Tavakkoli J, Cathignol D, Souchon R, Sapozhnikov OA. Modeling of pulsed finite-amplitude focused sound beams in time domain. J Acoust Soc Am. 1998;104:2061–2072. doi: 10.1121/1.423720. [DOI] [PubMed] [Google Scholar]
- 46.Zemp RJ, Tavakkoli J, Cobbold RS. Modeling of nonlinear ultrasound propagation in tissue from array transducers. J Acoust Soc Am. 2003;113:139–52. doi: 10.1121/1.1528926. [DOI] [PubMed] [Google Scholar]
- 47.Varslot T, Taraldsen G. Computer simulation of forward wave propagation in soft tissue. IEEE Trans Ultrason Ferroelectr Freq Control. 2005;52:1473–82. doi: 10.1109/tuffc.2005.1516019. [DOI] [PubMed] [Google Scholar]
- 48.Kashcheeva S, Sapozhnikov O, Khokhlova V, Averkiou M, Crum L. Nonlinear distortion and attenuation of intense acoustic waves in lossy media obeying a frequency power law. Acoust Phys. 2000;46:170–177. [Google Scholar]
- 49.Kurganov A, Tadmor E. New high-resolution central schemes for nonlinear conservation laws and convection–diffusion equations. J Comp Phys. 2000;160:241–282. [Google Scholar]
- 50.Bessonova OV, Khokhlova VA, Canney MS, Bailey MR, Crum LA. A derating method for therapeutic applications of high intensity focused ultrasound. Acoust Phys. 2010;56:354–363. doi: 10.1134/s1063771010030140. [DOI] [PMC free article] [PubMed] [Google Scholar]
- 51.Khokhlova VA, Bailey MR, Reed JA, Cunitz BW, Kaczkowski PJ, Crum LA. Effects of nonlinear propagation, cavitation, and boiling in lesion formation by high intensity focused ultrasound in a gel phantom. J Acoust Soc Am. 2006;119:1834–48. doi: 10.1121/1.2161440. [DOI] [PubMed] [Google Scholar]
- 52.Mason WP. Aging of the properties of barium titanate and related ferroelectric ceramics. J Acoust Soc Am. 1955;27:73–85. [Google Scholar]
- 53.Bessonova O, Khokhlova V, Bailey M, Canney M, Crum L. Focusing of high power ultrasound beams and limiting values of shock wave parameters. Acoustical Physics. 2009;55:463–473. doi: 10.1134/S1063771009040034. [DOI] [PMC free article] [PubMed] [Google Scholar]
- 54.Duck FA. Physical properties of tissue: A comprehensive reference book. Academic Press; 1990. [Google Scholar]
- 55.Umemura S, Cain CA. Acoustical evaluation of a prototype sector-vortex phased-array applicator. IEEE Trans Ultrason Ferroelectr Freq Control. 1992;39:32–8. doi: 10.1109/58.166807. [DOI] [PubMed] [Google Scholar]


