Abstract
In the present study, we have phytochemically characterized 5 different abundant Aloe species, including Aloe vera (L.) Burm.f., using silylation followed by Gas Chromatography-Mass Spectrometry technique and compared the data using multivariate statistical analysis. The results demonstrated clear distinction of the overall phytochemical profile of A vera, highlighted by its divergent spatial arrangement in the component plot. Lowest correlation of the phytochemical profiles were found between A vera and A aristata Haw. (−0.626), whereas highest correlation resided between A aristata and A aspera Haw. (0.899). Among the individual phytochemicals, palmitic acid was identified in highest abundance cumulatively, and carboxylic acids were the most predominant phytochemical species in all the Aloe species. Compared to A vera, linear correlation analysis revealed highest and lowest correlation with A aspera (R 2 = 0.9162) and A aristata (R 2 = 0.6745), respectively. Therefore, A vera demonstrated distinct spatial allocation, reflecting its greater phytochemical variability.
Keywords: Aloe, gas chromatography-mass spectrometry, herbal medicine, multivariate statistics, nutrition, phytochemicals
Aloe vera (L.) Burm.f. is a medicinal herb known for its diverse pharmacological activities. It is used in traditional medicinal systems of different parts of the world time immemorial. Aloe vera is used in Indian traditional medicinal systems for the treatment of skin disease, infections, diabetes, inflammation, and also as an immunostimulant.1,2 Aloe vera extract is used as antidiabetic and antihypertensive in Trinidad and Tobago3; as antifungal and antiworm in Chinese traditional medicine4; as antifever, antiinfection, and wound healing in Persian medicine5–7; and to provide relief from various pathological complications in traditional medicinal systems of Egypt, Japan, Mexican, African, and so on.4 Moreover, A vera is also globally recognized as a functional nutritional supplement due to its health benefit.8 Aloe vera is one of the few plants whose nutritional and medicinal utilities are found in traditional and home-made practices throughout the world. Since the past 3 decades (Supplementary Data, available at http://chp.sagepub.com/supplemental), the rise of pharmacognostic studies has demonstrated several medicinal properties of A vera such as anticancer, antidiabetic, hepatoprotective, anti-inflammatory, antimicrobial, immunomodulatory, wound healing, and antioxidant properties.9–11 Phytochemical analysis also revealed the presence of several nutritional ingredients like complex carbohydrates (mannan, galactan, xylan, etc), amino acids (glutamic acid, arginine, valine, tyrosine, etc), lectin-like protein constituents, vitamins (folic acid, B2, B6, β-carotene, etc), anthraquinones (cinnamic acid esters, aloe-emodin, aloetic-acid, etc), enzymes (lipase, carboxylase, superoxide dismutase, etc), inorganic nutrients (calcium, potassium, phosphorous, iron, etc), and other diverse classes of phytochemicals (steroids, γ-linolenic acid, phenolics, etc), which not only provide nutrition and energy but are also responsible for prevention of diseases.12 With 167 book records, 3470 PubMed Central entries, 5524 protein sequences, and 1191 nucleic acid sequences till date, A vera is one of the highly investigated medicinal plant that has also been a commercial success as pharmacological, nutraceutical, and skin care products.13
Interestingly, the genus Aloe (family Asparagaceae) comprises 516 individual species14; however, the primary focus of most nutritional, pharmacological, and natural product studies are concentrated on A vera only. This might be because the rationale of pharmacognostic studies is rooted down in the traditional alternative and complementary medicines, where mostly A vera is used in the treatment of diverse ailments. However, in traditional medicine, as the pharmacological activities are the sum total of the properties of the bioactive constituents where synergy plays the crucial role, a comprehensive and comparative account of the phytochemical fingerprint of A vera with other Aloe species are lacking. Interestingly, other than A vera, many other Aloe species are known for their diverse bioactivities.15,16 Several bioactive constituents have been isolated and characterized from A vera nevertheless; however, the basic phytometabolomic profiles of most of the Aloe species remain completely unknown. A systematic comparison of the common chemical constituents of A vera with other Aloe species was missing.
Therefore, here we have chemically characterized 4 major Aloe species, namely, Aloe aristata Haw., Aloe jucunda Reynolds, Aloe albiflora Guillaumin, and Aloe aspera Haw., using gas chromatography-mass spectrometry and compared their phytochemical profiles with that of A vera (L.) Burm.f. The phytochemical profiles of each Aloe species with several identified phytochemicals were further subjected to multivariate statistics. This resulted in data reduction and highlighted the interrelated correlation patterns of the 5 Aloe species, reflecting the extent of divergence of A vera phytochemical fingerprint as a single variable.
Material and Methods
Chemicals
All the required chemicals and solvents were procured from HiMedia Laboratories Pvt Ltd (Mumbai, India), unless otherwise indicated. N,O-bis(trimethylsilyl)trifluoroacetamide + trimethylchlorosilane (99:1, v/v) was obtained from Sigma-Aldrich (St Louis, MA). Milli-Q ultrapure water was obtained from the central facility of the Department of Zoology, University of North Bengal. All solvents used in the analysis were high-performance liquid chromatography grade.
Plant Material
Healthy and disease-free leaves of A vera, A aristata, A jucunda, A albiflora, and A aspera were collected form the Medicinal Plant Garden of University of North Bengal (26.71°N, 88.35°E) on September 22, 23, and 26, 2015. The plant samples were authenticated and the following accession numbers were given, respectively: 9781, 09766, 09767, 09753, and 09779. Voucher specimens of all the samples were stored at the herbarium of the Department of Botany, University of North Bengal.
Sample Preparation and Silylation Derivation for Gas Chromatography-Mass Spectrometry
The leaves of the 5 different Aloe species were washed properly with water to remove any dirt or foreign matter and then cut into pieces (∼0.5 cm) using a sterile scalpel and shade dried (dehydrated) at laboratory temperature (25°C) for 3 weeks. The dried leaves were then ground to powder using a pestle and mortar. The resultants (50 mg) were then mixed with 2 mL n-hexane and incubated at 25°C with occasional shaking. After 24 hours, 20 μL of BSTFA + TMCS (99:1, v/v) mixture was added to the previous solution and incubated for 60 minutes at laboratory temperature with occasional shaking. The mixtures then was centrifuged for 20 minutes at 15 000 rpm at 25°C and the clear supernatants were collected. The supernatants were passed through anhydrous Na2SO4 and activated charcoal (2:1, w/w) in a 10-cm minicolumn 1/10th packed with nonabsorbent cotton to remove any trace of moisture and color. The eluted clear liquid was recentrifuged at 15 000 rpm for 20 minutes and passed through Whatman filter paper No. 1 (11 μm). The resultant clear solutions were used for gas chromatography-mass spectrometry analysis.
Gas Chromatography-Mass Spectrometry Analysis
The samples were analyzed using a Thermo-Scientific Trace 1300 gas chromatography instrument attached with Thermo-Scientific ISQ QD single quadrupole mass spectrophotometer following a previously standardized method.17–20 The gas chromatography system was equipped with TG-5MS column (30 m × 0.25 mm × 0.25 μm). The inlet temperature was maintained at 250°C. The initial temperature was set at 60°C (solvent delay 5 minutes) with a hold of 4 minutes, followed by a ramp of 5°C/min to 290°C with a hold of 10 minutes (60-minute program). Samples (1 μL) were injected in a splitless mode (split flow 50 mL/min) with splitless time of 0.80 minutes, using a Thermo-Scientific AI-1310 auto-sampler. The carrier gas was helium (99.99%), with a constant flow of 1 mL/min, passed through hydrocarbon and dehydrating columns. Mass spectrometry transfer line temperature was set at 290°C with an ion source temperature of 230°C (electron ionization). The individual samples were analyzed at electron energy 70 eV (vacuum pressure = 2.21e-0.5 Torr). The mass analyzer range was set to 50 to 650 atomic mass unit (amu). All samples were analyzed thrice for confirmation.
Gas Chromatography-Mass Spectrometry Data Analysis
MS data analysis was performed by Automated Mass Spectral Deconvolution and Identification System (AMDIS), version 2.70. The major and essential compounds were identified by mass fragmentation patterns (m/z) in terms of molecular peak (M+) and base peak (* representing mass fragment with optimum abundance) of the reference of parent compound using MS Interpreter, Version 2.0, and by matching with the reference database of the National Institute Standards and Technology (NIST) with a MS library version 2011.
Statistical Analysis
Data were statistically analyzed using IBM SPSS statistics version 20.0 software package for Windows. Data reduction technique was employed following previously reported methods.18,21,22 The interrelationship between the metabolomic profiles of the 5 different plants were analyzed by Principal Component Analysis (PCA) based on the correlation matrix. Under descriptive statistics, KMO and Bartley’s tests were performed to study the underlying dimensions of the 5 variables. Two factors were extracted under Varimax method. Data were further analyzed by employing a Hierarchical Cluster Analysis (HCA). The cluster method employed was between group linkages with interval of square Euclidian distance. Transform values of variables (average zero and SD 1), called Z scores, was carried out as a pretreatment of the data. Bivariate correlation analysis and proximity heat map were generated using Microsoft Excel 2010. Relative abundance was calculated (mean ± SD) from the data of 3 parallel runs. P < .05 was considered statistically significant.
Results and Discussion
The complete phytochemical composition of medicinal plants consists of a complex mixture of chemical species with varying polarity and volatile properties. Here, the hydrogen bonding in the component phytochemicals were reduced by silylation in order to transform them into much more volatile, nonpolar, and thermally stable form, appropriate for the gas chromatography analysis. The replacement of an active terminal proton from the functional groups (–OH, –COOH, =NH, –NH2, –SH) with an alkylsilyl group, such as in most of the cases trimethylsilyl group, caused elevation of volatility and polarity shift, resulting in identification of the compounds in their trimethylsilyl (C3H9Si) form with an increase of m/z 73.
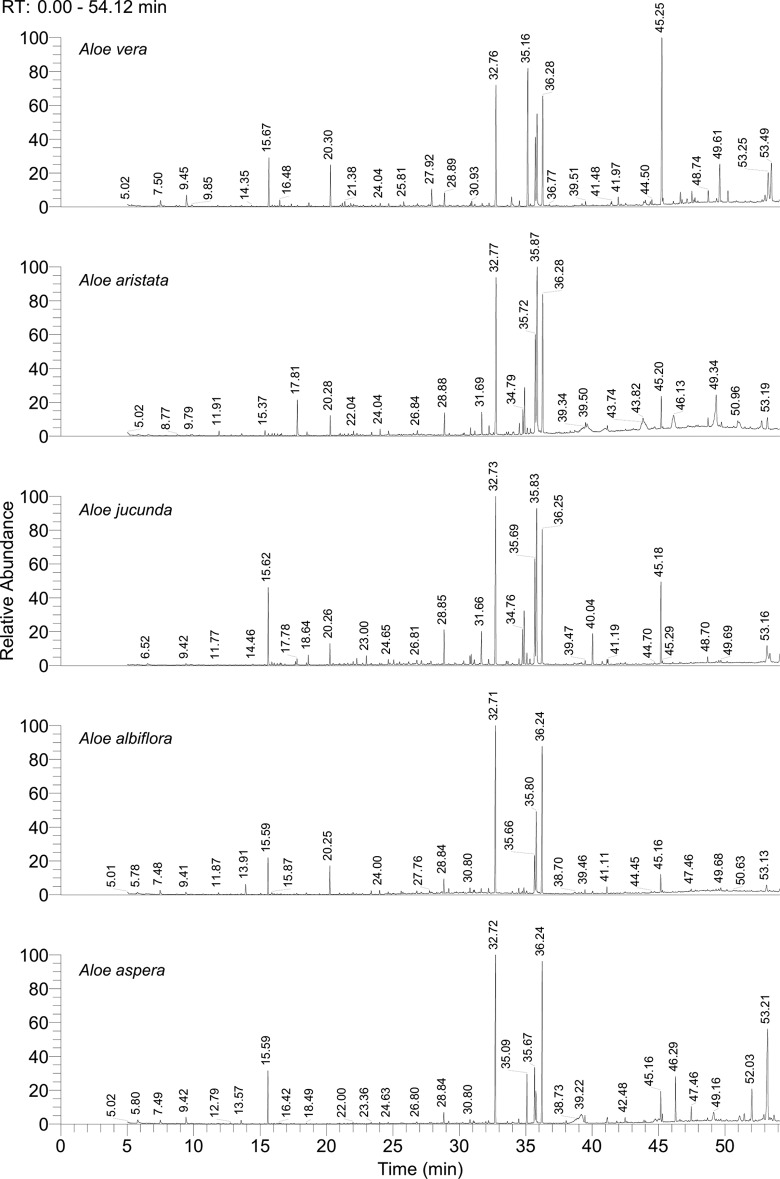
The gas chromatography-mass spectrometry analysis (see Figure 1 and Supplementary Data, available at http://chp.sagepub.com/supplemental) demonstrated quite distinct yet significantly overlapping phytochemical profiles of the 5 Aloe species, which revealed presence of several bioactive compounds, many of which are well established for their potent pharmacognostic properties. A total of 63, 39, 49, 37, and 42 compounds were identified, respectively, in A vera, A aristata, A jucunda, A albiflora, and A aspera. Among these, several compounds were identified as signature compounds in individual plants, such as 4-ethylbenzaldehyde (M+* 134, m/z 119, 105), 4-hydroxybutyric acid derivative (M+ 248, m/z 147*, 117), 2-hydroxyoctanoic acid derivative (M+ 232, m/z 117, 97, 73*), β-copaene (M+ 204, m/z 161, 119*, 105), adipic acid (M+ 290, m/z 141, 111, 73*), pimelic acid derivative (M+ 304, m/z 155, 125, 73*), suberic acid derivative (M+ 318, m/z 169, 129, 73*), protocatechuic acid derivative (M+ 370, m/z 281, 193, 73*), phytol (M+ 296, m/z 123, 71*), and so on, in A vera; 3-ethylphenol derivative (M+ 174, m/z 179*), p-ethylguaiacol (M+ 152, m/z 137*, 122), vanillin (M+ 224, m/z 209, 194*, 163, 147) in A aristata; phenylacetic acid (M+ 208, m/z 193, 91, 73*), benzene, 4-ethyl-1,2-dimethoxy- (M+ 166, m/z 151*, 135, 95), 4-vinylveratrole (M+ 164*, m/z 149, 91), 2-allyl-1,4-dimethoxy-3-methyl-benzene (M+ 91*, m/z 177, 149, 91), phenol,3,5-bis(1,1-dimethylethyl)- (M+ 206, m/z 191*, 57), estragole (M+ 147*, m/z 133, 121, 77), bumetrizole (M+ 115, m/z 300*, 272, 147) in A jucunda; hydrocinnamic acid derivative (M+ 297, m/z 207*, 91, 75), 1,2-ethanediol, phenyl (M+ 281, m/z 179*, 147) in A albiflora; m-pyrol (M+ 98*, m/z 71), oleic acid derivative (M+ 253, m/z 339, 117, 73*), campesterol derivative (H+ 472, m/z 382, 343, 129*), and stigmasterol derivative (M+ 484, m/z 394, 255, 129 83*) were only detected in A aspera.
Figure 1.
Gas chromatogram of Aloe vera, Aloe aristata, Aloe jucunda, Aloe albiflora, and Aloe aspera. Data represented as retention time (RT;=0-54 minutes) at x-axes versus relative abundance (RA; max 100) at y-axes. Phytochemical profiling was performed by silylation followed by gas chromatography-mass spectrometry analysis form the leaves of 5 Aloe species. Individual compounds were identified by mass fragment analysis and matching with the reference data form NIST MS library version 2011. The details of individual compounds identified are provided in Supplementary Data, available at http://chp.sagepub.com/supplemental.
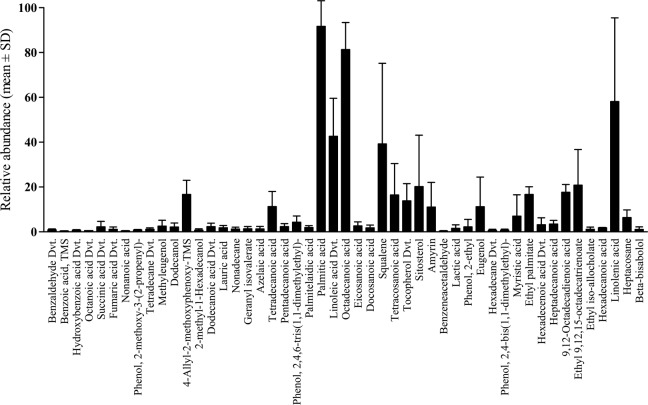
The relative abundance of squalene (98.26 ± 2.83) was optimum in A vera, whereas the presence of α-linolenic acid was highest in A aristata (93.22 ± 2.48) and A jucunda (91.69 ± 2.53). Similarly, palmitic acid was present in highest abundance in both A albiflora (97.63 ± 2.48) and A aspera (98.15 ± 2.56). Considering cumulative relative abundance in all the 5 Aloe species (Figure 2), the 5 major constituents with optimum relative abundance were palmitic acid (91.65 ± 11.42), octadecanoic acid (81.30 ± 12.06), linolenic acid 58.13 ± 37.31), linoleic acid derivative (42.61 ± 16.96), and squalene (39.19 ± 35.96). Alternatively, benzeneacetaldehyde (0.34 ± 0.16), benzoic acid (0.38 ± 0.09), octanoic acid derivative (0.52 ± 0.01), hexadecane derivative (0.64 ± 0.51), and phenol,2,4-bis(1,1-dimethylethyl)- (0.72 ± 0.46) were detected at the lowest abundance. On the other hand, linolenic acid (58.13 ± 37.31), squalene (39.19 ± 35.96), sitosterol (20.18 ± 22.93), linoleic acid derivative (42.61 ± 16.96), and ethyl-9,12,15-octadecatrienoate (20.81 ± 15.88) demonstrated highest variability in their abundance.
Figure 2.
The variation in relative abundance of different phytochemicals commonly found in the 5 Aloe species. The phytochemicals were selected based on their presence in 2 or more Aloe species. Palmitic acid, octadecanoic acid, and linolenic acid were the 3 most abundant phytochemicals, whereas the abundance of squalene, sitosterol, and linoleic acid were highly variable. Data represented as mean ± SD of relative abundance in 2 to 5 Aloe species.
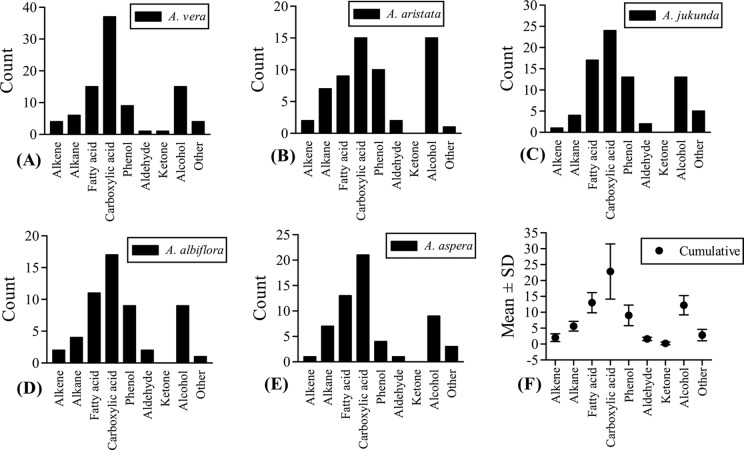
A detailed account of individual chemical species are presented in Figure 3, which demonstrated predominance of phytochemicals with carboxylic acid groups in all the plants. In fact, the carboxylic acid compounds demonstrated greatest degree of variation in their abundance (22.8 ± 8.67). A methylanthraquinone derivative (H+ 310; m/z) in A vera was identified by m/z 295* (C17H15O3Si; loss of CH3) and 265 (C16H13O2Si; loss of C2H3 + H2O) as the single ketone compound. Benzaldehyde derivatives are the only aldehydes detected in all 5 plants.
Figure 3.
The count of different phytochemicals of the major phytochemical species based on functional groups. (A) Aloe vera, (B) Aloe aristata, (C) Aloe jucunda, (D) Aloe albiflora, (E) Aloe aspera, and (F) cumulative count of all 5 Aloe species. The carboxylic acid group also includes fatty acid compounds. The “other” group includes identified minor chemical species. Several organic acids were identified contributing to the greatest share of all phytochemicals and with highest variability. A huge variety of phenolic compounds were identified, which are known for diverse pharmacological activities.
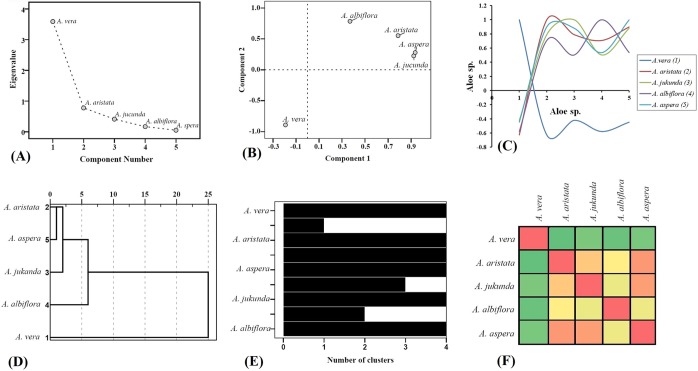
The multivariate statistical analysis (Figure 4) revealed quite distinct yet interconnected phytochemical profiles of the 5 Aloe species, reflecting on the significantly diverse phytochemical profile of A vera. Principal component analysis causes dimensional data reduction and thereby reflected the underlying correlation patterns of the given set of variables. Here variables of the experimental data are arranged in the most simplified pattern to reflect the overall picture of the phytochemical profile. Similarly, the hierarchical clustering represented stepwise similarities of the phytochemical profiles in a relatively simplified form. The Scree plot (Figure 4A) demonstrated greater variability of A vera located at eigenvalue <1 compared to other Aloe species located at eigenvalue <1. The near linear formation generated by A aristata, A jucunda, A albiflora, and A aspera represents very small fraction of variability among them. The spatial arrangements of the 5 Aloe species in the loading plot (Figure 4B) were based on the presence or absence of individual phytochemicals. For example, compounds such as benzaldehyde derivative, tetradecane derivative, dodecanoic acid derivative, lauric acid, palmitic acid, linoleic acid derivative, squalene, linolenic acid, and so on, were detected in all the 5 plants. However, compounds such as glyceric acid, β-copaene, adipic acid, protocatechuic acid, p-ethylguaiacol, vanillin, 4-vinylveratrole, estragole, bumetrizole, campesterol, stigmasterol, and so on, were identified only in individual Aloe species. The loading plot (Figure 4B) of first (PC1) and second (PC2) principal components cumulatively accounted for 71.81% and 87.36% variance, respectively. The completely separate and isolated location of A vera in the double-negative quadrant clearly indicates significant (P < .001) variance of its phytochemical constituents form other Aloe species located in the double-positive quadrant. Aloe vera was loaded highly negative on PC2 (PC1: −0.192; PC2: −0.893), whereas A aspera was loaded highly positive on component 1 (PC1: 0.936; PC2: 0.279). Interestingly, partial overlapping of A aspera (PC1: 0.936; PC2: 0.279) and A jucunda (PC1: 0.923; PC2: 0.226) resulted due to common primary and secondary metabolic pathways, giving rise to detection of common phytochemicals or their chemical derivatives. The extent of similarity of the phytochemical profiles were calculated using scatter plot generated from the correlation matrix (Figure 4C) that showed significantly (P < .001) highest correlation (0.899) between A aspera and A aristata and least correlation (−0.626) between A vera and A aristata. Cluster analysis was further performed using hierarchical cluster analysis method to distinguish the associations of the phytochemical profiles and also to validate the component analysis data. The extent of similarity of the phytochemical profiles were supported by the denodgram of the hierarchical cluster analysis (Figure 4D) and the proximity heat-map (Figure 4F), generated using the proximity data of hierarchical cluster analysis. Aloe vera located at the completely separate arm signifies its highly diverse phytochemical profile, followed by divergence from A albiflora, A jucunda, A aspera, and A aristata, respectively. Among the 5 Aloe species, lowest proximity resided between A aspera and A aristata (12.139), whereas greatest proximity was detected between A vera and A aristata (195.082; see Supplementary Data, available at http://chp.sagepub.com/supplemental).
Figure 4.
Multivariate statistical analysis of the phytochemical profiles of the 5 Aloe species. The phytochemical profiles of the 5 Aloe species obtained from the gas chromatography-mass spectrometry study were subjected to multivariate correlation, principal component, and clustering analysis to visualize the intercorrelation patterns and extent of similarities in their phytochemical profiles. (A) The scree plot demonstrates that the phytochemical profile of Aloe vera (eigenvalue >1) represents the greatest variability compared to other Aloe species (eigenvalue <1). (B) The clustered spatial arrangement of Aloe aristata, Aloe jucunda, Aloe albiflora, Aloe aspera in the double-positive quadrant, opposite to Aloe vera in the double-negative quadrant of the principal component loading plot clearly reflects nonequivalent phytochemical profile of Aloe vera. (C) The extent of correlation patterns (P < .001, 1-tailed) are reflected through the scatter plot, generated from the correlation matrix, obtained from principal component analysis. Here, least correlation resided between Aloe vera and Aloe aristata (r = −0.626), whereas greatest correlation was found between Aloe aspera and Aloe aristata (r = 0.899). The absolute correlation trend of Aloe vera remains negative to other Aloe species, signifying deviation in phytochemical profile. (D) Dendrogram representing the hierarchical clustering of the phytochemical profiles of 5 Aloe species, which remains in accordance with the principal component analysis, demonstrating 2 separate clusters. Cluster 1 comprises Aloe vera and cluster 2 comprises Aloe aristata, Aloe jucunda, Aloe albiflora, and Aloe aspera. This further illustrates step-wise divergence of the phytochemical profiles with terminal branching of Aloe aspera and Aloe aristata. (E) The Icicle diagram (corresponding to agglomeration schedule table in Supplementary data, available at http://chp.sagepub.com/supplemental) represents the progression of clustering, that is, at which step the individual phytochemical profiles of 5 different Aloe species were diverted. (F) Proximity heat map generated from proximity scores (Supplementary Data) corresponding to “D.” Shades of green to red color demonstrates high to low proximity scores. Highest phytochemical proximity resided between Aloe aspera and Aloe aristata, whereas lowest proximity was between Aloe vera and Aloe aristata.
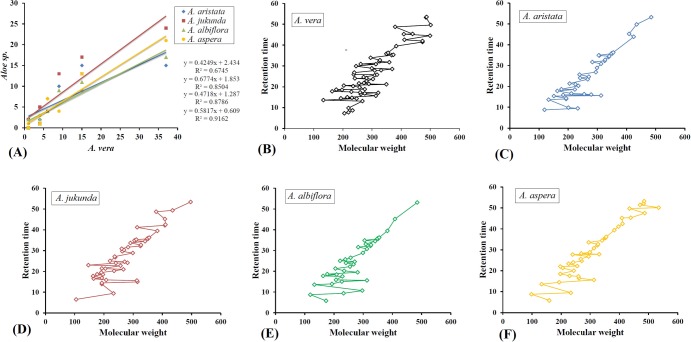
Based on the results of multivariate analysis, A aristata, A jucunda, A albiflora, and A aspera were compared with A vera, based on the abundance of phytochemical species (Figure 5A). Aloe aspera was found to be highly comparable (R 2 = 0.9162) and A aristata (R 2 = 0.6745) was least equivalent to that of A vera. The individual phytochemicals were further plotted to visualize the pattern of distribution based on their retention time versus molecular weight, which revealed metabolomic gaps and scarcity of high molecular weight compounds at higher retention time (Figure 5B-F). This may have resulted due to the fact that the volatile nature of compounds trends to decrease with increase of molecular weight. For example, only 5 compounds were identified between molecular weight 355 and 485 in A aristata, 3 compounds between molecular weight 409 and 497 in A jucunda, and 4 compounds between molecular weight 355 and 485 in A albiflora. Within the given mass range (50-650 amu) in the mass analyzer, the broadest range of compounds were identified in A aspera, where M-Pyrol (molecular weight 99) and 1-heptatriacotanol (molecular weight 536) were the compounds with lowest and highest molecular weight, respectively.
Figure 5.
The results of various linear bivariate correlation analysis. (A) Correlation analysis of different phytochemical species (alkane, alkene, fatty acid, carboxylic acid, phenol, aldehyde, ketone, alcohol, others) identified in Aloe aristata, Aloe jucunda, Aloe albiflora, Aloe aspera versus Aloe vera. Compared to Aloe vera, optimum (R 2 = 0.9162) and minimum (R 2 = 0.6745) correlation of phytochemical species were found in case of Aloe aspera and Aloe aristata, respectively. R 2 = coefficient of determination, representing fraction of the variance within the dependent variables that could be predicted from the independent variables. (B-F) Scatter plots representing distribution of phytochemicals in the order of increasing molecular weight against retention time. Among the 5 Aloe species, 1-heptatriacotanol and M-pyrol were identified as the highest (536) and lowest (99) molecular weight compounds, both of which were detected in Aloe aspera.
Conclusion
The pharmacological properties in traditional herbal medicines are dependent on the synergy of individual components, cumulatively accounting for the overall bioactivities. Interestingly, this is clear from the present study where several phytochemicals were commonly identified in different Aloe species. However, significant difference were observed in their relative abundance, resulting in scattering of the 5 Aloe species based on their phytochemical profiles. The present phytochemical analysis of 5 different Aloe species followed by multivariate statistical analysis clearly depicts distinct phytochemical profile of A vera. Synergy of phytochemicals, being a relative term, cannot be measure in an absolute degree. Yet the present study reflects how the overall phytochemical profile may play a key role in selective preference of using A vera over other Aloe species in traditional medicine.
Supplementary Material
Acknowledgments
The authors are grateful to UGC-SAP programme for providing the gas chromatography-mass spectrometry machine at the Department of Zoology, University of North Bengal. The authors are also thankful to the Head of the Department, Department of Zoology, University of North Bengal, for allowing us to work in the central instrumentation facility.
Footnotes
Author Contributions: PD performed the gas chromatography-mass spectrometry analysis, performed the statistical analysis, and drafted the manuscript. SD prepared the samples for gas chromatography-mass spectrometry analysis, performed derivations, and helped in drafting of the manuscript. AC and APD collected the plant materials, identified them, and helped in sample preparation. TKC designed and coordinated the study and drafted the manuscript. All the authors have read and approved the final version of the manuscript.
Declaration of Conflicting Interests: The authors declared no potential conflicts of interest with respect to the research, authorship, and/or publication of this article.
Funding: The authors received no financial support for the research, authorship, and/or publication of this article.
Ethical Approval: The present study required no ethical committee clearance as it does not include animal studies.
Supplemental Material: The online supplementary data are available at http://journals.sagepub.com/doi/suppl/10.1177/2156587217698292.
References
- 1. Heber D. Physicians’ Desk Reference for Herbal Medicines. 4th ed Montvale, NJ: Thomson PDR; 2007. [Google Scholar]
- 2. Khare CP. Indian Medicinal Plants: An Illustrated Dictionary. New York, NY: Springer; 2007. [Google Scholar]
- 3. Lans CA. Ethnomedicines used in Trinidad and Tobago for urinary problems and diabetes mellitus. J Ethnobiol Ethnomed. 2006;2:45. [DOI] [PMC free article] [PubMed] [Google Scholar]
- 4. Kumar S, Yadav JP. Ethnobotanical and pharmacological properties of Aloe vera: a review. J Med Plant Res. 2014;8:1387–1389. [Google Scholar]
- 5. Ghazanfar SA. Handbook of Arabian Medicinal Plants. Boca Raton, FL: CRC Press; 1994. [Google Scholar]
- 6. Avijgan M, Kamran A, Abedini A. Effectiveness of Aloe vera gel in chronic ulcers in comparison with conventional treatments. Iran J Med Sci. 2016;41(3 suppl):S30. [PMC free article] [PubMed] [Google Scholar]
- 7. Avijgan M, Avijgan M, Hakamifard A, Razavi N. An innovation for retarded healing process of a chronic ulcer by Aloe vera gel treatment. J Nat Remedies. 2016;16(2):47–51. [Google Scholar]
- 8. Rodríguez RE, Darias MJ, Díaz RC. Aloe vera as a functional ingredient in foods. Crit Rev Food Sci Nutr. 2010;50:305–326. [DOI] [PubMed] [Google Scholar]
- 9. Vogler BK, Ernst E. Aloe vera: a systematic review of its clinical effectiveness. Br J Gen Pract. 1999;49:823–828. [PMC free article] [PubMed] [Google Scholar]
- 10. Ulbricht C, Armstrong J, Basch E, et al. An evidence-based systematic review of Aloe vera by the natural standard research collaboration. J Herb Pharmacother. 2007;7:279–323. [DOI] [PubMed] [Google Scholar]
- 11. Surjushe A, Vasani R, Saple DG. Aloe vera: a short review. Indian J Dermatol. 1999;53:163–166. [DOI] [PMC free article] [PubMed] [Google Scholar]
- 12. Hamman JH. Composition and applications of Aloe vera leaf gel. Molecules. 2008;13:1599–1616. [DOI] [PMC free article] [PubMed] [Google Scholar]
- 13. National Center for Biotechnology Information. http://www.ncbi.nlm.nih.gov/gquery/?term=aloe+vera. Accessed November 12, 2016.
- 14. The Plant List. Aloe. http://www.theplantlist.org/browse/A/Asparagaceae/Aloe/. Accessed May 28, 2016.
- 15. Ombito JO, Salano EN, Yegon PK, Ngetich WK, Mwangi EM, Koe GKK. A review of the chemistry of some species of genus Aloe (Xanthorrhoeaceae family). J Sci Innov Res. 2015;4(1):49–53. [Google Scholar]
- 16. Rodriguez DJ, Angulo-Sanchez JL, da Silva JAT, Aguilar-Gonzalez CN. Review of Aloe species’ medicinal properties and bioactive compounds In: da Silva JAT, ed. Floriculture, Ornamental and Plant Biotechnology: Advances and Topical. 1st ed Vol. 4 Global Science Books; 2006:460–471. [Google Scholar]
- 17. Kar P, Dey P, Misra AK, Chaudari T, Sen A. Phytometabolomic fingerprinting of selected actinorhizal fruits popularly consumed in North-East India. Symbiosis. 2016;70:159–168. [Google Scholar]
- 18. Dey P, Dutta S, Chaudhuri TK. Comparative phytochemical profiling of Clerodendrum infortunatum L. using GC-MS method coupled with multivariate statistical approaches. Metabolomics. 2015;5:3. [Google Scholar]
- 19. Dey P, Chaudhuri TK. Phytochemical characterization of Dioscorea alata leaf and stem by silylation followed by GC-MS analysis. J Food Biochem. 2015;40:630–635. [Google Scholar]
- 20. Dey P, Chaudhuri TK. Comparative phytochemical profiling and effect of Nerium oleander extracts on the activities of murine peritoneal macrophage. Arch Biol Sci. 2016;68:515–531. [Google Scholar]
- 21. Dey P, Chaudhuri TK. Antioxidant capacity of N. indicum: a correlation study using principal component analysis and multivariate statistical approach. Int J Pharm Pharm Sci. 2013;5:931–937. [Google Scholar]
- 22. Dey P, Ray S, Chaudhuri TK. Immunomodulatory activities and phytochemical characterisation of the methanolic extract of Dioscorea alata aerial tuber. J Funct Foods. 2016;23:315–328. [Google Scholar]
Associated Data
This section collects any data citations, data availability statements, or supplementary materials included in this article.


