Abstract
Structural alerts are commonly used in drug discovery to identify molecules likely to form reactive metabolites and thereby become toxic. Unfortunately, as useful as structural alerts are, they do not effectively model if, when, and why metabolism renders safe molecules toxic. Toxicity due to a specific structural alert is highly conditional, depending on the metabolism of the alert, the reactivity of its metabolites, dosage, and competing detoxification pathways. A systems approach, which explicitly models these pathways, could more effectively assess the toxicity risk of drug candidates. In this study, we demonstrated that mathematical models of P450 metabolism can predict the context-specific probability that a structural alert will be bioactivated in a given molecule. This study focuses on the furan, phenol, nitroaromatic, and thiophene alerts. Each of these structural alerts can produce reactive metabolites through certain metabolic pathways but not always. We tested whether our metabolism modeling approach, XenoSite, can predict when a given molecule’s alerts will be bioactivated. Specifically, we used models of epoxidation, quinone formation, reduction, and sulfur-oxidation to predict the bioactivation of furan-, phenol-, nitroaromatic-, and thiophene-containing drugs. Our models separated bioactivated and not-bioactivated furan-, phenol-, nitroaromatic-, and thiophene-containing drugs with AUC performances of 100%, 73%, 93%, and 88%, respectively. Metabolism models accurately predict whether alerts are bioactivated and thus serve as a practical approach to improve the interpretability and usefulness of structural alerts. We expect that this same computational approach can be extended to most other structural alerts and later integrated into toxicity risk models. This advance is one necessary step toward our long-term goal of building comprehensive metabolic models of bioactivation and detoxification to guide assessment and design of new therapeutic molecules.
Graphical abstract
INTRODUCTION
Idiosyncratic adverse drug reactions (IADRs) are a challenging problem in drug development. They are the leading reason for both termination of clinical investigation and withdrawal from the market.1,2 Most IADRs are hypersensitivity-driven adverse drug reactions, and arise when drugs are bioactivated into reactive metabolites.3–7 Reactive metabolites frequently form covalent and noncovalent interactions with cellular macromolecules such as DNA, proteins, and lipids.4,7,8 Covalent interactions can lead to cancer or trigger hypersensitivity reactions. Nonconvalent interactions can cause oxidative and other intracellular stress.8–11
Structural alerts or toxicophores are chemical structures that can be bioactivated to generate reactive metabolites.12 About 78–83% of drugs with a high incidence of IADRs contain structural alerts, and around 62–69% of these drugs form reactive metabolites.13 Because structural alerts are understandable and inexpensive to apply, they are commonly used within the pharmaceutical industry, the FDA, and drug discovery tools to flag lead compounds with toxicity risk.14–17 Candidate compounds with one or more toxicophores are often chemically modified to remove the structural alerts and minimize toxicity risk.18,19 However, avoiding structural alerts is not always practical because alerts may be required for efficacy. Structural alerts like furan, thiophene, nitroaromatic, phenol, and aniline are building blocks with important pharmacological properties.20–22 They can give rise to pharmacological activity or provide pharmacokinetic benefits.
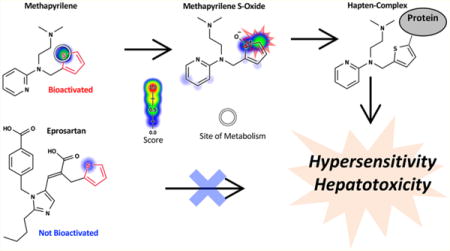
More importantly, toxicity due to a specific structural alert is conditional. A structural-alert-containing compound would become harmful or remain safe depending on its metabolic pathways23 and the reactivity of its metabolites. For example, the thiophene structural alert is ambiguous; in the case of methapyrilene, the structural alert undergoes bioactivation, while no activation of the thiophene occurs for eprosartan (Figure 1). The differences in biotransformation lead to drastic differences in the safety profiles of the two compounds. While methapyrilene was withdrawn from the market due to hepatotoxicity, eprosartan is a safe and commonly prescribed antihypertensive. In fact, of the 200 most frequently prescribed drugs in the US, about 50% of them contain more than one structural alert.13 However, the vast majority of these drugs are not associated with IADRs.
Figure 1.
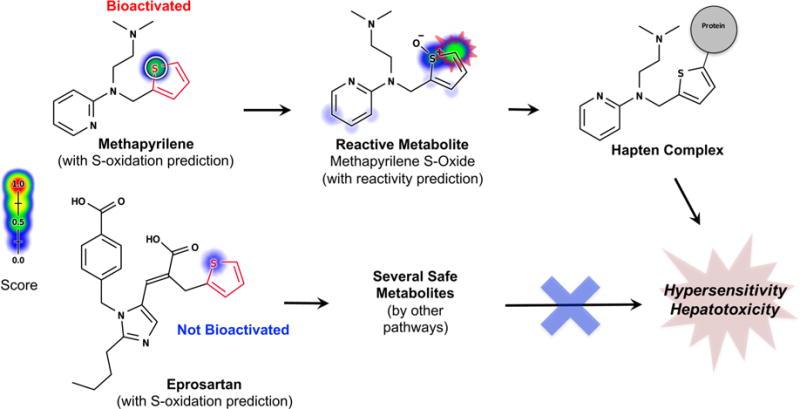
Structural alerts (highlighted in red) incorrectly flag safe drugs because they do not adequately model metabolism. Known sites of metabolism are marked with white circles. The metabolism and reactivity91 predictions are plotted against each atom in the molecule, with color shading ranging from red (1.0, likely) to white (0.0, unlikely). Structural alerts indiscriminately flag both bioactivated and not-bioactivated compounds as problematic. For example, both methapyrilene and eprosartan contain the thiophene structural alert, yet their toxicity profiles are very different, as predicted by metabolism models (atom shading). While methapyrilene, an antacid, was withdrawn from the market due to hepatotoxicity caused by reactive metabolites,76 eprosartan is a safe antihypertensive that does not form reactive metabolites.82
Because structural alerts do not adequately model metabolism, they often fail to predict whether molecules will form reactive metabolites (Figure 2).13,14,24 Molecules are flagged even if (1) the structural alert is not bioactivated, (2) the reactive metabolite is quickly metabolized into a nonreactive form, or (3) an alternative, nonactivating metabolic pathway is responsible for the clearance of the parent compound.24 In addition, structural alerts can only identify toxic molecules with specific, well-known substructures; they do not identify substructures that have not yet been observed to generate reactive metabolites. For example, the formation of terbinafine’s reactive metabolite, an aldehyde generated through N-dealkylation, was missed by the structural alert approach.25 Consequently, the recommendations of structural alerts are very difficult to interpret: safe molecules are often flagged as toxic, and unsafe molecules may slip through.24,26
Figure 2.
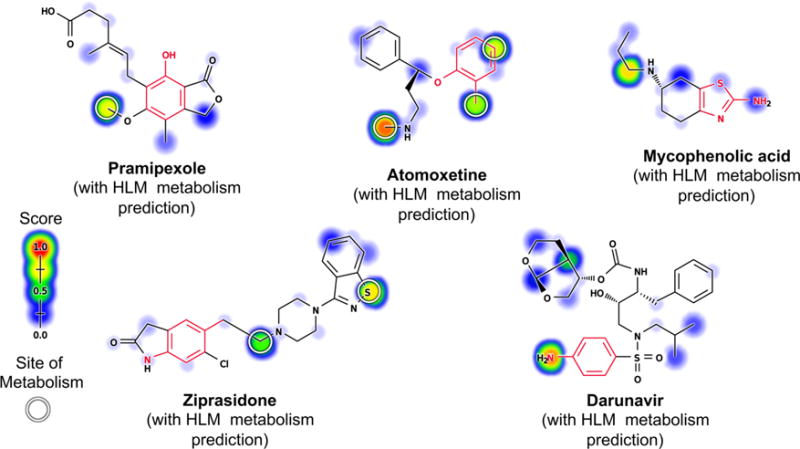
Metabolism models can identify safe molecules containing structural alerts. This figure overlays model predictions on a reproduction of a figure from Stepan et al.13 In contrast, structural alerts (highlighted in red) incorrectly flag many safe drugs. Known sites of metabolism are marked with white circles. Predictions by one of our metabolism models95 are plotted against each atom in the molecule, with color shading ranging from red (1.0, likely) to white (0.0, unlikely). The model predicted that mycophenolic acid, pramipexole, and ziprasidone would be metabolized outside their structural alerts to form safe metabolites. Atomoxetine is predicted to be metabolized at the o-alkyl aromatic ether structural alert, but the predicted metabolite is not the reactive quinone (Figure 6). Darunavir is the only incorrect prediction because the drug is not oxidized at its aniline to form a reactive nitroso compound. These results were promising but preliminary based on a previously published model that does not make metabolite specific predictions.29,95,96 Building on this initial and encouraging result, this study aims to systematically test more advanced metabolism models in predicting the bioactivation of structural alerts. Adapted from ref 13. Copyright 2011 American Chemical Society.
In our prior work, we built several models of metabolism.27–29 We hypothesize that these models might more specifically identify when alerts are bioactivated, and the current study tests this hypothesis. Our method combines the knowledge of the biotransformation pathways of well-studied structural alerts with metabolism models to predict the formation of reactive metabolites. As a practical assessment of our approach, we apply individual metabolism models to predict the bioactivation of multiple structural alerts.
MATERIALS AND METHODS
Epoxidation Model
Furans and thiophenes can be bioactivated by epoxidation. We use a hierarchical deep neural network to predict the probability that each alert is epoxidized. This model is based on 524 molecules, including 14 furans (Table 1), and was previously published by our group.28 All molecules epoxidized by human liver microsomes (HLMs) in the literature-derived Accelrys Metabolite Database (AMD) were used in the training set. Nonepoxidized molecules were selected for structural similarity to the epoxidized molecules. This model is available on the XenoSite Web server.29
Table 1.
Composition of the Training and Evaluation Sets by Structural Alerts and Metabolism Modelsa
| structural alert | model | training set
|
evaluation set
|
||||
|---|---|---|---|---|---|---|---|
| BA | NBA | size | BA | NBA | size | ||
| furan | epoxidation | 5 | 9 | 524 | 3 | 10 | 17 |
| phenol | quinone formation | 169 | 108 | 718 | 33 | 94 | 188 |
| nitroaromatic | reduction | 24 | 74 | 3061 | 16 | 15 | 37 |
| thiophene | epoxidation | 7 | 2 | 524 | 4 | 27 | 42 |
| thiophene | S-oxidation | 15 | 35 | 3061 | 8 | 23 | 42 |
In the table, the number of each structural alert that is bioactivated (BA) and not-bioactivated (NBA) is listed alongside the total size of the data set (size). The bioactivated alerts are included in the training sets, but those not bioactivated are not always included. This is because, for the epoxidation and quinone formation models, negative examples are chosen to structurally match the positive examples, rather than to include all examples of the alert.
Quinone Model
Phenols are bioactivated by quinone formation. We use a deep neural network that predicts whether phenols are metabolized to form quinones. This model is trained on 718 molecules, including 277 phenols (Table 1), from the AMD. This model is published in a separate study27 and is available on the XenoSite Web server.29
Reduction and S-Oxidation Model
Nitroaromatics can be bioactivated by reduction, and thiophenes can be bioactivated by sulfur-oxidation (S-oxidation). For these two structural alerts, we use a HLM metabolism model that predicts which part of the molecule is metabolized and what types of biotransformation (e.g., S-oxidation, hydroxylation, and/or reduction) the molecules undergoes. This model is a deep neural network that has an output for reduction and an output for sulfur oxidation. It was trained on 3061 molecules, including 98 nitroaromatics and 50 thiophenes from the AMD (Table 1). This model will be published in a separate study but is currently available on the XenoSite Web server.29
Scaled Predictions
The three models produce probabilistic predictions that range from zero to one. Still, it is possible the predictions are not ideally scaled to each other. We investigated rescaling the models’ output by fitting the formula z = 1/(1 + exp (k log[y/(1−y)]+ w)), where z is the rescaled score, y is the unscaled model output, and k and w are tunable weights for each of the four models. This rescaling preserves the order in which sites of metabolism are predicted by each model within its assigned structural alert. Only requiring two weights for each structural alert, the score can be trained with very small amounts of data (see the Materials and Methods section). For assessment, final rescaled scores were obtained using leave-one-molecule-out cross-validation. As we will see, rescaling does not lead to a statistically significant improvement in performance, so it may not be necessary.
Performance Comparison
We used the area under the receiver operating characteristic curve (AUC)30 to evaluate the prediction accuracy of the metabolism model and structural alert approaches. To assess the statistical significance of different AUCs, two-tailed p-values were computed using the Hanley and McNeil formula.31 As a baseline method against which to assess performance, we used logP: the octanol/water partition coefficient. Lipinski’s well-known “rule of five” advises that highly hydrophobic drugs should be avoided because they are more likely to be metabolized.32 Indeed, logP directly correlates with in vivo toxicity, partly due to increased metabolism.33 Because logP is an easily computable, biologically relevant parameter, this is an informative comparison for our models.
Evaluation Set
We collected the structures of all FDA-approved and -withdrawn small molecule drugs from the DrugBank Database (May 2016).34 We used SMARTS patterns specifying the structural alert of interest to filter each of the four evaluation sets: furan, phenol, nitroaromatic, and thiophene (Table 1, Figure 3). Complete lists of molecules in these evaluation sets are provided in the Supporting Information. Next, we used the AMD database to identify which of these molecules were bioactivated at their structural alert. We counted all furans, phenols, nitroaromatics, and thiophenes bioactivated for which there were corresponding experimentally observed reactive metabolites (or their downstream products) resulting from epoxidation, quinone formation, reduction, and S-oxidation/epoxidation, respectively.
Figure 3.
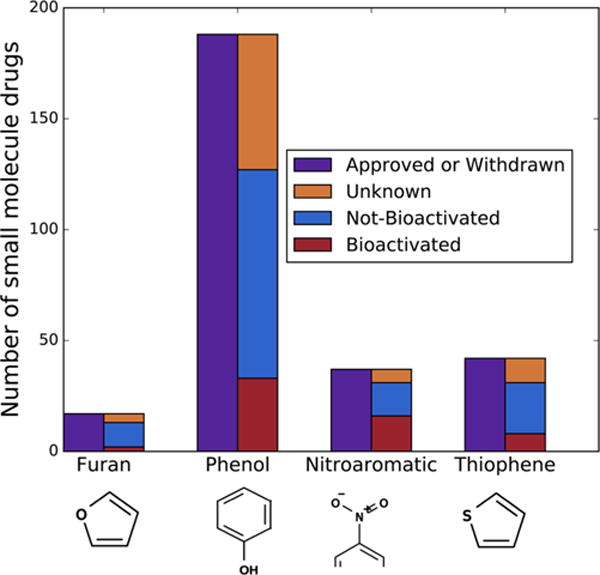
Commonly observed structural alerts that bioactivation can render toxic. Our furan, phenol, nitroaromatic, and thiophene structural alert evaluation sets contain 17, 188, 37, and 42 FDA approved or withdrawn small molecule drugs (in purple), respectively. Among those, 13 furan-, 127 phenol-, 31 nitroaromatic-, and 31 thiophene-containing drugs have been metabolically studied (blue and red). Of those metabolically studied drugs, the furan, phenol, nitroaromatic, and thiophene structural alerts are bioactivated, respectively, 23%, 26%, 51%, and 26% of the time. Nitroaromatics can include aromatic rings of any size, so only a fragment of the ring is visualized.
Sufficient molecules for each structural alert were identified to test our approach. Furans were identified in 17 approved or withdrawn drugs, 13 of which were in AMD, and 3 were bioactivated (Table S1). All of the bioactivated furan examples are activated by epoxidation. Phenols were identified in 188 approved or withdrawn drugs (Table S2), 127 of which were in AMD, and 33 were bioactivated into quinones. Nitroaromatics were identified in 37 approved or withdrawn drugs (Table S3), 31 of which were in AMD, and 16 were bioactivated. All of the bioactivated nitroaromatic examples are activated by reduction. Thiophenes were identified in 42 approved or withdrawn drugs, 31 of which were in AMD, and 8 were bioactivated (Tables S4). Of the bioactivated thiophene drugs, 8 are reported to be bioactivated by S-oxidation, 4 are reported to be bioactivated by epoxidation, and 8 are reported to be bioactivated by both S-oxidation and epoxidation.
Evaluation Set Predictions
In some cases, molecules in the evaluation set were also in the training sets. To ensure unbiased predictions on these molecules, we used a hold-out prediction. In turn for each validation molecule, the model was retrained with all of the molecules except the validation molecule, and the predictions from the newly trained model were used. This approach ensured unbiased predictions, even when molecules were in both sets.
RESULTS AND DISCUSSION
The following sections use metabolism models to predict the bioactivation pathways for four commonly observed structural alerts: furans, phenols, nitroaromatics, and thiophenes. In turn, we evaluate this approach’s performance with each alert. Next, we combine all four models to predict the bioactivation of molecules containing any of the four structural alerts. This combined model is a more practical tool for identifying possible problematic metabolic pathways for functionally and structurally diverse molecules. Finally, we discuss the limitations of this approach and solutions for future studies to improve estimations of toxicity risk.
Furans
Furans are oxygen-containing five-member aromatic rings that are commonly found in drugs, food, nutraceuticals, the environment, and industrial pollutants.20,35–38 Furans can be bioactivated via epoxidation (Figure 4). For example, furosemide is a frequently prescribed diuretic that sometimes causes idiosyncratic hepatitis, which may be due to the epoxidation of its furan ring.13,39–42 This epoxide metabolite is electrophilically reactive and conjugates to nucleophilic sites within proteins. The resulting adducted protein serves as a hapten to induce toxic immune responses.13,39,43 However, many furan-containing drugs are not toxic. For example, the H2 antagonist ranitidine does not provoke toxicity despite a high therapeutic dose because its furan is not bioactivated.13,44 Significantly, many drugs contain furans, but only 23% undergo bioactivation (Figure 3).
Figure 4.

Furan is bioactivated by epoxidation. Cytochrome P450s bioactivate furans via epoxidation. The resulting epoxide is highly reactive to ring strain and polarized carbon–oxygen bonds. Consequently, the epoxide can react directly with proteins or first undergo ring scission to form a reactive cis-enedione that then conjugates to proteins.37
We applied the epoxidation model to predict which furan-containing drugs undergo bioactivation at the alert.28 Bioactivated furans were identified with an AUC of 100%, statistically outperforming using the structural alert alone, with a two-sided p-value of 0.01 (Figure 5). This performance is also significantly better than that of logP alone (AUC of 60%, two-sided p-value of 0.022). The bioactivated drugs included furosemide,13,39,43 methoxsalen,45 and prazosin,46 and the not-bioactivated drugs were vilazodone, fluticasone, lapatinib, ranitidine, amiodarone, dantrolene, nitrofurantoin, furazolidone, nitrofural, and dronedarone. Encouragingly, the model perfectly identified bioactivated furans with 100% accuracy. Of note, we even correctly predicted that methoxsalen is epoxidized, despite the drug being mislabeled as nonepoxidized in our training data drawn from the AMD. Upon further investigation, we found a source omitted by the AMD that reported methoxsalen’s epoxidation at its furan structural alert.45 We found it reassuring that our model revealed an error in our curated source data because it is evidence that the model was not overtrained.
Figure 5.
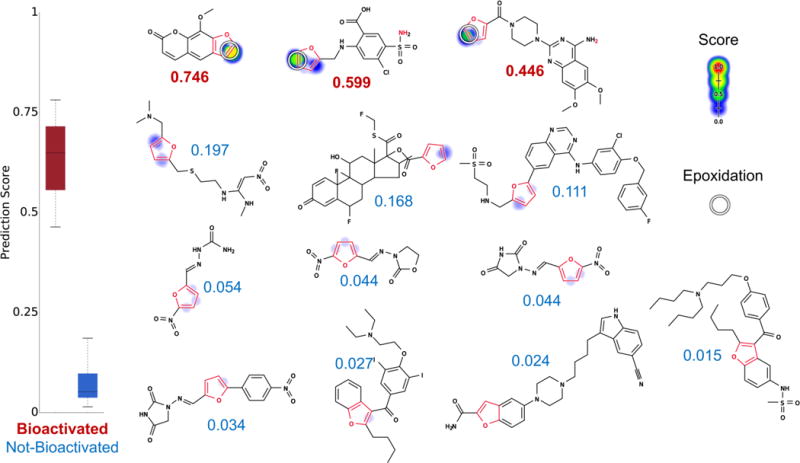
Metabolism model identifies which furans (highlighted in red) are bioactivated. From left to right, top to bottom, the molecules are methoxsalen,45 furosemide,13,39,43 prazosin,46 ranitidine, fluticasone, lapatinib, nitrofural, furazolidone, nitrofurantoin, dantrolene, amiodarone, vilazodone, and dronedarone. Experimentally observed sites of epoxidation are indicated by white circles. For each molecule, the colored shading represents bond epoxidation scores, which range from 0 to 0.746. The model’s AUC accuracy on the furan evaluation set is 100% (statistically outperforms the structural alert approach, two-sided p-value = 0.01). Notably, methoxsalen (the highest ranked molecule) was not epoxidized in the AMD. However, this is an omission in the AMD data set; methoxsalen is actually epoxidized and is counted here as a positive drug.45 Markedly, the model correctly notes that terminal furans (with just one substituent) are most likely to be bioactivated but still correctly recognizes the one exception (fluticasone) to the rule.
Phenols
Phenols contribute significantly to biological and pharmacological properties and thus are found in many drugs. In fact, phenols are one of the most frequently observed structural alerts, present in about 10% of all drugs on the market. Unfortunately, this important structure can be readily converted into quinones (Figure 6). Quinone species, such as quinone-imines and quinone-methides, are electrophilic Michael acceptors that are often highly reactive and comprise over 40% of all known reactive metabolites.47 At the same time, many safe drugs contain phenol and do not form quinones. Consequently, phenol’s presence alone is not necessarily indicative of quinone formation. Furthermore, phenols may be “hidden” until phenyl rings undergo hydroxylation in vivo to form the phenol. Such cases would be missed by the structural alert approach. Avoiding phenyl rings in drug development is impractical. Therefore, an accurate method for identifying which phenols are actually at risk for quinone formation would be of great value.
Figure 6.
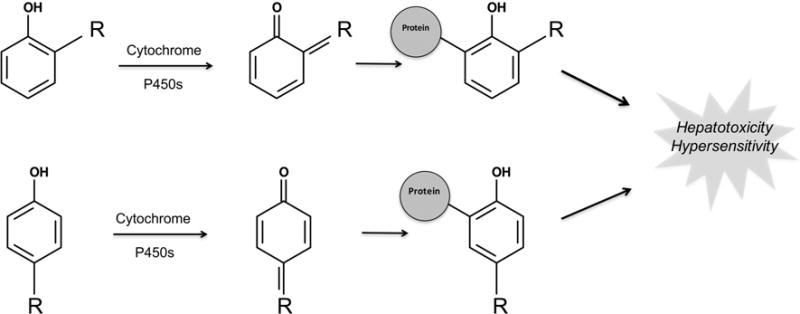
Phenol structural alert is bioactivated to form quinones by cytochrome P450. Quinones, such as quinone-imines and quinone-methides, are electrophilic Michael acceptors that are often highly reactive and comprise over 40% of all known reactive metabolites.47 Consequently, phenols are one of the most important types of structural alerts. Furthermore, any phenyl ring, an unavoidable building block of many drugs, can be subject to aromatic hydroxylation, thereby forming a phenol. “R” represents a carbon, oxygen, or nitrogen, which in conjunction with the phenol oxygen can form a quinone-methide, quinone, or quinone-imine, respectively. The R group can be either ortho or para to the phenol oxygen.
We recently developed the quinone formation model, which accurately predicts quinone formation across diverse chemicals.27 On the phenol data set, the quinone formation model separated the quinone-forming molecules from the other molecules with an AUC of 73% (Figure 7).
Figure 7.
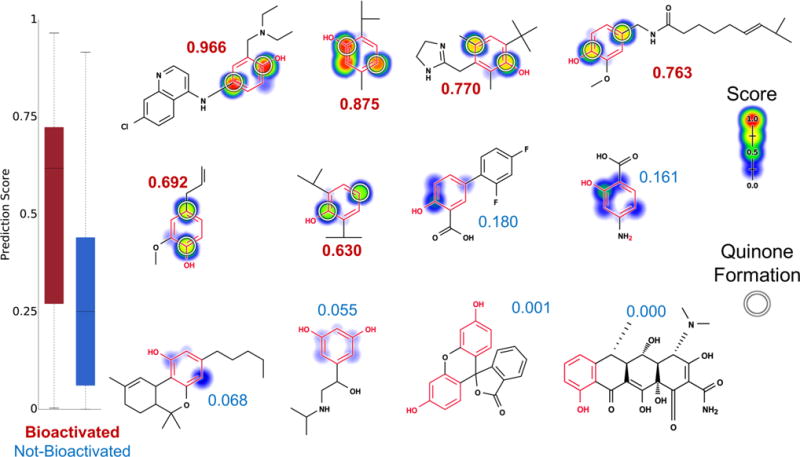
Metabolism model identifies which phenols (highlighted in red) are bioactivated into quinones. Twelve examples from the phenol evaluation set, from left to right, top to bottom: amodiaquine,98–100 thymol,101 oxymetazoline,102 capsaicin,103 eugenol,104 propofol,105 diflunisal, aminosalicylic acid, dronabinol, orciprenaline, fluorescein, and doxycycline. The remaining molecules and their prediction are reported in the Supporting Information (Table S2). Attached numbers are the molecule quinone formation score, with red for the bioactivated phenols and blue for the rest. Experimentally observed sites of quinone formation are indicated by white circles. For each molecule, the colored shading represents quinone site scores, which range from 0 to 0.97. The model’s AUC accuracy on the phenol evaluation set is 73% and is better than the structural alert alone (two-sided p-value = 0.0026).
Quinone formation is more complicated than the other pathways in this study because the process can involve multiple steps. The complexity of this biotransformation likely explains the lower accuracy of 73%. Nevertheless, this performance is still better than the structural alerts alone (AUC of 50%, two-sided p-value = 0.0026) and that of logP alone (AUC of 50.5%, two-sided p-value of 0.003).
Nitroaromatics
Nitroaromatics are abundant in nature and the urban environment.48,49 We are frequently exposed to nitroaromatic compounds through daily activities like smoking, inhaling combustion gases, and consumption of grilled food.48,49 The nitroaromatic alert is also an important building block in many pharmaceutical agents.22,50 Unfortunately, some of these drugs cause adverse effects due to reactive metabolite formation.22,50
Nitroaromatic-containing compounds can undergo reductive metabolism through different pathways to form electrophilic, unstable intermediates such as nitroso compounds and nitro anion radicals (Figure 8). These reactive metabolites are responsible for the toxicity of some nitroaromatic containing drugs like tolcapone51 and nimesulide.52 On the other hand, many drugs like aranidipine53 and nifedipine54 are safe and lack reduction at their nitroaromatic group.
Figure 8.
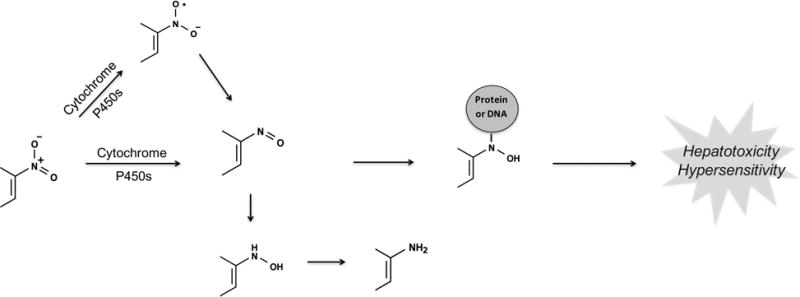
Nitroaromatics are bioactivated through reduction. Nitroaromatic compounds undergo sequential two-electron reductive steps to the nitroso, N-hydroxy, and amine. Alternatively, they can form nitro anion radicals through a one-electron reduction in the absence of oxygen. The reaction chain can also be reversed when an aromatic amine is oxidized to the N-hydroxy/nitroso compound. However, because the intracellular environment is reducing at physiological conditions, the equilibrium usually shifts toward the right.106,107
We used a reduction model to predict which nitroaromatic-containing drugs are bioactivated through reduction (Figure 9). The reduction model identified bioactivated nitroaromatics with an AUC of 93%, which significantly outperforms the structural alert alone (two-sided p-value = 0.0002). This performance also is significantly better than that of logP alone (AUC of 77%, two-sided p-value of 0.048). Compared to the other structural alerts examined in this study, the nitroaromatic moiety is the most frequently bioactivated (51%) (Table 1). Nevertheless, nitroaromatic groups can be part of the pharmacophore, and nitro reduction is required for drugs like the antibiotic nitazoxanide and metronidazole to exert their pharmacological effects.55,56 So, this strong performance is encouraging and might effectively guide the safe use of nitroaromatics.
Figure 9.
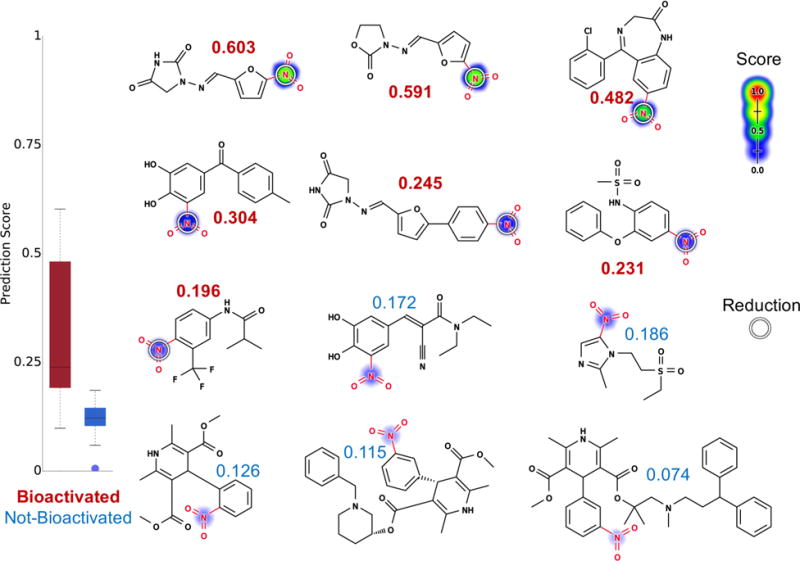
Metabolism model identifies which nitroaromatics (highlighted in red) are bioactivated. Twelve examples from the nitroaromatic evaluation set, from left to right, top to bottom: nitrofurantoin,108 furazolidone,109 clonazepam,54 tolcapone,51 dantrolene,52,110 nimesulide,52 flutamide,52 entacapone,106,111 tinidazole,112 nifedipine,54 benidipine, and lercanidipine. The remaining molecules and their prediction are reported in the Supporting Information (Table S3). Site reduction scores are indicated by color shading, ranging from red (1.0 highly probable) to white (0.0, low probability). Experimentally observed sites of reduction are indicated by white circles. Attached numbers are molecule reduction scores. The reduction model was able to assign drugs that are known to be bioactivated at nitroaromatic structural alerts (scores in red) with higher scores than those that do not (scores in blue). The model AUC accuracy on the nitroaromatic evaluation set is 93% (significantly outperforms the structural alert approach, two-sided p-value = 0.0002).
Thiophenes
Thiophene derivatives are ubiquitous in the environment as well as in many drugs on the market.21 Thiophene-containing compounds have a wide range of pharmacological properties, such as nematocidal, insecticidal, antifungal, antiviral, and antioxidant effects.57–62 For example, thiophene is a critical pharmacophore of antithrombotic drugs like clopidogrel.63
Thiophenes can undergo oxidative metabolism through different pathways to form electrophilic, unstable intermediates such as thiophene S-oxides, thiophene epoxides, and sulfenic acids (Figure 10).21,64–66 Formation of reactive, electrophilic intermediates by the oxidative metabolism of thiophenes can induce toxicity, as reported for suprofen and tienilic acid.65–70 On the other hand, thiophene-containing drugs like eprosartan and rivaroxaban are neither bioactivated nor toxic.
Figure 10.
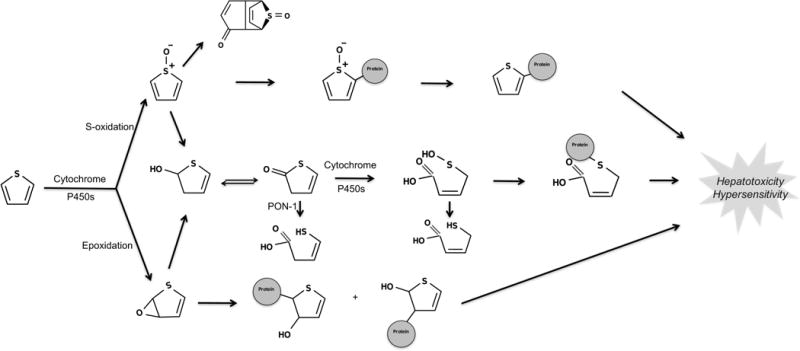
Thiophene is bioactivated through S-oxidation and epoxidation. The two bioactivation pathways of thiophene structural alerts are epoxidation and S-oxidation.21,65,82 Cytochrome P450s are the major catalyzing enzymes of both pathways. These pathways yield electrophilic, unstable thiophene S-oxides,64 thiophene epoxides,69 and sulfenic acids.66 Notably, mass spectrometry experiments cannot reliably determine which bioactivation pathway leads to reactive metabolites because the thiophene S-oxide and the thiophene epoxide have the same mass and charge. This creates some ambiguity in the literature about the exact pathway by which some thiophenes are bioactivated.
There is disagreement in the literature about the dominant pathway of bioactivation in thiophenes. Some have argued that, at least in specific cases like suprofen, epoxidation is more important than S-oxidation.69,71 However, others have argued that S-oxidation is generally more important.72–79 In this analysis, therefore, we consider both S-oxidation and epoxidation, and aim to study empirically which model best discriminates bioactivated molecules.
We evaluated three models: the epoxidation model, the S-oxidation model, and a model that mathematically combines predictions from both models. The final model combines epoxidation and S-oxidation predictions using the probabilistic OR function. This combined score reflects the probability that a thiophene will be bioactivated by either pathway if both models are relevant. These three models were assessed by their performances at identifying bioactivated thiophenes (Table 2).
Table 2.
AUC Accuracies of Metabolism Models on the Thiophene Training and Testing Data Setsa
| training set
|
evaluation set
|
|||||
|---|---|---|---|---|---|---|
| S-oxidized | epoxidized | bioactivated | S-oxidized | epoxidized | bioactivated | |
| S-oxidized score | 92.2%* | 69.6% | 93.7%* | 87.9%* | 85.3%* | 87.9%* |
| epoxidized score | 57.8% | 65.8% | 67.6% | 67.9% | 60.0% | 67.9% |
| combined score | 82.5%* | 66.4% | 86.7%* | 75.4%* | 70.7% | 75.4%* |
Rows correspond to prediction scores and columns correspond to classification tasks (e.g., S-oxidized versus not-S-oxidized). Highest accuracies are in bold font, accuracies that are not statistically different from the highest prediction are italicized, and AUC accuracies that are statistically better than the accuracy of the random model are indicated with an asterisk.
We find that the S-oxidation model identifies bioactivated thiophenes with an AUC of 88%, better than both the epoxidation and combined models. Remarkably, the S-oxidation model separates epoxidized from not-epoxidized thiophenes better than the epoxidation model (AUC of 85% versus 60%). This surprising result reflects the controversy in the literature about the dominant pathway of thiophene bioactivation.
Certainly, some thiophenes are epoxidized,69 but in most research studies, the experiments necessary to discriminate between epoxidation and S-oxidation are not performed. Both the S-oxide and epoxide metabolites result from the transfer of oxygen to the nucleophilic S atom or double bond center of the thiophene. Consequently, S-oxide and epoxide metabolites look identical in mass spectrometric analysis used in most drug metabolism studies, as both are 16 mass units higher than the parent compound without a change in charge.69,80,81 Indeed, uncertainties in the site or type of reactions are quite common in metabolic data but for this case are consequential because most studies cannot reliably determine which pathway leads to the reactive metabolite. Moreover, both pathways can produce 5-hydroxyl thiophene and other downstream metabolites (Figure 10). When a downstream metabolite is observed, the presence of both short-lived S-oxide and epoxide thiophene are inferred. In this context, it is possible that there is a tendency to misreport S-oxidations as epoxidations, especially if thiophene epoxidations are less common than S-oxidation.
The model’s output in suprofen has direct relevance to the debate in the literature about S-oxidation and epoxidation of thiophene rings. O’Donnell et al. conclude that suprofen 5-hydroxythiophene was formed via epoxidation based on 18O incorporation analysis.69 This evidence, however, does not exclude suprofen bioactivation via S-oxidation. Our model predicts that epoxidation is slightly more likely than S-oxidation in this case (probability 0.63 vs 0.49), but this is far from definitive. Encouragingly, our model’s assessment is echoed by the same authors two years later in a review of bioactivation,12 where they note that suprofen might be epoxidized instead of being S-oxidized, as they had originally reported. It would be interesting to see if the epoxidation pathway, which is predicted slightly more likely, could be confirmed in a more discriminative experiment. This, however, is beyond the scope of the current study, and we are encouraged that our model produces results consistent with the literature.82
Figure 11 depicts 12 example molecules: suprofen,69,82 zileuton,74 ticrynafen (tienilic acid),83 methapyrilene,84 duloxetine,85 tiaprofenic acid, eprosartan,86 brotizolam,87 rotigotine, rivaroxaban, dorzolamide, and olanzapine.88,89 The first four drugs have been reported to form reactive metabolites through either S-oxidation or epoxidation catalyzed by cytochrome P450, while the other seven drugs do not undergo bioactivation within thiophene rings. All of these bioactivated drugs have been withdrawn from the market for reactive-metabolite-related toxicity (Table S4). The model AUC of 88% accuracy is better than the structural alert one (AUC of 50%, two-sided p-value = 0.009) and that of logP alone (AUC of 50.8%, two-sided p-value of 0.01).
Figure 11.
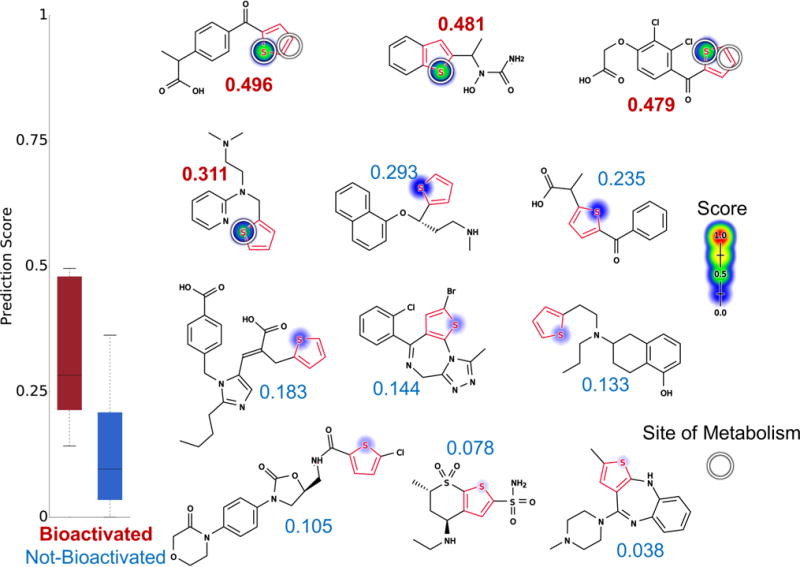
Metabolism model identifies whether thiophenes (highlighted in red) are bioactivated. Twelve examples from the thiophene evaluation set, from left to right, top to bottom: suprofen,69,82 zileuton,74 ticrynafen (tienilic acid),83 methapyrilene,84 duloxetine,85 tiaprofenic acid, eprosartan,86 brotizolam,87 rotigotine, rivaroxaban, dorzolamide, and olanzapine.88,89 The remaining molecules and their predictions are reported in the Supporting Information (Table S4). S-oxidation model predictions are used to shade atoms, ranging from red (1.0, likely) to white (0.0, unlikely). Experimentally observed sites of S-oxidation (atoms) and epoxidation (bonds) are highlighted by white circles. The numbers are the numerical scores of the S-oxidation model, with bioactivated molecules scored in red and not-bioactivated molecules scored in blue. The model’s AUC accuracy on the thiophene evaluation set is 88% (statistically outperforming the structural alert approach, two-sided p-value = 0.009).
Combining the Alerts
In practice, molecules can have more than one structural alert at a time. An integrated model that can predict the bioactivation of all alerts in a molecule is important in this case. Theoretically speaking, it is possible for each model to correctly predict the bioactivation of each alert (Table 3) but then fail when combined if they are poorly scaled and require different cutoff scores for each alert (Table 4). Encouragingly, the global AUC across all alerts in the combined evaluation data set of 188 molecules is 74.0%, indicating that this issue is not a limiting problem with this approach (Figure 12). Moreover, the AUC can be improved to 81.1% by rescaling the scores of each model using the relevant structural alert evaluation set (Figure 12). This improvement is not statistically significant. Nonetheless, the result is encouraging and suggests that a similar scaling may be useful as we expand to additional structural alerts in the future. Furthermore, across all molecules in the combined evaluation set that are bioactivated, the combined model assigns the bioactivated structural alert with higher scores than the rest of the molecule 100% of the time (both unscaled and scaled).
Table 3.
Accuracy on Training and Evaluation Sets of Four Structural Alertsa
| structural alert | model | training set
|
evaluation set
|
||||
|---|---|---|---|---|---|---|---|
| AUC | sensitivity | specificity | AUC | sensitivity | specificity | ||
| furan | epoxidation | 53.3% | 60.0% | 66.7% | 100.0%* | 100.0% | 100.0% |
| phenol | quinone formation | 85.7%* | 81.1% | 78.7% | 73.4%* | 61.3% | 76.1% |
| nitroaromatic | reduction | 71.4%* | 70.8% | 74.3% | 92.9%* | 87.5% | 86.7% |
| thiophene | S-oxidation | 87.4%* | 93.3% | 74.3% | 87.9%* | 87.5% | 78.2% |
Sensitivity and specificity were calculated with the optimal cutoff point (closest to the upper left corner) on the ROC curve. AUC accuracies that are statistically better than the accuracy of the random model are indicated with an asterisk.
Table 4.
Sensitivity and Specificity at the Optimal Cutoff Points on the ROC Curves of Unscaled and Scaled Scores on the Combined Evaluation Seta
| structural alert | model | unscaled score
|
scaled score
|
||
|---|---|---|---|---|---|
| sensitivity | specificity | sensitivity | specificity | ||
| furan | epoxidation | 100.0% | 100.0% | 100.0% | 100.0% |
| phenol | quinone formation | 80.6% | 45.6% | 54.8% | 89.1% |
| nitroaromatic | reduction | 62.5% | 100.0% | 93.7% | 73.3% |
| thiophene | S-oxidation | 62.5% | 73.9% | 50.0% | 91.3% |
The scaling does not reorder predictions, so the AUC remains unchanged from Table 3.
Figure 12.
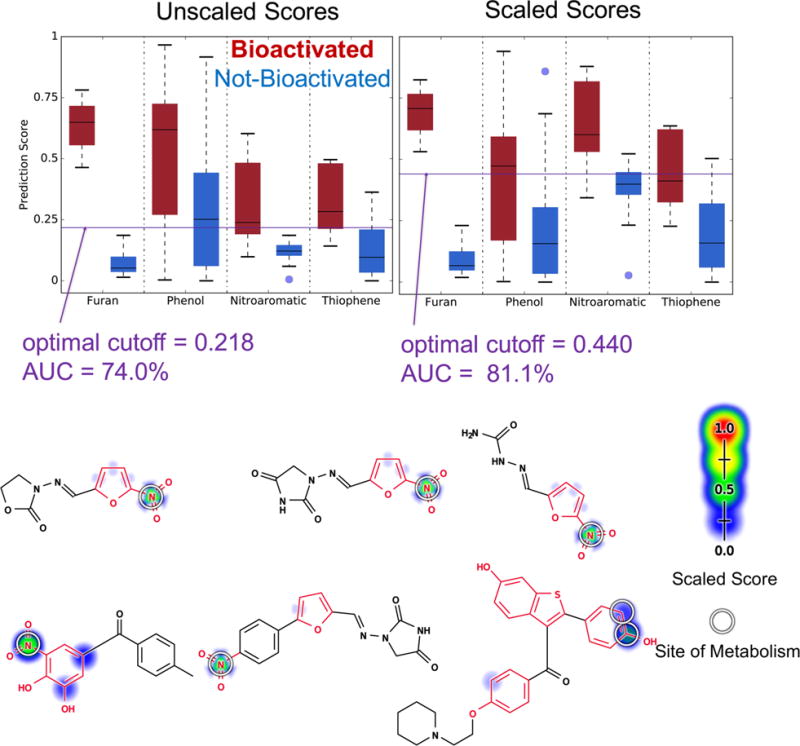
Integrated model identifies which structural alerts in the combined evaluation set are bioactivated. Cross-validated scaled predictions within structural alerts are indicated by the colored shading on atoms and bonds. Experimentally observed sites of metabolism are indicated by white circles. Unscaled score global AUC is 74.0%, and the scaled score global AUC is 81.1%. The two accuracies are not statistically different (two-sided p-value = 0.199). Six molecules in the combined evaluation set that have more than one type of structural alert (highlighted in red) and are bioactivated from left to right, top to bottom are nitrofurantoin, furazolidone, nitrofural, tolcapone, dantrolene, and raloxifene. The combined model, both scaled and unscaled, correctly identifies the bioactivated structural alert of these compounds 100% of the time.
Limitations and Future Work
The most obvious limitation of this approach is that it only includes four structural alerts. Clearly, bioactivation of other structural alerts will not be handled by the current method. Nevertheless, this quality is not an intrinsic limitation, and our future work will expand this approach to all commonly observed alerts. While not definitive, these initial results are encouraging and suggest that metabolism modeling is broadly applicable. Our models performed far better than structural alerts alone and made quantitative predictions about how drugs will be bioactivated. As is expected in any modeling strategy, the current models do not make perfect predictions all cases. However, this strategy benefits from improved modeling approaches and data as they are developed, and we expect performance improvements as we refine our models. Ultimately, this approach might be most useful in identifying and prioritizing the most likely bioactivation pathways for a given molecule for follow-up. Mechanistic and systematic predictions of bioactivation enable focused experimental studies to confirm or rule out reactive metabolites in specific cases. More significantly, some metabolites that are formed from structural alerts are not reactive. For example, only a subset of quinones formed from phenols are actually reactive. Side chains can tune quinone reactivity up or down, and we expect better utility by combining predictions of quinone formation with predictions of the reactivity of quinone metabolites. We have already published accurate models of metabolite reactivity90,91 and plan to combine these with predictions of metabolites in our future work.
Perhaps most importantly, the toxicity profile of a drug reflects an intricate interplay of multiple factors, including dosage, competing metabolic pathways, the reactivity of its metabolites, and coadministration of other medicines. For example, reducing daily dose to under 20 mg/day can substantially reduce toxicity risk.24 These factors can be complex and hard to model. For instance, while acetaminophen overdose accounts for more than 50% of drug-induced primary liver failure cases in the U.S., the drug is generally safe when consumed at its therapeutic dose.9,92 At therapeutic doses, 85% of the administered acetaminophen undergoes phase II conjugation reactions and is primarily excreted in the urine as the corresponding O-glucuronide or O-sulfate.93 Only 15% of the administered dose undergoes phase I oxidation reaction to form the reactive N-acetyl-p-benzoquinoneimine (NAPQI) species. At safe doses of acetaminophen, the small amount of NAPQI is neutralized and removed by reduced glutathione (GSH) through conjugation.12 However, at higher doses, elevated amounts of NAPQI overwhelm GSH reserves, and the reactive NAPQI starts covalently binding to macromolecules and eventually disrupts cellular homeostasis. In future studies, we will move closer to predicting toxicity by integrating individual metabolism models94–97 with further tools to incorporate competing and sequential processes that occur in vivo and then couple them to models of reactivity,28,90 a key driver of drug toxicity.
CONCLUSION
Structural alerts are commonly used to identify molecules likely to produce reactive metabolites. Unfortunately, alerts are not precise and incorrectly flag many safe molecules. This study demonstrated that metabolism models can improve the specificity of structural alerts by computationally modeling the relevant metabolism pathways. Our models predicted epoxidation of furans, quinone formation of phenols, nitrogenreduction of nitroaromatics, and sulfur-oxidation of thiophenes with AUC performances of 100%, 73%, 93%, and 88%, respectively. While we have not comprehensively covered all structural alerts or handled all the relevant complexities, our success suggests that computationally modeling metabolism could improve the interpretability of many structural alerts. Ultimately, we envision that models of metabolism coupled to models of toxicity will form a powerful new approach for assessing the IADR risk of drug candidates.
Supplementary Material
Acknowledgments
We thank Matthew Matlock for previous development of the XenoSite algorithm, which is expanded in this study. We also thank the developers of the open-source cheminformatics tools Open Babel and RDKit, of which we made significant use.
Funding
Research reported in this publication was supported by the National Library of Medicine of the National Institutes of Health (NIH) under award numbers R01LM012222 and R01LM012482. Computations were performed using the facilities of the Washington University Center for High Performance Computing, which were partially funded by NIH grant numbers 1S10RR022984-01A1 and 1S10OD018091-01. N.L.D. was partially supported by NIH Medical Scientist Training Program grant GM07200. We also thank both the Department of Immunology and Pathology at the Washington University School of Medicine and the Washington University Center for Biological Systems Engineering for their generous support of this work.
ABBREVIATIONS
- AMD
Accelrys Metabolite Database
- AUC
area under the receiver operating characteristic curve
- BA
bioactivated
- NBA
not bioactivated
- FDA
U.S. Food and Drug Administration
- GSH
glutathione
- HLM
human liver microsomes
- IADR
idiosyncratic adverse drug reactions
- NAPQI
N-acetyl-p-benzoquinoneimine
- P450
cytochrome P450s
Footnotes
Supporting Information
The Supporting Information is available free of charge on the ACS Publications website at DOI: 10.1021/acs.chemrestox.6b00336.
Full list of the furan, phenol, nitroaromatic, and thiophene evaluation sets and their predictions from the corresponding models; unique molecule IDs after merging duplicate molecules, all AMD molecule and reaction registry numbers associated with each molecule, and the metabolism status of each molecule in the training set (ZIP)
ORCID
Tyler B. Hughes: 0000-0001-6221-9014
S. Joshua Swamidass: 0000-0003-2191-0778
Notes
The content is solely the responsibility of the authors and does not necessarily represent the official views of the National Institutes of Health.
The authors declare no competing financial interest.
References
- 1.Lasser KE, Allen PD, Woolhandler SJ, Himmelstein DU, Wolfe SM, Bor DH. Timing of new black box warnings and withdrawals for prescription medications. J Am Med Assoc. 2002;287:2215–2220. doi: 10.1001/jama.287.17.2215. [DOI] [PubMed] [Google Scholar]
- 2.Watkins PB, Seeff LB. Drug-induced liver injury: Summary of a single topic clinical research conference. Hepatology. 2006;43:618–631. doi: 10.1002/hep.21095. [DOI] [PubMed] [Google Scholar]
- 3.Miller EC, Miller JA. The presence and significance of bound aminoazo dyes in the livers of rats fed p-dimethylaminoazobenzene. Cancer Res. 1947;7:468–480. [Google Scholar]
- 4.Miller EC, Miller JA. In vivo combinations between carcinogens and tissue constituents and their possible role in carcinogenesis. Cancer Res. 1952;12:547–556. [PubMed] [Google Scholar]
- 5.Brodie BB, Reid WD, Cho AK, Sipes G, Krishna G, Gillette JR. Possible mechanism of liver necrosis caused by aromatic organic compounds. Proc Natl Acad Sci U S A. 1971;68:160–164. doi: 10.1073/pnas.68.1.160. [DOI] [PMC free article] [PubMed] [Google Scholar]
- 6.Gillette JR, Mitchell JR, Brodie BB. Biochemical mechanisms of drug toxicity. Annu Rev Pharmacol. 1974;14:271–288. [Google Scholar]
- 7.Park BK, Kitteringham NR, Maggs JL, Pirmohamed M, Williams DP. The role of metabolic activation in drug-induced hepatotoxicity. Annu Rev Pharmacol Toxicol. 2005;45:177–202. doi: 10.1146/annurev.pharmtox.45.120403.100058. [DOI] [PubMed] [Google Scholar]
- 8.Nelson SD, Pearson PG. Covalent and noncovalent interactions in acute lethal cell injury caused by chemicals. Annu Rev Pharmacol Toxicol. 1990;30:169–195. doi: 10.1146/annurev.pa.30.040190.001125. [DOI] [PubMed] [Google Scholar]
- 9.Guengerich FP, MacDonald JS. Applying mechanisms of chemical toxicity to predict drug safety. Chem Res Toxicol. 2007;20:344–369. doi: 10.1021/tx600260a. [DOI] [PubMed] [Google Scholar]
- 10.Tang W, Lu AY. Metabolic bioactivation and drug-related adverse effects: current status and future directions from a pharmaceutical research perspective. Drug Metab Rev. 2010;42:225–249. doi: 10.3109/03602530903401658. [DOI] [PubMed] [Google Scholar]
- 11.Jaeschke H, Gores GJ, Cederbaum AI, Hinson JA, Pessayre D, Lemasters JJ. Mechanisms of hepatotoxicity. Toxicol Sci. 2002;65:166–176. doi: 10.1093/toxsci/65.2.166. [DOI] [PubMed] [Google Scholar]
- 12.Kalgutkar AS, Gardner I, Obach RS, Shaffer CL, Callegari E, Henne KR, Mutlib AE, Dalvie DK, Lee JS, Nakai Y, O’Donnell JP, Boer J, Harriman SP. A comprehensive listing of bioactivation pathways of organic functional groups. Curr Drug Metab. 2005;6:161–225. doi: 10.2174/1389200054021799. [DOI] [PubMed] [Google Scholar]
- 13.Stepan AF, Walker DP, Bauman J, Price DA, Baillie TA, Kalgutkar AS, Aleo MD. Structural alert/reactive metabolite concept as applied in medicinal chemistry to mitigate the risk of idiosyncratic drug toxicity: a perspective based on the critical examination of trends in the top 200 drugs marketed in the United States. Chem Res Toxicol. 2011;24:1345–1410. doi: 10.1021/tx200168d. [DOI] [PubMed] [Google Scholar]
- 14.Ellison CM, Sherhod R, Cronin MT, Enoch SJ, Madden JC, Judson PN. Assessment of methods to define the applicability domain of structural alert models. J Chem Inf Model. 2011;51:975–985. doi: 10.1021/ci1000967. [DOI] [PubMed] [Google Scholar]
- 15.Baell JB, Holloway GA. New substructure filters for removal of pan assay interference compounds (PAINS) from screening libraries and for their exclusion in bioassays. J Med Chem. 2010;53:2719–2740. doi: 10.1021/jm901137j. [DOI] [PubMed] [Google Scholar]
- 16.Hann M, Hudson B, Lewell X, Lifely R, Miller L, Ramsden N. Strategic pooling of compounds for high-throughput screening. J Chem Inf Comput Sci. 1999;39:897–902. doi: 10.1021/ci990423o. [DOI] [PubMed] [Google Scholar]
- 17.Claesson A, Spjuth O. On mechanisms of reactive metabolite formation from drugs. Mini-Rev Med Chem. 2013;13:720–729. doi: 10.2174/1389557511313050009. [DOI] [PubMed] [Google Scholar]
- 18.Kalgutkar A. Should the Incorporation of Structural Alerts be Restricted in Drug Design? An Analysis of Structure-Toxicity Trends with Aniline-Based Drugs. Curr Med Chem. 2015;22:438–464. doi: 10.2174/0929867321666141112122118. [DOI] [PubMed] [Google Scholar]
- 19.Evans DC, Watt AP, Nicoll-Griffith DA, Baillie TA. Drug-protein adducts: an industry perspective on minimizing the potential for drug bioactivation in drug discovery and development. Chem Res Toxicol. 2004;17:3–16. doi: 10.1021/tx034170b. [DOI] [PubMed] [Google Scholar]
- 20.Williams G, Mattia A, Renwick A. Safety Evaluation of Certain Food Additives: Furan-Substituted Aliphatic Hydrocarbons, Alcohols, Aldehydes, Ketones, Carboxylic Acids and Related Esters, Sulfides, Disulfides and Ethers (Addendum) World Health Organization; Geneva, Switzerland: 2009. p. 481. [Google Scholar]
- 21.Dalvie DK, Kalgutkar AS, Khojasteh-Bakht SC, Obach RS, O’Donnell JP. Biotransformation reactions of five-membered aromatic heterocyclic rings. Chem Res Toxicol. 2002;15:269–299. doi: 10.1021/tx015574b. [DOI] [PubMed] [Google Scholar]
- 22.Nelson SD. Biological Reactive Intermediates VI. Springer; Berlin, Germany: 2001. pp. 33–43. [Google Scholar]
- 23.Rybacka A, Rudén C, Tetko IV, Andersson PL. Identifying potential endocrine disruptors among industrial chemicals and their metabolites-development and evaluation of in silico tools. Chemosphere. 2015;139:372–378. doi: 10.1016/j.chemosphere.2015.07.036. [DOI] [PubMed] [Google Scholar]
- 24.Kalgutkar AS, Didiuk MT. Structural alerts, reactive metabolites, and protein covalent binding: how reliable are these attributes as predictors of drug toxicity? Chem Biodiversity. 2009;6:2115–2137. doi: 10.1002/cbdv.200900055. [DOI] [PubMed] [Google Scholar]
- 25.Iverson SL, Uetrecht JP. Identification of a reactive metabolite of terbinafine: insights into terbinafine-induced hepatotoxicity. Chem Res Toxicol. 2001;14:175–181. doi: 10.1021/tx0002029. [DOI] [PubMed] [Google Scholar]
- 26.Alves VM, Muratov EN, Capuzzi SJ, Politi R, Low Y, Braga RC, Zakharov AV, Sedykh A, Mokshyna E, Farag S, Andrade CH, Kuz’min VE, Fourchesh D, Tropsha A. Alarms about structural alerts. Green Chem. 2016;18:4348–4360. doi: 10.1039/C6GC01492E. [DOI] [PMC free article] [PubMed] [Google Scholar]
- 27.Hughes TB, Swamidass SJ. Deep Learning to Predict the Formation of Quinone Species in Drug Metabolism. Chem Res Toxicol. 2017;30:642–656. doi: 10.1021/acs.chemrestox.6b00385. [DOI] [PMC free article] [PubMed] [Google Scholar]
- 28.Hughes TB, Miller GP, Swamidass SJ. Modeling epoxidation of drug-like molecules with a deep machine learning network. ACS Cent Sci. 2015;1:168–180. doi: 10.1021/acscentsci.5b00131. [DOI] [PMC free article] [PubMed] [Google Scholar]
- 29.Matlock MK, Hughes TB, Swamidass SJ. XenoSite server: a web-available site of metabolism prediction tool. Bioinformatics. 2015;31:1136–1137. doi: 10.1093/bioinformatics/btu761. [DOI] [PubMed] [Google Scholar]
- 30.Swamidass SJ, Azencott CA, Daily K, Baldi P. A CROC stronger than ROC: measuring, visualizing and optimizing early retrieval. Bioinformatics. 2010;26:1348–1356. doi: 10.1093/bioinformatics/btq140. [DOI] [PMC free article] [PubMed] [Google Scholar]
- 31.Hanley JA, McNeil BJ. The meaning and use of the area under a receiver operating characteristic (ROC) curve. Radiology. 1982;143:29–36. doi: 10.1148/radiology.143.1.7063747. [DOI] [PubMed] [Google Scholar]
- 32.Lipinski CA, Lombardo F, Dominy BW, Feeney PJ. Experimental and computational approaches to estimate solubility and permeability in drug discovery and development settings. Adv Drug Delivery Rev. 1997;23:3–25. doi: 10.1016/s0169-409x(00)00129-0. [DOI] [PubMed] [Google Scholar]
- 33.Hughes JD, et al. Physiochemical drug properties associated with in vivo toxicological outcomes. Bioorg Med Chem Lett. 2008;18:4872–4875. doi: 10.1016/j.bmcl.2008.07.071. [DOI] [PubMed] [Google Scholar]
- 34.Wishart DS, Knox C, Guo AC, Cheng D, Shrivastava S, Tzur D, Gautam B, Hassanali M. DrugBank: a knowledgebase for drugs, drug actions and drug targets. Nucleic Acids Res. 2008;36:D901–D906. doi: 10.1093/nar/gkm958. [DOI] [PMC free article] [PubMed] [Google Scholar]
- 35.Sunesson A, Vaes W, Nilsson C, Blomquist G, Andersson B, Carlson R. Identification of volatile metabolites from five fungal species cultivated on two media. Appl Environ Microbiol. 1995;61:2911–2918. doi: 10.1128/aem.61.8.2911-2918.1995. [DOI] [PMC free article] [PubMed] [Google Scholar]
- 36.Saunders R, Griffith J, Saalfeld F. Identification of some organic smog components based on rain water analysis. Biol Mass Spectrom. 1974;1:192–194. doi: 10.1002/bms.1200010309. [DOI] [PubMed] [Google Scholar]
- 37.Peterson LA. Reactive metabolites in the biotransformation of molecules containing a furan ring. Chem Res Toxicol. 2013;26:6–25. doi: 10.1021/tx3003824. [DOI] [PMC free article] [PubMed] [Google Scholar]
- 38.Zhou S, Koh HL, Gao Y, Gong Z-Y, Lee EJD. Herbal bioactivation: the good, the bad and the ugly. Life Sci. 2004;74:935–968. doi: 10.1016/j.lfs.2003.09.035. [DOI] [PMC free article] [PubMed] [Google Scholar]
- 39.Masubuchi N, Makino C, Murayama N. Prediction of in vivo potential for metabolic activation of drugs into chemically reactive intermediate: correlation of in vitro and in vivo generation of reactive intermediates and in vitro glutathione conjugate formation in rats and humans. Chem Res Toxicol. 2007;20:455–464. doi: 10.1021/tx060234h. [DOI] [PubMed] [Google Scholar]
- 40.Mitchell JR, Snodgrass WR, Gillette JR. The role of biotransformation in chemical-induced liver injury. Environ Health Perspect. 1976;15:27. doi: 10.1289/ehp.761527. [DOI] [PMC free article] [PubMed] [Google Scholar]
- 41.Mitchell J, Potter W, Jollow D. Proceedings of the Federation of American Societies for Experimental Biology. Federation of American Societies for Experimental Biology; Bethesda, MD: 1973. Furosemide-induced Hepatic and Renal Tubular Necrosis; p. 305. [Google Scholar]
- 42.Mitchell J, Potter W, Hinson J, Jollow D. Hepatic necrosis caused by furosemide. Nature. 1974;251:508. doi: 10.1038/251508a0. [DOI] [PubMed] [Google Scholar]
- 43.Wirth PJ, Bettis CJ, Nelson WL. Microsomal metabolism of furosemide evidence for the nature of the reactive intermediate involved in covalent binding. Mol Pharmacol. 1976;12:759–768. [PubMed] [Google Scholar]
- 44.Bell J, Dallas F, Jenner W, Martin L. The metabolism of ranitidine in animals and man. Biochem Soc Trans. 1980;8:93–93. doi: 10.1042/bst0080093. [DOI] [PubMed] [Google Scholar]
- 45.Koenigs LL, Trager WF. Mechanism-based inactivation of cytochrome P450 2B1 by 8-methoxypsoralen and several other furanocoumarins. Biochemistry. 1998;37:13184–13193. doi: 10.1021/bi981198r. [DOI] [PubMed] [Google Scholar]
- 46.Erve J, Vashishtha S, Ojewoye O, Adedoyin A, Espina R, DeMaio W, Talaat R. Metabolism of prazosin in rat and characterization of metabolites in plasma, urine, faeces, brain and bile using liquid chromatography/mass spectrometry (LC/MS) Xenobiotica. 2008;38:540–558. doi: 10.1080/00498250802001826. [DOI] [PubMed] [Google Scholar]
- 47.Testa B, Pedretti A, Vistoli G. Reactions and enzymes in the metabolism of drugs and other xenobiotics. Drug Discovery Today. 2012;17:549–560. doi: 10.1016/j.drudis.2012.01.017. [DOI] [PubMed] [Google Scholar]
- 48.Purohit V, Basu AK. Mutagenicity of nitroaromatic compounds. Chem Res Toxicol. 2000;13:673–692. doi: 10.1021/tx000002x. [DOI] [PubMed] [Google Scholar]
- 49.Ritter CL, Malejka-Giganti D. Nitroreduction of nitrated and C-9 oxidized fluorenes in vitro. Chem Res Toxicol. 1998;11:1361–1367. doi: 10.1021/tx980152w. [DOI] [PubMed] [Google Scholar]
- 50.Williams DP, Naisbitt DJ. Toxicophores: groups and metabolic routes associated with increased safety risk. Curr Opin Drug Discovery Dev. 2002;5:104–115. [PubMed] [Google Scholar]
- 51.Olanow CW. Tolcapone and hepatotoxic effects. Arch Neurol. 2000;57:263–267. doi: 10.1001/archneur.57.2.263. [DOI] [PubMed] [Google Scholar]
- 52.Leone A, Nie A, Brandon Parker J, Sawant S, Piechta LA, Kelley MF, Mark Kao L, Jim Proctor S, Verheyen G, Johnson MD, Lord PG, McMillian MK. Oxidative stress/reactive metabolite gene expression signature in rat liver detects idiosyncratic hepatotoxicants. Toxicol Appl Pharmacol. 2014;275:189–197. doi: 10.1016/j.taap.2014.01.017. [DOI] [PubMed] [Google Scholar]
- 53.Tian L, Jiang J, Huang Y, Xu L, Liu H, Li Y. Determination of aranidipine and its active metabolite in human plasma by liquid chromatography/negative electrospray ionization tandem mass spectrometry. Rapid Commun Mass Spectrom. 2006;20:2871–2877. doi: 10.1002/rcm.2663. [DOI] [PubMed] [Google Scholar]
- 54.Rosen GM, Demos HA, Rauckman EJ. Not all aromatic nitro compounds form free radicals. Toxicol Lett. 1984;22:145–152. doi: 10.1016/0378-4274(84)90058-4. [DOI] [PubMed] [Google Scholar]
- 55.Sisson G, Goodwin A, Raudonikiene A, Hughes NJ, Mukhopadhyay AK, Berg DE, Hoffman PS. Enzymes associated with reductive activation and action of nitazoxanide, nitrofurans, and metronidazole in Helicobacter pylori. Antimicrob Agents Chemother. 2002;46:2116–2123. doi: 10.1128/AAC.46.7.2116-2123.2002. [DOI] [PMC free article] [PubMed] [Google Scholar]
- 56.Ings RM, McFadzean JA, Ormerod WE. The mode of action of metronidazole in Trichomonas vaginalis and other micro-organisms. Biochem Pharmacol. 1974;23:1421–1429. doi: 10.1016/0006-2952(74)90362-1. [DOI] [PubMed] [Google Scholar]
- 57.Bakker J, Gommers F, Nieuwenhuis I, Wynberg H. Photoactivation of the nematicidal compound alpha-terthienyl from roots of marigolds (Tagetes species). A possible singlet oxygen role. J Biol Chem. 1979;254:1841–1844. [PubMed] [Google Scholar]
- 58.Iyengar S, Arnason J, Philogene B, Morand P, Werstiuk N, Timmins G. Toxicokinetics of the phototoxic allelochemical α-terthienyl in three herbivorous Lepidoptera. Pestic Biochem Physiol. 1987;29:1–9. [Google Scholar]
- 59.Matsuura H, Saxena G, Farmer S, Hancock R, Towers G. Antibacterial and antifungal polyine compounds from Glehnia littoralis ssp. leiocarpa. Planta Med. 1996;62:256–259. doi: 10.1055/s-2006-957872. [DOI] [PubMed] [Google Scholar]
- 60.Chan G, Towers GN, Mitchell J. Ultraviolet-mediated antibiotic activity of thiophene compounds of Tagetes. Phytochemistry. 1975;14:2295–2296. [Google Scholar]
- 61.Hudson J, Graham E, Miki N, Towers G, Hudson L, Rossi R, Carpita A, Neri D. Photoactive antiviral and cytotoxic activities of synthetic thiophenes and their acetylenic derivatives. Chemosphere. 1989;19:1329–1343. [Google Scholar]
- 62.Malmström J, Jonsson M, Cotgreave IA, Hammarström L, Sjödin M, Engman L. The antioxidant profile of 2, 3-dihydrobenzo [b] furan-5-ol and its 1-thio, 1-seleno, and 1-telluro analogues. J Am Chem Soc. 2001;123:3434–3440. doi: 10.1021/ja0035811. [DOI] [PubMed] [Google Scholar]
- 63.Farid NA, Kurihara A, Wrighton SA. Metabolism and disposition of the thienopyridine antiplatelet drugs ticlopidine, clopidogrel, and prasugrel in humans. J Clin Pharmacol. 2010;50:126–142. doi: 10.1177/0091270009343005. [DOI] [PubMed] [Google Scholar]
- 64.Dansette P, Do CT, Amri HE, Mansuy D. Evidence for thiophene-S-oxide as a primary reactive metabolite of thiophene in vivo: formation of a dihydrothiophene sulfoxide mercapturic acid. Biochem Biophys Res Commun. 1992;186:1624–1630. doi: 10.1016/s0006-291x(05)81594-3. [DOI] [PubMed] [Google Scholar]
- 65.Dansette PM, Bertho G, Mansuy D. First evidence that cytochrome P450 may catalyze both S-oxidation and epoxidation of thiophene derivatives. Biochem Biophys Res Commun. 2005;338:450–455. doi: 10.1016/j.bbrc.2005.08.091. [DOI] [PubMed] [Google Scholar]
- 66.Mansuy D, Dansette PM. Sulfenic acids as reactive intermediates in xenobiotic metabolism. Arch Biochem Biophys. 2011;507:174–185. doi: 10.1016/j.abb.2010.09.015. [DOI] [PubMed] [Google Scholar]
- 67.McMurtry RJ, Mitchell JR. Renal and hepatic necrosis after metabolic activation of 2-substituted furans and thiophenes, including furosemide and cephaloridine. Toxicol Appl Pharmacol. 1977;42:285–300. doi: 10.1016/0041-008x(77)90005-9. [DOI] [PubMed] [Google Scholar]
- 68.Beaune P, Dansette P, Mansuy D, Kiffel L, Finck M, Amar C, Leroux J, Homberg J. Human anti-endoplasmic reticulum autoantibodies appearing in a drug-induced hepatitis are directed against a human liver cytochrome P-450 that hydroxylates the drug. Proc Natl Acad Sci U S A. 1987;84:551–555. doi: 10.1073/pnas.84.2.551. [DOI] [PMC free article] [PubMed] [Google Scholar]
- 69.O’Donnell JP, Dalvie DK, Kalgutkar AS, Obach RS. Mechanism-based inactivation of human recombinant P450 2C9 by the nonsteroidal anti-inflammatory drug suprofen. Drug Metab Dispos. 2003;31:1369–1377. doi: 10.1124/dmd.31.11.1369. [DOI] [PubMed] [Google Scholar]
- 70.Dreiem A, Fonnum F. Thiophene is toxic to cerebellar granule cells in culture after bioactivation by rat liver enzymes. NeuroToxicology. 2004;25:959–966. doi: 10.1016/j.neuro.2004.04.001. [DOI] [PubMed] [Google Scholar]
- 71.Jaladanki CK, Taxak N, Varikoti RA, Bharatam PV. Toxicity Originating from Thiophene Containing Drugs: Exploring the Mechanism using Quantum Chemical Methods. Chem Res Toxicol. 2015;28:2364–2376. doi: 10.1021/acs.chemrestox.5b00364. [DOI] [PubMed] [Google Scholar]
- 72.Mancy A, Broto P, Dijols S, Dansette PM, Mansuy D. The substrate binding site of human liver cytochrome P450 2C9: an approach using designed tienilic acid derivatives and molecular modeling. Biochemistry. 1995;34:10365–10375. doi: 10.1021/bi00033a007. [DOI] [PubMed] [Google Scholar]
- 73.Ha-Duong NT, Dijols S, Macherey AC, Goldstein JA, Dansette PM, Mansuy D. Ticlopidine as a selective mechanism-based inhibitor of human cytochrome P450 2C19. Biochemistry. 2001;40:12112–12122. doi: 10.1021/bi010254c. [DOI] [PubMed] [Google Scholar]
- 74.Joshi EM, Heasley BH, Chordia MD, Macdonald TL. In vitro metabolism of 2-acetylbenzothiophene: relevance to zileuton hepatotoxicity. Chem Res Toxicol. 2004;17:137–143. doi: 10.1021/tx0341409. [DOI] [PubMed] [Google Scholar]
- 75.Medower C, Wen L, Johnson WW. Cytochrome P450 oxidation of the thiophene-containing anticancer drug 3-[(quinolin-4-ylmethyl)-amino]-thiophene-2-carboxylic acid (4-trifluor-omethoxy-phenyl)-amide to an electrophilic intermediate. Chem Res Toxicol. 2008;21:1570–1577. doi: 10.1021/tx700430n. [DOI] [PubMed] [Google Scholar]
- 76.Graham EE, Walsh RJ, Hirst CM, Maggs JL, Martin S, Wild MJ, Wilson ID, Harding JR, Kenna JG, Peter RM, Williams DP, Park BK. Identification of the thiophene ring of methapyrilene as a novel bioactivation-dependent hepatic toxicophore. J Pharmacol Exp Ther. 2008;326:657–671. doi: 10.1124/jpet.107.135483. [DOI] [PubMed] [Google Scholar]
- 77.Mercer AE, Regan SL, Hirst CM, Graham EE, Antoine DJ, Benson CA, Williams DP, Foster J, Kenna JG, Park BK. Functional and toxicological consequences of metabolic bioactivation of methapyrilene via thiophene S-oxidation: Induction of cell defence, apoptosis and hepatic necrosis. Toxicol Appl Pharmacol. 2009;239:297–305. doi: 10.1016/j.taap.2009.05.027. [DOI] [PubMed] [Google Scholar]
- 78.Grillo MP. Detecting reactive drug metabolites for reducing the potential for drug toxicity. Expert Opin Drug Metab Toxicol. 2015;11:1281–1302. doi: 10.1517/17425255.2015.1048222. [DOI] [PubMed] [Google Scholar]
- 79.Cohen SM, Fukushima S, Gooderham NJ, Guengerich FP, Hecht SS, Rietjens IM, Smith RL, Bastaki M, Harman CL, McGowen MM, Valerio LG, Taylor SV. Safety evaluation of substituted thiophenes used as flavoring ingredients. Food Chem Toxicol. 2017;99:40–59. doi: 10.1016/j.fct.2016.10.023. [DOI] [PubMed] [Google Scholar]
- 80.Du F, Ruan Q, Zhu M, Xing J. Detection and characterization of ticlopidine conjugates in rat bile using high-resolution mass spectrometry: applications of various data acquisition and processing tools. J Mass Spectrom. 2013;48:413–422. doi: 10.1002/jms.3170. [DOI] [PubMed] [Google Scholar]
- 81.Nishiya Y, Hagihara K, Ito T, Tajima M, Miura S-I, Kurihara A, Farid NA, Ikeda T. Mechanism-based inhibition of human cytochrome P450 2B6 by ticlopidine, clopidogrel, and the thiolactone metabolite of prasugrel. Drug Metab Dispos. 2009;37:589–593. doi: 10.1124/dmd.108.022988. [DOI] [PubMed] [Google Scholar]
- 82.Gramec D, Peterlin Mašič L, Sollner Dolenc M. Bioactivation potential of thiophene-containing drugs. Chem Res Toxicol. 2014;27:1344–1358. doi: 10.1021/tx500134g. [DOI] [PubMed] [Google Scholar]
- 83.López-García MP, Dansette PM, Coloma J. Kinetics of tienilic acid bioactivation and functional generation of drug-protein adducts in intact rat hepatocytes. Biochem Pharmacol. 2005;70:1870–1882. doi: 10.1016/j.bcp.2005.09.026. [DOI] [PubMed] [Google Scholar]
- 84.Hamadeh HK, Knight BL, Haugen AC, Sieber S, Amin RP, Bushel PR, Stoll R, Blanchard K, Jayadev S, Tennant RW, Cunningham ML, Afshari CA, Paules RS. Methapyrilene toxicity: anchorage of pathologic observations to gene expression alterations. Toxicol Pathol. 2002;30:470–482. doi: 10.1080/01926230290105712. [DOI] [PubMed] [Google Scholar]
- 85.Chan CY, New LS, Ho HK, Chan ECY. Reversible time-dependent inhibition of cytochrome P450 enzymes by duloxetine and inertness of its thiophene ring towards bioactivation. Toxicol Lett. 2011;206:314–324. doi: 10.1016/j.toxlet.2011.07.019. [DOI] [PubMed] [Google Scholar]
- 86.McClellan KJ, Balfour JA. Eprosartan. Drugs. 1998;55:713–8. doi: 10.2165/00003495-199855050-00011. [DOI] [PubMed] [Google Scholar]
- 87.Senda C, Kishimoto W, Sakai K, Nagakura A, Igarashi T. Identification of human cytochrome P450 isoforms involved in the metabolism of brotizolam. Xenobiotica. 1997;27:913–922. doi: 10.1080/004982597240082. [DOI] [PubMed] [Google Scholar]
- 88.Callaghan JT, Bergstrom RF, Ptak LR, Beasley CM. Olanzapine. Clin Pharmacokinet. 1999;37:177–193. doi: 10.2165/00003088-199937030-00001. [DOI] [PubMed] [Google Scholar]
- 89.Citrome L, Stauffer VL, Chen L, Kinon BJ, Kurtz DL, Jacobson JG, Bergstrom RF. Olanzapine plasma concentrations after treatment with 10, 20, and 40 mg/d in patients with schizophrenia: an analysis of correlations with efficacy, weight gain, and prolactin concentration. J Clin Psychopharmacol. 2009;29:278–283. doi: 10.1097/JCP.0b013e3181a289cb. [DOI] [PubMed] [Google Scholar]
- 90.Hughes TB, Miller GP, Swamidass SJ. Site of Reactivity Models Predict Molecular Reactivity of Diverse Chemicals with Glutathione. Chem Res Toxicol. 2015;28:797–809. doi: 10.1021/acs.chemrestox.5b00017. [DOI] [PMC free article] [PubMed] [Google Scholar]
- 91.Hughes TB, Dang NL, Miller GP, Swamidass SJ. Modeling Reactivity to Biological Macromolecules with a Deep Multitask. ACS Cent Sci. 2016;2:529–537. doi: 10.1021/acscentsci.6b00162. [DOI] [PMC free article] [PubMed] [Google Scholar]
- 92.Kaplowitz N. Idiosyncratic drug hepatotoxicity. Nat Rev Drug Discovery. 2005;4:489–499. doi: 10.1038/nrd1750. [DOI] [PubMed] [Google Scholar]
- 93.Bessems JG, Vermeulen NP. Paracetamol (acetaminophen)-induced toxicity: molecular and biochemical mechanisms, analogues and protective approaches. Crit Rev Toxicol. 2001;31:55–138. doi: 10.1080/20014091111677. [DOI] [PubMed] [Google Scholar]
- 94.Dang NL, Hughes TB, Krishnamurthy V, Swamidass SJ. A simple model predicts UGT-mediated metabolism. Bioinformatics. 2016;32:3183–3189. doi: 10.1093/bioinformatics/btw350. [DOI] [PMC free article] [PubMed] [Google Scholar]
- 95.Zaretzki J, Matlock M, Swamidass SJ. XenoSite: Accurately predicting CYP-mediated sites of metabolism with neural networks. J Chem Inf Model. 2013;53:3373–3383. doi: 10.1021/ci400518g. [DOI] [PubMed] [Google Scholar]
- 96.Zaretzki J, Browning M, Hughes T, Swamidass S. Extending P450 site-of-metabolism models with region-resolution data. Bioinformatics. 2015;31:1966. doi: 10.1093/bioinformatics/btv100. [DOI] [PubMed] [Google Scholar]
- 97.Zaretzki J, Boehm K, Swamidass SJ. Improved Prediction of CYP-Mediated Metabolism with Chemical Fingerprints. J Chem Inf Model. 2015;55:972–982. doi: 10.1021/ci5005652. [DOI] [PubMed] [Google Scholar]
- 98.Churchill FC, Patchen LC, Campbell CC, Schwartz IK, Nguyen-Dinh P, Dickinson CM. Amodiaquine as a prodrug: importance of metabolite (s) in the antimalarial effect of amodiaquine in humans. Life Sci. 1985;36:53–62. doi: 10.1016/0024-3205(85)90285-1. [DOI] [PubMed] [Google Scholar]
- 99.Maggs J, Tingle M, Kitteringham N, Park B. Drug-protein conjugates–XIV: mechanisms of formation of protein-arylating intermediates from amodiaquine, a myelotoxin and hepatotoxin in man. Biochem Pharmacol. 1988;37:303–311. doi: 10.1016/0006-2952(88)90733-2. [DOI] [PubMed] [Google Scholar]
- 100.Christie G, Breckenridge A, Park B. Drug-protein conjugates–XVIII: Detection of antibodies towards the antimalarial amodiaquine and its quinone imine metabolite in man and the rat. Biochem Pharmacol. 1989;38:1451–1458. doi: 10.1016/0006-2952(89)90184-6. [DOI] [PubMed] [Google Scholar]
- 101.Thalhamer B, Buchberger W, Waser M. Identification of thymol phase I metabolites in human urine by headspace sorptive extraction combined with thermal desorption and gas chromatography mass spectrometry. J Pharm Biomed Anal. 2011;56:64–69. doi: 10.1016/j.jpba.2011.04.014. [DOI] [PubMed] [Google Scholar]
- 102.Mahajan MK, Uttamsingh V, Daniels JS, Gan LS, LeDuc BW, Williams DA. In vitro metabolism of oxymetazoline: evidence for bioactivation to a reactive metabolite. Drug Metab Dispos. 2011;39:693–702. doi: 10.1124/dmd.110.036004. [DOI] [PubMed] [Google Scholar]
- 103.Reilly CA, Henion F, Bugni TS, Ethirajan M, Stockmann C, Pramanik KC, Srivastava SK, Yost GS. Reactive intermediates produced from the metabolism of the vanilloid ring of capsaicinoids by P450 enzymes. Chem Res Toxicol. 2013;26:55–66. doi: 10.1021/tx300366k. [DOI] [PMC free article] [PubMed] [Google Scholar]
- 104.Minet EF, Daniela G, Meredith C, Massey ED. A comparative in vitro kinetic study of [14C]-eugenol and [14C]-methyleugenol activation and detoxification in human, mouse, and rat liver and lung fractions. Xenobiotica. 2012;42:429–441. doi: 10.3109/00498254.2011.637582. [DOI] [PubMed] [Google Scholar]
- 105.Calé R, Aragão I, Martins H, Cardoso G, Ferreira LM, Branco PS, Bastos ML, de Pinho PG. Propofol and metabolites monitoring in serum of patients with induced sedation. Toxicol Lett. 2009;189:S113–S114. [Google Scholar]
- 106.Boelsterli UA, Ho HK, Zhou S, Yeow Leow K. Bioactivation and hepatotoxicity of nitroaromatic drugs. Curr Drug Metab. 2006;7:715–727. doi: 10.2174/138920006778520606. [DOI] [PubMed] [Google Scholar]
- 107.Kedderis GL, Miwa GT. The metabolic activation of nitroheterocyclic therapeutic agents. Drug Metab Rev. 1988;19:33–62. doi: 10.3109/03602538809049618. [DOI] [PubMed] [Google Scholar]
- 108.Núñez-Vergara LJ, Sturm J, Olea-Azar C, Navarrete-Encina P, Bollo S, Squella J. Electrochemical, UV-Visible and EPR studies on nitrofurantoin: Nitro radical anion generation and its interaction with glutathione. Free Radical Res. 2000;32:399–409. doi: 10.1080/10715760000300401. [DOI] [PubMed] [Google Scholar]
- 109.Ali B. Pharmacology and toxicity of furazolidone in man and animals: some recent research. Gen Pharmacol. 1989;20:557–563. doi: 10.1016/0306-3623(89)90085-2. [DOI] [PubMed] [Google Scholar]
- 110.Utili R, Boitnott JK, Zimmerman HJ. Dantrolene-associated hepatic injury. Incidence and character. Gastroenterology. 1977;72:610–616. [PubMed] [Google Scholar]
- 111.Lautala P, Ethell BT, Taskinen J, Burchell B. The specificity of glucuronidation of entacapone and tolcapone by recombinant human UDP-glucuronosyltransferases. Drug Metab Dispos. 2000;28:1385–1389. [PubMed] [Google Scholar]
- 112.Fung HB, Doan TL. Tinidazole: a nitroimidazole antiprotozoal agent. Clin Ther. 2005;27:1859–1884. doi: 10.1016/j.clinthera.2005.12.012. [DOI] [PubMed] [Google Scholar]
Associated Data
This section collects any data citations, data availability statements, or supplementary materials included in this article.


