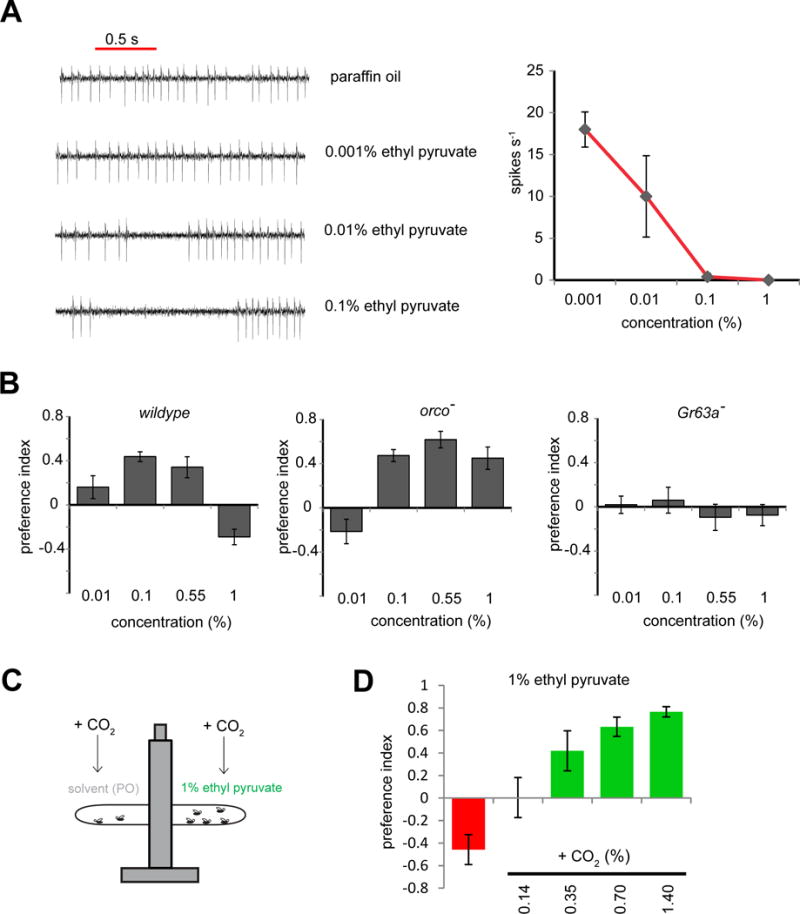
Figure 4. Attractiveness of an inhibitor is modulated by background level of CO2.

(A) Representative traces and mean activity of ab1C during 0.5 s exposures to ethyl pyruvate at indicated concentrations. (n=5 sensilla per concentration) (B) In a T-maze, mean preference of flies of indicated genotypes for indicated concentrations of ethyl pyruvate. (n = 8–10 trials per genotype, 40 flies/trial). (B) Schematic of T-maze assay. Prior to testing, CO2 was injected into both arms of the T-maze to elevate background levels. (D) Preference in a T-maze of wildtype flies for 1 % ethyl pyruvate in the presence of CO2 elevated to indicated concentrations. (n = 4–6 per concentration, 40 flies/trial).
