

Abstract
To assess growing season conditions where ground based observations are limited or unavailable, food security and agricultural drought monitoring analysts rely on publicly available remotely sensed rainfall and vegetation greenness. There are also remotely sensed soil moisture observations from missions like the European Space Agency (ESA) Soil Moisture and Ocean Salinity (SMOS) and NASA’s Soil Moisture Active Passive (SMAP), however these time series are still too short to conduct studies that demonstrate the utility of these data for operational applications, or to provide historical context for extreme wet or dry events.
To promote the use of remotely sensed soil moisture in agricultural drought and food security monitoring, we use East Africa as a case study to evaluate the quality of a 30+ year time series of merged active-passive microwave soil moisture from the ESA Climate Change Initiative (CCI-SM). Compared to the Normalized Difference Vegetation index (NDVI) and modeled soil moisture products, we found substantial spatial and temporal gaps in the early part of the CCI-SM record, with adequate data coverage beginning in 1992. From this point forward, growing season CCI-SM anomalies were well correlated (R>0.5) with modeled, seasonal soil moisture, and in some regions, NDVI. We use correlation analysis and qualitative comparisons at seasonal time scales to show that remotely sensed soil moisture can add information to a convergence of evidence framework that traditionally relies on rainfall and NDVI in moderately vegetated regions.
Keywords: Remotely sensed soil moisture, agricultural drought monitoring, food security, East Africa
1. INTRODUCTION
Agricultural drought, or soil moisture deficit, reduces crop production and can impact a range of sectors – from individual households to global commodity markets. While meteorological and crop conditions are of interest to a broad audience, many places around the world lack in situ monitoring or don’t publicly report these data. In these instances, growing season conditions can be tracked using publicly available satellite data – most often rainfall and the normalized difference vegetation index (NDVI). Modeled and remotely sensed soil moisture can also provide information, bridging the gap between rainfall deficits and vegetation response.
Humanitarian organizations that provide emergency assistance before food crises arise rely almost entirely on remotely sensed rainfall and NDVI in a ‘convergence of evidence’ framework (Verdin et al., 2005). This approach uses multiple sources to mitigate errors in any single product. Despite the potential benefits, inclusion of remotely sensed and modeled soil moisture into humanitarian operations has been slow due to a lack of near-real time data as well as lack of demonstrated utility. The Soil Moisture Active Passive (SMAP) mission, launched in January 2015, is expected to provide products that are both accurate (0.04 mm/mm error) and timely (estimates produced every 10 days) enough for agricultural monitoring (Entekhabi et al., 2010). There is still a need, however to demonstrate the utility of remotely sensed soil moisture for crop monitoring applications. This is particularly challenging in regions with insufficient in situ measurements (both rainfall and soil moisture) for calibration of absolute values from remotely sensed data and models. To cope with the resulting uncertainty, analysts can use derived moisture indices that have been standardized over time (e.g. the Standardized Precipitation Index (SPI) McKee 1993), or percentile ranks (e.g. soil moisture percentiles (Svoboda et al. 2002; Shefield and Wood 2008). A data record of at least 30 years is recommended for computing probability distributions that underpin standardized metrics. In the case of microwave soil moisture, different satellite sensors need to be merged to make a sufficiently long time record. This has motivated the European Space Agency’s (ESA) Climate Change Initiative (CCI) to merge active and passive microwave sensors to produce a harmonized satellite derived soil moisture dataset covering 30+ years, from 1978-2013 (Liu et al., 2012; Liu et al., 2011; Wagner et al., 2012).
As with all merged multi-sensor products, users of CCI soil moisture (CCI-SM) must be aware of potential shifts in data that occur as sensors change over time. Dorigo et al. (2014) evaluated CCI-SM using a global dataset of ground based stations. On average, CCI-SM was moderately correlated (Rabsolute values=0.46, Ranomalies=0.36) with stations and had an upward trend in quality over time with the exception of 2007-2010. Jia et al. (2015) found similar results using in situ observations from China. Also in China, Yuan et al. (2015) assessed the capability of CCI-SM to detect drought events in the in situ data and modeled soil moisture record. They found that while CCI-SM matched in situ observations for <60% of the dry events, it did capture inter-annual variability commensurate with the reanalysis, especially in sparsely vegetated regions. In a study over the Tibetan Plateau, Zeng et al. (2015) found the CCI-SM was better correlated with in situ data and reanalysis than individual sensor products.
While the quality of CCI-SM has not been evaluated for regions in Africa specifically, Dorigo et al. (2014)’s global analysis mapped the spatio-temporal coverage, and included four sites in West Africa from the AMMA network (Cappelaere et al., 2009). At these sites CCI-SM was well correlated (R ~0.7) with absolute values but less so (R~0.45) when the seasonal cycle was removed. McNally et al. (2015) found statistically significant (R>0.5) correlations between CCI-SM and modeled soil moisture anomalies in West Africa and Traore et al. (2014) found good (R>0.5) correlations in Southern and Western Africa, but less so (R<0.3) in East Africa. Shukla et al. (2014) also included CCI-SM in qualitative comparison of showing how rainfall and modeled soil moisture z-scores represented an extreme drought in East Africa.
The current paper extends the work of Dorigo et al. (2014) and aims to explicitly evaluate CCI-SM in East Africa to facilitate the appropriate use of remotely sensed soil moisture in agricultural drought monitoring and food security assessment. Guided by our association with the Famine Early Warning Systems Network (FEWS NET), we focus our analysis on rain-fed agricultural regions (Figure 1a and 1b). Details about the models, their inputs, CCI-SM and NDVI and our approach to analysis are in Section 2. The first part of Section 3 evaluates the spatial and temporal coverage, and the second part compares CCI-SM with modeled soil moisture and NDVI to demonstrate where and under what conditions remotely sensed microwave soil moisture, from missions like SMOS and SMAP, can benefit agricultural drought and food security monitoring. Section 4 summarizes our contributions and discusses future research directions regarding how CCI-SM, and other remotely sensed soil moisture estimates, can contribute to agricultural and food security assessment over regions where analysts typically rely on NDVI and rainfall data.
Figure 1. Landcover and Elevation.

(a) East Africa dominant landcover types from IGBP-MODIS and (b) elevation from SRTM30 v2.1 (http://dds.cr.usgs.gov/srtm/version2_1/SRTM30/).
2. METHODS
East Africa is characterized by grassland and woody or shrub savanna vegetation (Figure 1a). The topography ranges from flat to complex terrain (Figure 1b) and soils range from clay to sand mixes (Nachtergaele et al., 2008). The region has a multi-modal rainfall regime that is initiated by the northward migration of the Intertropical Convergence Zone (ITCZ) in the summer months (Davenport and Nicholson, 1993). Another characteristic of this region is the lack of ground-based observations for calibration and validation of remotely sensed rainfall and soil moisture.
Our analysis compares two land surface models (LSMs) and two remotely sensed observational datasets (Table 1). The different components in Table 1 are described below.
Table 1.
Summary of Data and Models
| NASA LIS Land surface models (Kumar et al 2008) | Models & parameters | Noah33 (Chen et al. 1996; Wei et al. 2013) modeled soil moisture (layer 1) | Landcover: IGBP classification with MODIS |
| Vegetation parameters: RAL | |||
| Vegetation phenology: monthly climatology of green vegetation fraction (Gutman and Ignatov 1998) | |||
| Soils: FAO Reynolds et al. (2000) | |||
| VIC 4.1.2 (Liang et al., 1994; Liang et al., 1996) modeled soil moisture (layer 1) Parameters originally from Sheffield et al. (2014) and Chaney et al. (2014) |
Landcover: UMD classification with AVHRR | ||
| Soils texture, bulk density (Batjes, 1997), other parameters (Cosby et al., 1984) | |||
| Vegetation phenology: monthly climatology leaf area index (LAI) (Myneni et al. 1997) | |||
| Vegetation parameters: (Nijssen et al. 2001) | |||
| Model inputs | CHIRPS rainfall (Funk et al. 2014) | Daily rainfall disaggregated to 6- hourly model inputs. | |
| MERRA meteorologic al inputs (Reichle et al. 2011) | Temperature, humidity, downward shortwave and longwave radiation, wind (zonal and meridional), and surface pressure | ||
| Observations | Remotely sensed data | Vegetation Greenness | GIMMS NDVI 16 day NDVI composites (Pinzon et al., 2005; Pinzon and Tucker 2014; Tucker et al., 2005). |
| Soil moisture | ESA CCI Soil moisture Daily (Liu et al., 2012; Liu et al., 2011; Wagner et al., 2012) |
2.1 LAND SURFACE MODELING FRAMEWORK
To estimate soil moisture from rainfall and other meteorological inputs, we use two models that are part of the NASA Land Information System (LIS) (Kumar et al., 2008). The LIS software is a framework that facilitates the use of multiple land models, parameter (e.g. vegetation) datasets, and meteorological inputs to generate ensemble estimates of energy and water states and fluxes. More information on the current capabilities of the NASA LIS can be found on the website (http://lis.gsfc.nasa.gov/). Eventually this system will provide multi-model and multi-forcing ensemble outputs for routine FEWS NET decision support.
Although not a perfect model inter-comparison due to differences in model parameters, including two land surface models allows us to capture some of the uncertainty introduced by different model physics. The land surface models and associated data inputs that we used for this study are described in Table 1 and the following section.
2.1.1 NOAH 3.3
The Noah LSM is a water and energy balance land surface model described in Chen et al. (1996), and model updates described in Wei et al. (2013). For this study we used version 3.3 at 0.1° spatial resolution. To compute energy and water balance, Noah requires input meteorological variables, vegetation (land cover) type, and soil texture (Table 1). We chose to use the Noah model for FEWS NET applications because it is widely used by the atmospheric and land modeling communities and therefore model parameters are publicly available and well tested. Noah also has features that may be useful in the future, like data assimilation algorithms, irrigation modules and coupling to the Weather Research and Forecasting Model (WRF). There are several examples of Noah being used over East Africa (e.g. Anderson et al., 2012b, a; Yilmaz et al., 2014), coupled with the WRF in Kenya (Case et al., 2014) and in a multi-model drought monitor (Mo et al., 2012).
2.1.2 VIC
The Variable Infiltration Capacity (VIC) model is a semi-distributed macroscale hydrologic model (Liang et al., 1994; Liang et al., 1996) that has been widely used at a global scale and has been demonstrated to accurately capture the hydrology of different regimes (Adam et al., 2006; Maurer et al., 2002; Nijssen et al., 1997; Nijssen et al., 2001). It is the main model used by the Princeton Africa Drought Monitor (Sheffield et al., 2014) and is a prototype for FEWS NET seasonal hydrologic forecasting (Shukla et al., 2014). The NASA LIS instance of the VIC model is version 4.1.2, which we ran at 0.25° resolution. When run at a sub-daily time step in energy balance mode VIC requires the same suite of meteorological inputs as the Noah model. We chose the VIC model for FEWS NET applications because it is widely used by the hydrologic forecasting community in both the U.S. and Africa (Mo et al., 2012; Nijssen et al., 2014; Sheffield et al., 2014).
The soil and vegetation parameters used for this study were originally developed for Princeton’s Africa Flood and Drought Monitor (http://hydrology.princeton.edu/~nchaney/ADMML/), documented in Sheffield et al. (2014) and Chaney et al. (2014), and described in more detail below and listed in Table 1.
2.1.3 VEGETATION
The LIS configurations of Noah and VIC LSMs (see Table 1) use two different static, global, 1-km resolution datasets of land cover classes. VIC uses the University of Maryland (UMD) classification for the Advanced Very High Resolution Radiometer (AVHRR) observations. Noah uses the Boston University-IGBP classification based on NASA’s Terra Moderate Resolution Imaging Spectroradiometer (MODIS) observations. Both models use different representations of satellite derived average monthly vegetation phenology: VIC uses 1-km resolution leaf area index (LAI) (Myneni et al., 1997), while Noah uses ~14km (0.144°) resolution green vegetation fraction (GVF) climatologies from the National Center for Environmental Prediction (NCEP) (Gutman and Ignatov, 1998).
VIC’s additional vegetation type parameters like specific root length, minimum stomatal resistance, architectural resistance, roughness length, and displacement length taken from Nijssen et al. (2001). Noah’s vegetation parameters are based on a lookup table available from the National Center for Atmospheric Research (NCAR) Research Applications Laboratory (RAL) website (http://www.ral.ucar.edu/research/land/technology/lsm.php)
2.1.4 SOILS
For this study, the soil type maps used in LIS-Noah 3.3 were derived from 0.083°(5 min) resolution global soils dataset of Reynolds et al. (2000), and available from NCAR RAL website mentioned above. LIS-Noah includes a routine to classify soil texture based on percentages of sand, silt and clay in a given grid cell and are associated with various soil parameters found in a lookup table available from the NCAR RAL website. For VIC, soil texture and bulk density were from Batjes (1997), other soil parameters from Cosby et al. (1984) were calibrated, following the method of Troy et al. (2008), against runoff fields derived by Global Runoff Data Center (GRDC) gauges in Africa, described in Shukla et al. (2014).
2.1.5 PRECIPTIATION AND METEROLOGICAL INPUTS
There are a variety of options for long-term rainfall datasets. Maidment (2014) provides a comprehensive summary of rainfall datasets that extend for over 30 years. This study uses the Climate Hazards Group InfraRed Precipitation with Station data, CHIRPS v2.0, a quasi-global rainfall dataset available from 1981 to present, designed for seasonal drought monitoring and trend analysis (Funk et al., 2014). This data set was developed and is updated at near-real time by the United States Geological Survey (USGS) in collaboration with the Climate Hazards Group of the Department of Geography at the University of California, Santa Barbara. CHIRPS is generated by blending together three different data sets: (1) global 0.05° precipitation climatology, (2) time varying grids of satellite-based and climate model precipitation estimates, and (3) in situ precipitation observations. This data set has been compared to other global precipitation data sets such as the Global Precipitation Climatology Project (Huffman et al., 2009), which is in agreement over our area of interest (Figure 1) (Peterson et al., 2014). For these model experiments we spatially aggregated CHIRPS using nearest-neighbor interpolation, to 0.1° and 0.25° resolution for Noah and VIC, respectively. And, because energy balance calculations require atmospheric inputs at sub-daily model time steps, these data were temporally disaggregated from daily to 6-hrly (4 observations per day) using NCEP’s Climate Forecast System Reanalysis (CFSR; http://rda.ucar.edu/datasets/ds093.1/).
In addition to precipitation, Noah and VIC use temperature, humidity, downward shortwave and longwave radiation, wind (zonal and meridional), and surface pressure. For these variables, we used hourly averages from the Modern Era Retrospective Analysis for Research and Applications (MERRA) dataset (Reichle et al., 2011). MERRA is available at a horizontal resolution of 2/3° longitude by 1/2° latitude and from 1 January 1980 onwards. The LIS software applies a bilinear spatial interpolation algorithm to convert the forcing data to match the 0.1° or 0.25° resolution required by the Noah and VIC models, respectively.
2.2 REMOTELY SENSED SOIL MOISUTURE AND VEGETATION
2.2.1 ESA CCI Microwave Soil Moisture
The ESA’s CCI monitors a suite of Essential Climate Variables (ECV), one of which is soil moisture. The CCI-SM is available from 1979-2013 at 0.25° spatial resolution and daily temporal resolution, which we aggregated to monthly and seasonal time-steps (9- and 3- month).
The CCI goal is to produce a complete and consistent global soil moisture data record based on passive (radiometer) products (SMMR, SSM/I, TMI, AMSR-E, AMSR2, Windsat) and active (radar/scatterometer) products (ERS-1/2, METOP-A 1991-2013). Passive radiometers are insensitive to weather and moderate vegetation cover and can accurately distinguish between wet (cold) and dry (warm) soils. The downsides are that, for agricultural monitoring, the spatial resolution is course (30-50 KM) and none of the sensors currently included in CCI-SM use the optimal L-band for soil moisture retrievals. In contrast, active radars have a finer spatial resolution (3-25 KM) but lower soil moisture sensitivity.
The complementary strengths of the passive and active products have led to development of merging algorithms. For CCI-SM, the microwave retrieved surface soil moisture data is merged from the different sensors (Dorigo et al., 2011; Liu et al., 2012; Liu et al., 2011) and the absolute soil moisture value is scaled to the 25km GLDAS-1 Noah soil moisture. The CCI-SM Algorithm Theoretical Baseline Document (2013) states that in the scaling procedure the “temporal variability and trends of the original datasets are generally well preserved.” Data quality flags are provided, and were used to mask pixels with dense vegetation, no data collected, lack of merging algorithm convergence and frozen or snow covered soils. Overall, the merged active and passive products have been shown to be superior to either the passive or active alone (Liu et al., 2011).
2.2.2 GIMMS NDVI
NDVI is regularly used by food security analysts at FEWS NET (Verdin et al., 2005) for convergence of evidence with precipitation statistics. Comparisons between NDVI, rainfall and soil moisture allow us to evaluate the added value of soil moisture products, like CCI-SM, and its potential use in applications like FEWS NET.
We use the Global Inventory Modeling and Mapping Studies (GIMMS) NDVI product, which is derived from imagery obtained from AVHRR instrument and is available from 1982 to 2013 (Pinzon et al., 2005; Pinzon and Tucker 2014; Tucker et al., 2005). AVHRR NDVI has been used extensively over different regions of Africa. Nicholson et al. (1990) compared relationships between NDVI and rainfall over the Sahel and East Africa. The relationship was linear over the Sahel but log-linear in East Africa where vegetation canopy densities are higher.
While the GIMMS NDVI (1982-2013) and CCI-SM’s period of record (1978-2013) limits their utility for drought monitoring, these datasets do provide us a sufficiently long record to evaluate the potential contributions of similar near-real time products from models or satellite sensors with shorter records.
2.3 ANALYSIS APPROACH
Dorigo et al. (2014) explored the spatio-temporal data availability for the entire 1979-2010 period of record as well as the different periods of sensor-blending at the global scale. They show an increase in observation density over time that results from more satellites and daily overpasses as well as improvements to instrument design. We conducted a similar analysis with the CCI-SM dataset using the most recent update that spans 1979-2013.
Different from other analyses, we focused on crop growing regions of East Africa where CCI-SM may be useful for food security and drought monitoring applications. We used a generalized cropping zone mask which is based on (1) the United Nations Food and Agriculture Organization (FAO) Africover (http://www.glcn.org/activities/africover_en.jsp) landuse-landcover maps of herbaceous crop zones and (2) FEWS NET livelihood zone, and commodity and trade maps for major staples (e.g. maize) (Gideon Galu, personal communication, July 2015). This mask is also used in the crop water balance model geoWRSI (Senay and Verdin, 2002; Verdin and Klaver, 2002). Data were additionally masked to the available NDVI domain and Noah landmask (derived from MODIS) to eliminate water bodies.
Next we computed z-scores for CCI-SM, the upper layers of VIC and Noah (both 0-10 cm top layer depth), GIMMS NDVI, and CHIRPS rainfall, averaged over both space and time for March-September. We compared the different datasets at this scale to determine when CCI-SM data quality was sufficient for further analysis. We then computed and mapped pairwise rank correlations of monthly (not shown) and 3-monthly (January-February-March, April-May-June, July-August-September, October-November-December) (not shown), and seasonal (March-September) z-scores from 1992-2013.
After assessing the general patterns of agreement between the different products, we use correlation and qualitative comparisons to explore the performance of the different products at specific locations that correspond to low, medium and high correlations and low, medium and high vegetation density. Finally, to evaluate performance during extreme growing season conditions we qualitatively compare maps of 3-monthly z-scores for a wet (2007) and dry (2009) year.
3. RESULTS
Similar to Dorigo et al. (2014)’s analysis of spatial coverage (1979-2010), Figure 2 shows the temporal variability of the CCI-SM’s spatial coverage in East Africa (1979-2013). We determined the fraction of spatial coverage by calculating the ratio between the number of grid cells reporting a valid value on a given day and the number of grid cells that reported valid value on the day of the maximum coverage during the entire period. The spatial coverage is <0.4 from 1979-1992, increases to >0.5 beginning in 1998, and reaches maximum levels in 2007 (>0.8), where it remains, with the exception of a brief time period around 2012.
Figure 2. CCI-SM Daily SM observation coverage over East Africa (1979-2013).

The fractional coverage is defined as the ratio of total number of grid cells reporting valid soil moisture value during a given day and the maximum number of grid cells reporting valid soil moisture values during the entire period.
Next, we mapped the temporal coverage of CCI-SM dataset for our domain during the main East Africa rainy seasons, March-April-May (MAM), July-August-September (JAS), and October-November-December (OND) (Figure 3). These maps generally correspond to the time series in Figure 2. Temporal coverage (estimated as the ratio of the number of days when a valid value was reported for a given grid cell and total number of days during a season in a decade) is the lowest during 1979-1990s (<0.3), improves to 0.5 in period 1991-2000, and improves further during the recent decades. We find slightly higher coverage rates over Kenya than what appear in the global maps of Dorigo et al. (2014).
Figure 3. CCI-SM temporal coverage over East Africa (1979-2013).

Fraction of time that soil moisture observations were reported during different seasons over East Africa. The data coverage improved post 2001.
While informative, it is unclear whether the fraction of data coverage impacts optimal data usability, i.e. balancing length of record with quality of data. We evaluate this by comparing average March-September z-scores of CCI-SM with CHIRPS rainfall, GIMMS NDVI and VIC and Noah modeled soil moisture. We found unrealistically low CCI-SM values 1986 through 1991 (Figure 4a). When we remove data before 1992 the magnitude of the CCI-SM anomalies is more consistent with the other products (Figure 4b). Pairwise correlations are listed in Table 2 for both 1992-2013 and 1982-2013 (in parentheses). CCI-SM is better correlated with seasonally average modeled soil moisture than rainfall or NDVI, and all correlations improved with the shorter time series (1992-present). For the remainder of the analysis we use the 1992-2013 time series.
Figure 4. East Africa domain averaged z-scores.

CHIRPS rainfall, Noah and VIC modeled soil moisture, NDVI and CCI-SM soil moisture z-scores over cropping region of East Africa for (A) 1981-2013 and (B) z-scores recomputed for 1992-2013. Associated pairwise correlations shown in Table 2.
Table 2.
Spearman rank correlations associated with Figure 3. The first entry is for 1992-2013; values in parenthesis are for 1982-2013. All relationships with CCI-SM improve with the shorter time series.
| 1992 1982 |
CCI-SM | CHIRPSv2 6-hrly |
NOAH | VIC | NDVI |
|---|---|---|---|---|---|
| CCI-SM | 1 |
0.56 (0.39) |
0.68 (0.59) |
0.70 (0.56) |
0.58 (0.45) |
|
CHIRPSv2 6-hrly |
1 | 0.88 (0.84) |
0.80 (0.79) |
0.44 (0.44) |
|
| NOAH | 1 | 0.90 (0.90) |
0.40 (0.39) |
||
| VIC | 1 | 0.47 (0.41) |
|||
| NDVI | 1 |
To explore spatial patterns in the relationship between seasonally averaged data, we compute pixel-wise CCI-SM correlations with Noah (Figure 5a), VIC (Figure 5b) and NDVI (Figure 5c) over East Africa cropping zones. Within this domain, CCI-SM is best correlated with modeled soil moisture and NDVI in Kenya, and the southern and eastern extent of cropping zone in Ethiopia: Noah (R~0.6-0.8), VIC (R~0.4-0.8) and NDVI (R~0.6) Correlations are lower in Western Ethiopia, Sudan, South Sudan and Uganda (R~0-0.4). We also calculate the correlations for Noah and VIC soil moisture with NDVI (Figure 5d,e), which show similarly high correlations in the same Kenya and southern Ethiopia regions, with no significant relationship over Sudan and South Sudan. Both LSMs displayed the same spatial pattern with VIC’s correlation being slightly lower.
Figure 5. Seasonal correlations between CCI-SM, models and NDVI.

Pairwise Spearman rank correlation of seasonal (March-September average) CCI-SM and a) Noah b) VIC c) NDVI as well as d) NDVI-Noah e) NDVI - VIC. CCI-SM tends to show better agreement with modeled soil moisture than NDVI.
To examine whether and how the greenness fraction influences the agreement between these datasets we looked at individual time series at three locations, shown in Figure 6a and b, Mpala Kenya (37°E, 0.3°N), Tigray, Ethiopia (39°E, 14°N) and Illubabor, Ethiopia (8.8°N, 35.46° E).
Figure 6. Sites for detailed time series analysis.

(A) Average of pairwise correlation of CCI-SM, Noah and NDVI. (B) NCEP green vegetation fraction. Locations of time series analysis in pink.
Mpala, Kenya is moderately vegetated (GVF=38% vegetation cover) and here, CCI-SM is well correlated with both modeled soil moisture and NDVI (R>0.75). The 1992-2013 timeseries of seasonal averages from this location (Figure 7a) shows a consistent signal among the products. We note that NDVI at Mpala (Figure 7a) does not show a strong response to the wet event in 2007, which we will discuss later, but does show positive anomalies comparable to CCI-SM and modeled soil moisture in 1998 and 2010. We also plotted the climatological monthly mean values for each variable (Figure 7b), which showed that the CCI-SM and Noah soil moisture estimates were in-phase and NDVI was lagged by one month. With its earlier peak, VIC appears to respond more quickly to the start of the March-April-May rainy season than Noah or CCI-SM.
Figure 7. Mpala, Kenya (0.3°N, 37° E) with moderate-low vegetation (GVF=0.38).

(A) Seasonal (March-Sept) average at the site 1992-2013. (B) Climatological monthly mean for each variable.
The Tigray Region of Northern Ethiopia is the sparsely vegetated (GVF=15%) and here, CCI-SM is not significantly correlated with modeled soil moisture or NDVI for the 1992-2013 period (Figure 8a). The climatological monthly mean values for each variable indicate that the soil moisture estimates do not agree on the seasonal cycle and the average NDVI lags between one and two months (Figure 8b). CCI-SM agrees with modeled soil moisture 2004-2011 (Figure 8a) suggesting that low microwave satellite coverage over this region (Figure 3) may contribute to errors 1992-2003.
Figure 8. Tigray region, Ethiopia (14°N, 39°E) with sparse vegetation (GVF=0.15).

(A) Seasonal (March-Sept) average. Modeled and CCI-SM estimates are not significantly correlated (R<0.25), and no significant relationship with NDVI (B) Climatological monthly mean for each variable.
Illubabor, Ethiopia (35.47°E, 9.5°N) has moderate to high-density vegetation (GVF=63%). Beyond this level of vegetation density CCI-SM has been flagged and masked for dense vegetation. Here, CCI-SM is correlated with Noah (R=0.67) and VIC (R=0.6), with notable disagreement in 2001 and 2002. Meanwhile NDVI does not show a relationship with either model SM or CCI-SM estimates (Figure 9a). The climatological monthly mean values indicate that CCI-SM and NDVI are in phase January through May, both lagging the models by a month (Figure 9b).
Figure 9. Illubabor, Ethiopia (8.8°N, 35.46° E) with moderately dense vegetation (GVF=0.63).

Seasonal (March-September) average, models and microwave agree (R=0.63). Neither MW nor models have significant relationships with average seasonal NDVI. (B) Climatological monthly mean for each variable.
Correlations give us an indication of how time series capture a range of conditions. For drought monitoring and food security applications, however, it is important to evaluate how products represent extremes. We compare CCI-SM to Noah-SM and NDVI in extreme wet (2007) and dry (2009) conditions by mapping 3-month z-scores for each product (Figures 10 and 11).
Figure 10. Z-scores for extreme wet conditions in 2007.

Seasonal z-scores for CCI-SM and Noah SM show similar spatial patterns and temporal evolution of extremely wet conditions in 2007. GIMMS NDVI shows a similar temporal evolution of wet conditions in JAS and average conditions in OND, but z-scores are less extreme.
Figure 11. Z-scores for extreme dry conditions in 2009.
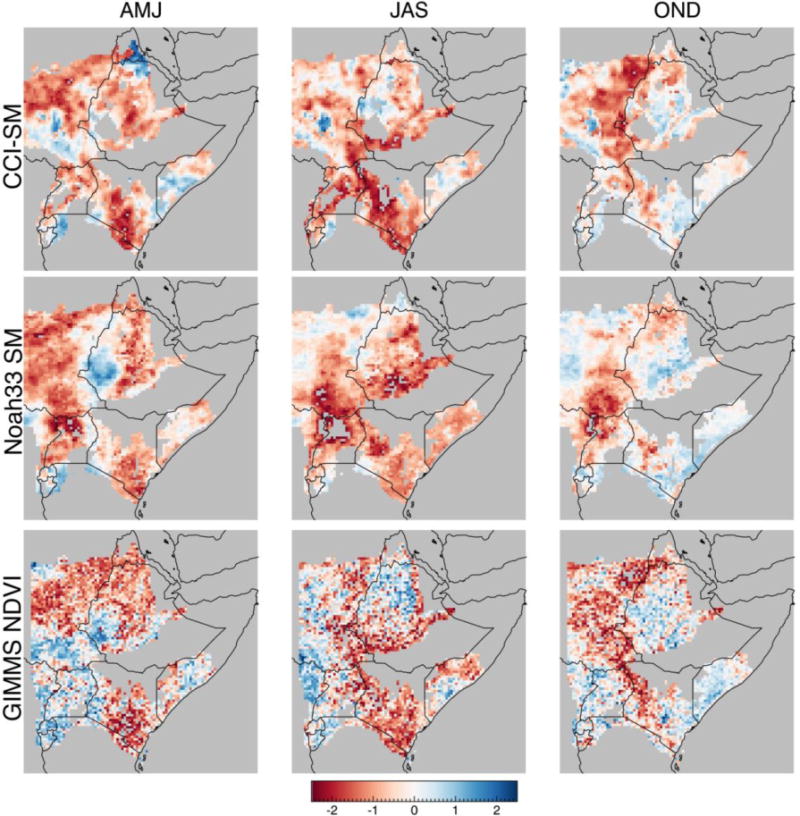
Seasonal z-scores for CCI-SM, Noah SM and GIMMS NDVI show similar spatial patterns and temporal evolution of extremely dry conditions in 2009.
In 2007 all products were 1 to ~2 standard deviations above average (Figure 4b). The EM-Disaster Database (Guha-Sapir et al., 2015) indicates severe flooding in Ethiopia during July 2007. The World Food Program also reports above average rainfall in Northwest Kenya, including the Laikipia District where Mpala is located (http://documents.wfp.org/stellent/groups/public/documents/ena/wfp150278.pdf). In general, CCI-SM and Noah agree that April-May-June (AMJ) and July-August-September (JAS) were wetter than average. NDVI agrees with CCI-SM and Noah during JAS, especially in Kenya and the southern extent of the domain in Ethiopia (Figure 10). The October-November-December (OND) conditions for all products show conditions returning to nearly normal or dry.
In 2009, all products were between 1.5 and 2 standard deviations below average (Figure 4b). The disaster database confirms severe drought in Kenya and the FAO Statistics Division (FAO STAT: http://faostat.fao.org/) confirms significant yield losses. The spatial patterns (Figure 11) during AMJ and JAS by CCI-SM, Noah and NDVI are nearly identical - with strong deficits in central Kenya, central Sudan and north-central Ethiopia. All products indicate moisture increases in OND, however spatial patterns diverge, e.g. NDVI and CCI-SM deficits remain strong in eastern Sudan, while Noah shows near normal conditions.
4. DISCUSSION
The European Space Agency’s CCI-SM is a long term gridded soil moisture dataset which has potential to be very valuable for long-term agricultural drought and hydrologic extreme analysis, especially in places like East Africa that suffer from a lack of in situ rainfall and soil moisture observations. In this study we comprehensively evaluated this dataset over East Africa, specifically for the purposes of agricultural drought analysis. Results in Figures 2 and 3 demonstrate the variability of the spatial and temporal coverage of this dataset in our focus domain and Figure 4a and b showed how CCI-SM compares to other independent datasets (i.e. CHIRPS rainfall, GIMMS NDVI and modeled soil moisture) that are currently being used by the FEWS NET for agricultural drought analysis and monitoring in this region.
Maps of our correlation analysis (Figure 5) show where CCI-SM, modeled soil moisture and NDVI are all reliable sources of growing season conditions in e.g. Kenya and where CCI-SM can corroborate soil moisture estimates from the VIC and Noah models, but analysts should be wary of a non-linear relationship between soil moisture estimates and NDVI in moderate to highly vegetated locations e.g. Illubabor, Ethiopia (Figure 9a). We also highlight where CCI-SM, NDVI and even models driven with the same rainfall and meteorological inputs disagree e.g. Tigray, Ethiopia. This site appears to be the convergence of multiple sources of uncertainty – differences in model physics and parameters result in low correlations between the Noah and VIC models, CCI-SM climatological monthly mean appears to be shifted a month earlier than Noah and two months earlier than NDVI (Figure 9b). Targeted investigation on sources of model or observational uncertainty is needed here and in other regions, like central Sudan and South Sudan, where our maps indicate no agreement between the different estimates (Figure 5). Despite differences when considering the 1992-2013 record, Figures 10 and 11 show that there is very high and wide spread correspondence between CCI-SM and modeled soil moisture in wet and dry extreme years (2007 (2009). This contrasts with NDVI, which corresponds to CCI-SM and Noah better during the dry year (Figure 11).
While CCI-SM and potentially other microwave products, like SMAP and SMOS, show great potential for FEWS NET applications in East Africa there are some caveats to address. First, due to the relatively low spatial and temporal data coverage (and poor data quality during 1986 to 1992), we limited our period of analysis to 1992-2013. The data quality and coverage even during this time period was not always consistent. There were many more records available over the Sudan and Western Ethiopia than Somalia and southeast Ethiopia and during post-2001 than the previous periods. Future studies targeting smaller regions within East Africa might have to adopt different analysis periods (e.g. Tigray). This is also true for extensions of this work that will evaluate CCI-SM over other FEWS NET regions of interest like western, northern, and southern Africa and the Middle East.
Second, in this analysis, we limit the comparison of CCI-SM dataset to only NDVI and modeled soil moisture datasets. For the purpose of drought impact analysis, however, we need to examine the correspondence between various datasets with metrics such as crop yield losses (available from FAO and national agricultural agencies), numbers of people affected and economic damages (from the EM-Dat International Disaster Database). This is a daunting task, given that the influence of non-agro-climatic factors (e.g., livelihood and market accessibility) on those metrics and the general lack of high quality, long-term, sub-national data on crop area and production.
Finally, demonstrating the relevance of remotely sensed and modeled for drought impact assessment is challenging but worthwhile task. Evaluation of remotely sensed and modeled data sets is essential to continue to make improvements for food security decision support. A challenge is finding a suite of metrics that capture the value, uncertainty, and information content of the observations while factoring in both science and societal impacts. Kumar et al. (2014) describe decision-theory based metrics that address weaknesses of conventional metrics like root mean squared error (RMSE) and anomaly correlation that may not be suited for capturing impact to hydrological applications. Ideally, these types of metrics could be used to make ‘expert opinion’ more transparent – e.g. what metric would show that NDVI is a good indicator of very dry conditions, as we showed in our 2009 example? One would first need to construct an independent baseline of droughts to quantify the value of NDVI. Other studies, like Jia et al. (2015); Yuan et al. (2015) used modeled and in situ data sets for this baseline, but what would one use to simultaneously evaluate models and NDVI when in situ data is not available?
5. CONCLUSIONS
Agricultural drought monitoring in data sparse regions is a challenge leaving much room for improvement but continues to reap benefits from advancements in remote sensing and modeling technologies. Synthesizing soil moisture predictions from different sources of evidence (rainfall driven land surface models, remote sensing and NDVI) represents a best guess as to how growing season conditions are progressing and can be used to provide early warning for natural hazards like droughts and floods, which are linked to food insecurity.
Here we show that the new ESA CCI-SM soil moisture product adds information to historical drought analysis.
Our primary findings are:
Spatial and temporal coverage of this dataset is generally poor in East Africa prior to 1992 but improves with time.
Post 1992 the correlation of CCI-SM dataset with other datasets improves, and its correlation, with NOAH and VIC soil moisture, is statistically significant (R>0.68).
Grid-cell scale comparison of CCI-SM with VIC, NOAH and NDVI indicated that CCI-SM generally has a higher level of agreement (R>0.5) over Kenya and central Ethiopia; whereas agreement over western Ethiopia and neighboring regions of Sudan and South Sudan is limited.
Correlation maps and specific case studies show that analysts can be confident about the indication of growing season anomalies in much of Kenya and the southern cropping extent of Ethiopia. In central Ethiopia CCI-SM can corroborate modeled soil moisture better than NDVI, and in northern and western Ethiopia analysts should be wary of all data products and consult field informants.
The CCI-SM and modeled soil moisture show remarkably similar anomalies during extreme wet and dry years.
These efforts are important as preparation for SMAP, SMOS and future soil moisture missions. The improved accuracy of future products should improve our overall confidence in a convergence of evidence framework and further extend this time series for better percentile-based estimates of drought. Despite the fact that CCI-SM data are not available at near real-time, these data provide important baseline, historical information, hydrologic model verification and allow food security analysts to become more familiar with the strengths and limitations of microwave soil moisture retrievals.
Acknowledgments
We acknowledge the Global Modeling and Assimilation Office (GMAO) and the GES DISC for the dissemination of MERRA. This work was supported USGS Cooperative Agreement G09AC000001 “Monitoring and Forecasting Climate, Water and Land Use for Food Production in the Developing World,” with funding from the NASA Applied Sciences Program, Award NN10AN26I for “A Land Data Assimilation System for Famine Early Warning”, and a USAID-NASA Participating Agency Program Agreement. Dr. Shukla was supported by the United States Geological Survey (USGS) award number G14AC00042. We also thank two anonymous reviewers for comments, and Gideaon Galu and Tamuka Magadzire for information on FEWS NET crop masks.
References
- Adam J, Clark E, Lettenmaier D, Wood E. Correction of Global Precipitation Products for Orographic Effects. Journal of Climate. 2006;19:15–38. [Google Scholar]
- Anderson W, Zaitchik B, Hain C, Anderson M, Yilmaz M, Mecikalski J, Schultz L. Towards an integrated soil moisture drought monitor for East Africa. Hydrology and Earth System Sciences. 2012a;16:2893–2913. [Google Scholar]
- Anderson W, Zaitchik B, Hain C, Anderson M, Yilmaz M, Mecikalski J, Schultz L. Towards an integrated soil moisture drought monitor for East Africa. Hydrology & Earth System Sciences Discussions. 2012b;9 [Google Scholar]
- Batjes N. A world dataset of derived soil properties by FAO–UNESCO soil unit for global modelling. Soil Use and Management. 1997;13:9–16. [Google Scholar]
- Cappelaere B, Descroix L, Lebel T, Boulain N, Ramier D, Laurent JP, Favreau G, Boubkraoui S, Boucher M, Bouzou Moussa I. The AMMA-CATCH experiment in the cultivated Sahelian area of south-west Niger-Investigating water cycle response to a fluctuating climate and changing environment. Journal of Hydrology. 2009;375:34–51. [Google Scholar]
- Case JL, Mungai J, Sakwa V, Kabuchanga E, Zavodsky BT, Limaye AS. Toward Improved Land Surface Initialization in Support of Regional WRF Forecasts at the Kenya Meteorological Service (KMS) 2014 [Google Scholar]
- Chaney NW, Sheffield J, Villarini G, Wood EF. Development of a High-Resolution Gridded Daily Meteorological Dataset over Sub-Saharan Africa: Spatial Analysis of Trends in Climate Extremes. Journal of Climate. 2014;27:5815–5835. [Google Scholar]
- Chen F, Mitchell K, Schaake J, Xue Y, Pan H, Koren V, Duan Q, Ek M, Betts A. Modeling of land surface evaporation by four schemes and comparison with FIFE observations. Journal of Geophysical Research D Atmospheres. 1996;101:7251–7268. [Google Scholar]
- Cosby BJ, Hornberger GM, Clapp RB, Ginn TR. A Statistical Exploration of the Relationships of Soil Moisture Characteristics to the Physical Properties of Soils. Water Resour Res. 1984;20:682–690. [Google Scholar]
- Davenport M, Nicholson S. On the relation between rainfall and the Normalized Difference Vegetation Index for diverse vegetation types in East Africa. International Journal of Remote Sensing. 1993;14:2369–2389. [Google Scholar]
- Dorigo W, Parinussa R, Scipal K, Liu Y, de Jeu R, Wagner W. Error characterisation of global active and passive microwave soil moisture data sets. Hydrol Earth Syst Sci. 2011;15:425–436. [Google Scholar]
- Dorigo WA, Gruber A, De Jeu RAM, Wagner W, Stacke T, Loew A, Albergel C, Brocca L, Chung D, Parinussa RM, Kidd R. Evaluation of the ESA CCI soil moisture product using ground-based observations. Remote Sensing of Environment. 2014 http://dx.doi.org/10.1016/j.rse.2014.07.023.
- Entekhabi D, Njoku EG, O’Neill PE, Kellogg KH, Crow WT, Edelstein WN, Entin JK, Goodman SD, Jackson TJ, Johnson J. The soil moisture active passive (SMAP) mission. Proceedings of the IEEE. 2010;98:704–716. [Google Scholar]
- Funk CC, Peterson PJ, Landsfeld MF, Pedreros DH, Verdin JP, Rowland JD, Romero BE, Husak GJ, Michaelsen JC, Verdin AP. A Quasi-global precipitation time series for drought monitoring. US Geological Survey Data Series. 2014;832 [Google Scholar]
- Guha-Sapir D, Below R, Hoyois P. EM-DAT: International Disaster Database Université Catholique de Louvain – Brussels – Belgium. 2015 http://www.emdat.be http://www.emdat.be.
- Gutman G, Ignatov A. The derivation of the green vegetation fraction from NOAA/AVHRR data for use in numerical weather prediction models. International Journal of Remote Sensing. 1998;19:1533–1543. [Google Scholar]
- Huffman GJ, Adler RF, Bolvin DT, Gu G. Improving the global precipitation record: GPCP Version 2.1. Geophysical Research Letters. 2009;36:L17808. [Google Scholar]
- Jia B, Liu J, Xie Z. Evaluation of a multi-satellite soil moisture product and the Community Land Model 4.5 simulation in China. 2015;12:5151–5186. [Google Scholar]
- Kumar SV, Reichle RH, Peters-Lidard CD, Koster RD, Zhan X, Crow WT, Eylander JB, Houser PR. A land surface data assimilation framework using the land information system: Description and applications. Advances in Water Resources. 2008;31:1419–1432. [Google Scholar]
- Liang X, Lettenmaier D, Wood E, Burges S. A simple hydrologically based model of land surface water and energy fluxes for general circulation models. J Geophys Res. 1994;99:415–414. [Google Scholar]
- Liang X, Wood E, Lettenmaier D. Surface soil moisture parameterization of the VIC-2L model: Evaluation and modification. Global and Planetary Change. 1996;13:195–206. [Google Scholar]
- Liu Y, Dorigo W, Parinussa R, De Jeu R, Wagner W, McCabe M, Evans J, Van Dijk A. Trend-preserving blending of passive and active microwave soil moisture retrievals. Remote Sensing of Environment. 2012;123:280–297. [Google Scholar]
- Liu Y, Parinussa R, Dorigo W, De Jeu R, Wagner W, Van Dijk A, McCabe M, Evans J. Developing an improved soil moisture dataset by blending passive and active microwave satellite-based retrievals. Hydrology and Earth System Sciences. 2011;15:425–436. [Google Scholar]
- Maidment RI, Grimes D, Allan RP, Tarnavsky E, Stringer M, Hewison T, Roebeling R, Black E. The 30 year TAMSAT African Rainfall Climatology And Time series (TARCAT) data set. Journal of Geophysical Research: Atmospheres. 2014;119:10,619–610,644. [Google Scholar]
- Maurer E, Wood A, Adam J, Lettenmaier D, Nijssen B. A long-term hydrologically based dataset of land surface fluxes and states for the conterminous United States. Journal of Climate. 2002;15:22. [Google Scholar]
- McNally A, Husak GJ, Brown M, Carroll M, Funk C, Yatheendradas S, Arsenault K, Peters-Lidard C, Verdin JP. Calculating Crop Water Requirement Satisfaction in the West Africa Sahel with Remotely Sensed Soil Moisture. Journal of Hydrometeorology. 2015;16:295–305. [Google Scholar]
- Mo KC, Chen LC, Shukla S, Bohn TJ, Lettenmaier DP. Uncertainties in North American Land Data Assimilation Systems over the Contiguous United States. Journal of Hydrometeorology. 2012;13:996–1009. [Google Scholar]
- Myneni R, Ramakrishna R, Nemani R, Running S. Estimation of global leaf area index and absorbed PAR using radiative transfer models. IEEE Transactions on Geoscience and Remote Sensing. 1997;35:1380–1393. [Google Scholar]
- Nachtergaele F, Van Velthuizen H, Verelst L, Batjes N, Dijkshoorn K, Van Engelen V, Fischer G, Jones A, Montanarella L, Petri M. Harmonized world soil database. Food and Agriculture Organization of the United Nations; 2008. [Google Scholar]
- Nijssen B, Lettenmaier D, Liang X, Wetzel S, Wood E. Streamflow simulation for continental-scale river basins. Water Resources Research. 1997;33:711–724. [Google Scholar]
- Nijssen B, Schnur R, Lettenmaier D. Global retrospective estimation of soil moisture using the variable infiltration capacity land surface model, 1980–93. Journal of Climate. 2001;14:1790–1808. [Google Scholar]
- Nijssen B, Shukla S, Lin C, Gao H, Zhou T, Ishottama, Sheffield J, Wood EF, Lettenmaier DP. A Prototype Global Drought Information System Based on Multiple Land Surface Models. Journal of Hydrometeorology. 2014;15:1661–1676. [Google Scholar]
- Peterson P, Funk C, Husak G, Pedreros D, Landsfeld M, Verdin J, Shukla S. The Climate Hazards group InfraRed Precipitation (CHIRP) with Stations (CHIRPS): Development and Validation, AGU Fall Meeting. 2014 ftp://chg-dub.geog.ucsb.edu/pub/org/chg/people/share/AGU.2013Fall/AGU.2013CHIRPS.pete-from-tif.pdf.
- Pinzon J, Brown ME, Tucker CJ. Satellite time series correction of orbital drift artifacts using empirical mode decomposition. Hilbert-Huang transform: introduction and applications. 2005;16 [Google Scholar]
- Pinzon JE, Tucker CJ. A Non-Stationary 1981-2012 AVHRR NDVI3g Time Series. Remote Sensing. 2014;6:6929–6960. [Google Scholar]
- Reichle RH, Koster RD, De Lannoy GJM, Forman BA, Liu Q, Mahanama SPP, Touré A. Assessment and Enhancement of MERRA Land Surface Hydrology Estimates. Journal of Climate. 2011;24:6322–6338. [Google Scholar]
- Reynolds CA, Jackson TJ, Rawls WJ. Estimating soil water-holding capacities by linking the Food and Agriculture Organization Soil map of the world with global pedon databases and continuous pedotransfer functions. Water Resources Research. 2000;36:3653–3662. [Google Scholar]
- Senay GB, Verdin J. Evaluating the performance of a crop water balance model in estimating regional crop production. Proceedings of the Pecora 15 Symposium; Denver, CO. 2002. [Google Scholar]
- Sheffield J, Wood EF, Chaney N, Guan K, Sadri S, Yuan X, Olang L, Amani A, Ali A, Demuth S, Ogallo L. A Drought Monitoring and Forecasting System for Sub-Sahara African Water Resources and Food Security. Bulletin of the American Meteorological Society. 2014;95:861–882. [Google Scholar]
- Shukla S, McNally A, Husak G, Funk C. A seasonal agricultural drought forecast system for food-insecure regions of East Africa. Hydrol Earth Syst Sci Discuss. 2014;11:3049–3081. [Google Scholar]
- Traore AK, Ciais P, Vuichard N, Poulter B, Viovy N, Guimberteau M, Jung M, Myneni R, Fisher JBCJG. Evaluation of the ORCHIDEE ecosystem model over Africa against 25 years of satellite-based water and carbon measurements. 2014;119:1554–1575. [Google Scholar]
- Troy TJ, Wood EF, Sheffield J. An efficient calibration method for continental-scale land surface modeling. Water Resources Research. 2008;44:W09411. [Google Scholar]
- Tucker CJ, Pinzon JE, Brown ME, Slayback DA, Pak EW, Mahoney R, Vermote EF, El Saleous N. An extended AVHRR 8-km NDVI dataset compatible with MODIS and SPOT vegetation NDVI data. International Journal of Remote Sensing. 2005;26:4485–4498. [Google Scholar]
- Verdin J, Funk C, Senay G, Choularton R. Climate science and famine early warning. Philosophical Transactions of the Royal Society B: Biological Sciences. 2005;360:2155. doi: 10.1098/rstb.2005.1754. [DOI] [PMC free article] [PubMed] [Google Scholar]
- Verdin J, Klaver R. Grid-cell-based crop water accounting for the famine early warning system. Hydrological Processes. 2002;16:1617–1630. [Google Scholar]
- Wagner W, Dorigo W, de Jeu R, Fernandez D, Benveniste J, Haas E, Ertl M. Fusion of active and passive microwave observations to create an essential climate variable data record on soil moisture 2012 [Google Scholar]
- Yilmaz MT, Anderson MC, Zaitchik B, Hain CR, Crow WT, Ozdogan M, Chun JA, Evans J. Comparison of prognostic and diagnostic surface flux modeling approaches over the Nile River basin. Water Resources Research. 2014;50:386–408. [Google Scholar]
- Yuan X, Ma Z, Pan M, Shi CCGL. Microwave remote sensing of short-term droughts during crop growing seasons. 2015 http://dx.doi.org/10.1002/2015GL064125, n/a-n/a.
- Zeng J, Li Z, Chen Q, Bi H, Qiu J, Zou P. Evaluation of remotely sensed and reanalysis soil moisture products over the Tibetan Plateau using in-situ observations. 2015;163:91–110. [Google Scholar]